Transcription
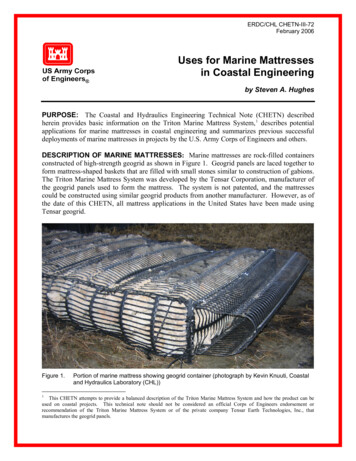
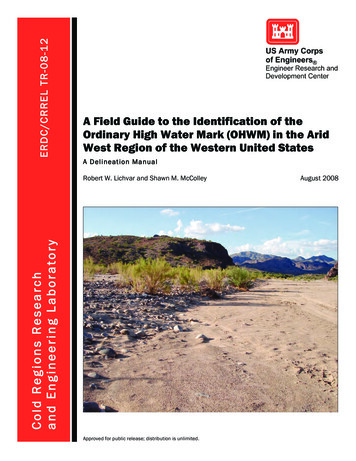
ERDC/CHL CHETN-XIV-3June 2001 (rev. June 2003)Sediment Budget Analysis System (SBAS):Upgrade for Regional Applicationsby Julie D. Rosati and Nicholas C. KrausPURPOSE. This Coastal and Hydraulics Engineering Technical Note (CHETN) describes amajor upgrade of the Sediment Budget Analysis System (SBAS) to include the capability tocreate and manage regional sediment budgets. The SBAS is a PC-based application forcalculating and displaying local and regional sediment budgets including single and multipleinlets, estuaries, bays, and adjacent beaches. The SBAS runs on the Windows 95, 98, and NToperating systems. Features of the original SBAS Version 1.0 are discussed in Rosati and Kraus(1999a), and these features are also supported in SBAS Version 1.02, which covers regionalprocesses. This CHETN introduces recent upgrades that support regional applications. A tutorialis available as discussed at the end of this technical note.BACKGROUND. A regional characterization of coastal and riverine sediment transport ratesand magnitudes, as well as the engineering activities within the region (dredging and placementof littoral resources), is a basic component in designing and evaluating the response of projectswithin the watershed. The regional sediment budget quantifies these natural sediment transportprocesses and anthropogenic activities. SBAS is a tool that allows multiple local (project-level)sediment budgets to be included within one or more regional sediment budgets. Features ofSBAS have been implemented to facilitate creation and display of both the local and regionalsediment budgets, as discussed herein. First, a review of sediment budget methodology ispresented as summarized from Rosati and Kraus (1999b).SEDIMENT BUDGET. A sediment budget is a tally of sediment gains and losses, orsources and sinks, within a specified control volume (or cell), or in a series of connecting cells,over a given time. There are numerous ways of formulating a sediment budget (US Army Corpsof Engineers 1984, Jarrett 1991, Bodge 1999, Mann 1999). The algebraic difference between thesediment sources and the sinks in each cell, hence, for the entire sediment budget, must equal therate of change in sediment volume occurring within that region, accounting for possibleengineering activities. Expressed in terms of variables consistent as volume or as volumetric rateof change, the sediment budget equation is:- ΔV P – R ResidualEquation (1)where Qsource and Qsink are the sources and sinks to the control volume, respectively, ΔV is thenet change in volume within the cell, P and R are the amounts of material placed in and removedfrom the cell, respectively, and Residual represents the degree to which the cell is balanced. Fora balanced cell, the residual is zero. Figure 1 schematically illustrates the parameters appearingin Equation 1, in which LST denotes longshore sediment transport. For a reach of coastconsisting of many contiguous cells, the budgets for individual cells must balance in achieving abalanced budget for the entire reach.Approved for public release; distribution is unlimited. Destroy when no longer needed; do not return to the originator.
ERDC/CHL CHETN-XIV-3June 2001 (rev. June 2003)As noted in Figure 1, sources in the sediment budget include longshore sediment transport,erosion of bluffs, transport of sediment to the coast by rivers, erosion of the beach, beach fill anddredged material placement as from navigation channel maintenance, and a relative sea level fall.Examples of sediment budget sinks are longshore sediment transport, accretion of the beach,dredging and mining of the beach or nearshore area, relative sea level rise, and losses to asubmarine canyon.Figure 1. Sediment budget parameters that may enter Equation 1.Longshore transport rates require two directions, which can be defined either through the pair ofrates as left- and right-directed or as net and gross. The net longshore transport rate is defined asthe difference between the right-directed and left-directed littoral transport over a specified timeinterval for a seaward-facing observer, QR – QLEquation (2)in which the left-directed transport QL and right-directed transport QR are taken as positive. Thegross longshore transport rate is defined as the sum of the right-directed and left-directed littoraltransport over a specified time interval for a seaward-facing observer,Qgross QR QLEquation (3)An inlet channel may capture much of the left- and right-directed components of the longshoretransport, and the inlet system may bypass left- and right-directed longshore transport. Thus,knowledge of the net and gross transport rates, as well as pathways of sediment transport for leftand right-directed dominance (as might occur during seasons of net transport reversal), arerequired to accurately represent transport within the vicinity of inlets (Bodge 1993). The net orpredominant direction of longshore sediment transport at an inlet or at a groin or jetty can usuallybe inferred by the asymmetry in geomorphology at the site (Carr and Kraus 2001). Theasymmetry can be related to the ratio of net to gross longshore transport Qnet/Qgross which variesfrom zero (balanced left- and right-directed longshore transport, hence near-symmetricalmorphology) to unity (unidirectional longshore transport).2
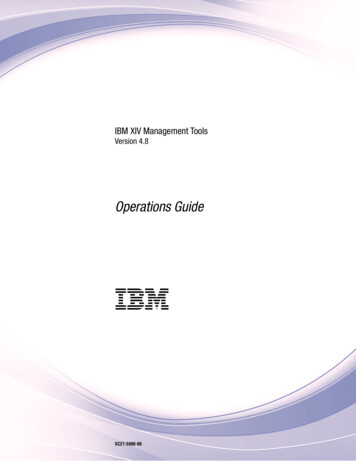
ERDC/CHL CHETN-XIV-3June 2001 (rev. June 2003)FEATURES OF SEDIMENT BUDGET ANALYSIS SYSTEM (SBAS). SBAS isoperated within a graphic-based interface to solve Equation 1 for each cell and any combinedcells. The user drags and pulls the mouse to form squares or rectangles (sediment budget cells),and to form arrows (sources and sinks) into and out of each cell (Figure 2). Volume changes (orvolume change rates) are entered in the cell menu, which is accessed by double-clicking at a cell(Figure 3). Engineering activities (placement and removal volumes or rates) can be entered usingthe upper toolbar. Color-coding of the cells indicates whether the cell is balanced or not (Figure4). Figure 5 details the functions of the upper and lower toolbars.Figure 2. Creating sediment budget cells, sources, and sinks.Figure 3. Cell properties menu (accessed by double-clicking on a cell).3
ERDC/CHL CHETN-XIV-3June 2001 (rev. June 2003)Figure 4. Color-coding indicates cell imbalance; Topology window (righthand side), and Alternatives window (left-hand side).Figure 5. SBAS toolbars and button functions.4
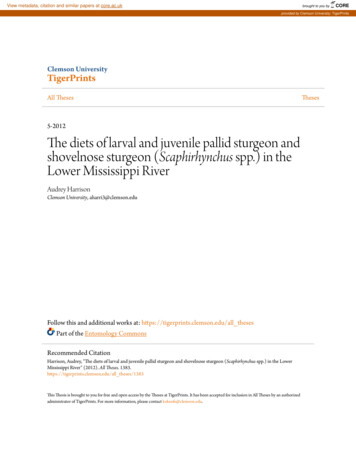
ERDC/CHL CHETN-XIV-3June 2001 (rev. June 2003)SBAS has been designed to organize the user’s workspace and facilitate development andvisualization of alternative sediment budgets. Within the right-hand side of the screen, called theTopology window (Figure 4, right-hand side), SBAS formulates a sediment budget by allowing theuser to create a series of cells and arrows representing sources and sinks that characterize the budget.Elements can be selected conveniently from the upper toolbar to generate a sediment budget.The left-hand side of the screen organizes alternatives within a particular project (Figure 4, lefthand side). Alternatives may represent various time periods, different boundary conditions forthe same time period, or modifications to assumptions within the budget reflecting a sensitivityanalysis. Once a sediment budget alternative has been defined, and the user has created sedimentbudget cells with sources and sinks, values can be assigned to the various components of thesediment-budget topology.The lower toolbar allows the import of geo-referenced images and data into a desired coordinatesystem (Figure 5), which can beviewed with the sediment budget in the Topology window. Theuser can zoomout to view the regional sediment budget (see Figure 6, which shows the Gulf ofMexico shore of Alabama and Florida panhandle), and zoom in to show a detailed area (Figure7). By dragging the cursor over any combination of cells, sediment budget cells can be combined(“collapsed”), as shown in Figure 7. A collapsed cell combines all sources and sinks for theselected cells, and is useful in regional views of a sediment budget. For local, project-levelapplications, selecting the collapsed cell and choosing an icon from the bottom toolbar willreinstate (“explode”) the collapsed cell (Figure 8).Figure 6. Regional view of a sediment budget (zoom out), with alternatives.5
ERDC/CHL CHETN-XIV-3June 2001 (rev. June 2003)Figure 7. Local view of a sediment budget (zoom in) showing combined(“collapsed”) sediment budget cells.Figure 8. Sediment budget with reinstated (“exploded”) cells.6
ERDC/CHL CHETN-XIV-3June 2001 (rev. June 2003)SBAS can also display data on shoreline change and the rate of volume change associated withstations located along the coast, bay, or river (Figure 9). Station locations and associated datamay be entered directly into SBAS’s spreadsheet (Figure 10), or data may be imported using auser-specified format.Geo-referenced images can be imported into SBAS by means of the Load Map/Picture Layer onthe bottom toolbar. This menu (Figure 11) allows the user to indicate the coordinate system(group, system, datum, and linear unit) in which the sediment budget project will be defined.Next, the maps to be imported are selected, and their coordinate system is selected. SBASconverts the map’s coordinate system to the project coordinate system. Multiple images (maps,aerial photographs, contour maps, etc.) can be layered in the sediment budget. SBAS allows for55 different map coordinate systems.Figure 9. Rate graph feature of SBAS.Figure 10. Volume Edit spreadsheet in SBAS.7
ERDC/CHL CHETN-XIV-3June 2001 (rev. June 2003)Figure 11. Entering project coordinate system with the Load Map/Picture Layerfeature on the bottom toolbar.EXAMPLE SEDIMENT BUDGET FOR HILLSBORO INLET, FL. The text thatfollows describes the operation and features of SBAS Version 1.02, available for viewing on thePC. The SBAS installation includes an example file with geo-referenced images, a sedimentbudget, and rate graph. The example problem, sediment budget development for Hillsboro Inlet,FL, guides the use of these files.Step 1: Activate SBAS and Enter Information to the DocumentProperties Menu. Information such as the manager of the project, keywords, units, andtype of uncertainty calculation are entered into this menu (see Kraus and Rosati 1998 for detailsabout the uncertainty calculation). Note that the user should choose the same project coordinatesystem and consistent units for the transport rate or volume change (e.g., if the project coordinatesystem will be in US customary units, rates should be expressed as cubic yards per year[yd3/year] and volume as cubic yards [yd3]).Step 2: Import Geo-referenced Images. To import the map provided in theinstallation, activate the Topology window (right-hand side of the screen) by clicking in thisarea. Choose the globe on the bottom toolbar. The user first defines the desired projectcoordinate system as follows: Group: US State Plane 1927System: Florida East 901Datum: NAD 27Units: USFEETSelect OKThen, load the map provided in the installation with the Connect Map Layer menu. Select thefollowing files:Conus12.tif (image) and Conus12.tab (reference file)8
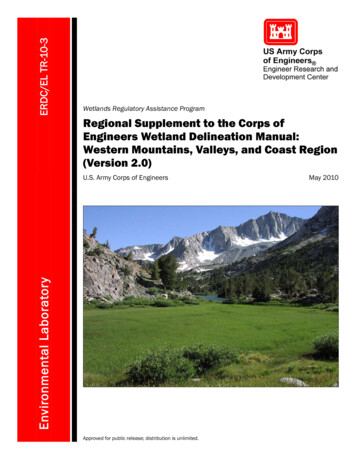
ERDC/CHL CHETN-XIV-3June 2001 (rev. June 2003)On the next menu, indicate that these files are in:Group: Geodetic Latitude/LongitudeSystem: Latitude/LongitudeDatum: WGS84(If the image is not visible, select “release zoom” on the bottom toolbar.)Step 3: Import a Photograph. Choose the globe on the bottom toolbar and importanother map layer. Select the following files:Br21-38.tif (image), and Br21-38.tfw (reference file) (photographof Hillsboro Inlet, FL, and associated world file)On the next menu, indicate that these files are in the following coordinate system (same as theproject coordinate system):Group: US State Plane 1927System: Florida East 901Datum: NAD27Units: USFEETThe coordinate system for the layers that have been loaded can be viewed by choosing the EditCurrent Selection Properties button on the bottom toolbar.Step 4: Create a Sediment Budget for Hillsboro Inlet, FL. Access the toptoolbar, select the cell button, and drag and pull sediment budget cells. Cells may be rotated tobetter represent different areas of the budget (the channel, for instance) by choosing the rotatebutton on the top toolbar and rotating a corner of a selected cell. Placement and removal in cellsmay be indicated by choosing the P and R buttons on the top toolbar, respectively, then clickingon the cell that has the engineering activity. Sediment sources and sinks to and from each cellmay be indicated by selecting the arrow button on the top toolbar, and dragging arrows into andout of each cell as appropriate. Double-clicking on a cell will bring up the Cell Properties menu(see Figure 3), and values for each sediment budget element can be entered.Cells can be collapsed by selecting the Select Items to be Collapsed button on the bottom toolbar,and dragging the cursor over the items to be combined. The cells may be reinstated by selectingthe collapsed cell, then choosing the Expand Collapsed Items on the bottom toolbar. Note: colorsof cell balance, gain and loss, arrows, and other sediment budget elements may be changed byselecting the Object Colors button at the top toolbar.The sediment budget for Hillsboro Inlet, FL, can be formulated with three cells; (1) updrift, (2)channel, and (3) downdrift. The sediment budget has been summarized by Thomas D. Smith, USArmy Engineer District, Jacksonville (personal communication), and has been conceptualized inFigure 12.9
ERDC/CHL CHETN-XIV-3June 2001 (rev. June 2003)Figure 12. Sediment budget for Hillsboro Inlet, FL. Updrift cell: Net longshore sand transport entering the north boundary of the updrift cell isapproximately 120,000 yd3/year. Sinks from this cell include accretion of the updrift beach ata rate of 6,000 yd3/year, 54,000 yd3/year transported over the north jetty weir section to thechannel cell, and 60,000 yd3/year moving around the jetty into the channel cell. Channel cell: The source of sediment to this cell is 30,000 yd3/year moving into thechannel from the downdrift cell. Sinks from this cell include 4,000 yd3/year transportedto deep water on ebb flow, 110,000 yd3/year dredged from the channel and placed withinthe downdrift cell, and 30,000 yd3/year naturally bypassed from the channel to thedowndrift cell. Downdrift cell: Dredged material placement into this cell is 110,000 yd3/year, which isalso the value of net longshore transport exiting this cell. The downdrift cell transportsapproximately 30,000 yd3/year to the channel cell during periods of reversal, and alsoreceives 30,000 yd3/year from the channel cell that bypasses the inlet. The beach isassumed to be stable.10
ERDC/CHL CHETN-XIV-3June 2001 (rev. June 2003)Step 5: Enter Shoreline Change Rate Data for Hillsboro Inlet. Select theDraw Stations button on the bottom toolbar, and visually place benchmarks for shoreline data onthe photograph. (If a pre-existing file with data is available, these station locations may also beimported to the SBAS Rate Graph spreadsheet). Once all stations have been entered, choose theView-Rate Graph button on the top toolbar, select the rate graph (named Untitled at this point),and choose Edit. Shoreline change (or volume change) data may be entered for each benchmarkposition. SBAS automatically plots these data in the rate graph. Selecting and dragging willmove the graph, and de-selecting the graph after clicking the View-Rate Graph button on the toptoolbar can turn it off. An example is shown in Figure 13.Figure 13. Hypothetical shoreline change data forbeaches adjacent to Hillsboro Inlet, FL.FUTURE VERSION OF SBAS. SBAS Version 1.02, described herein, is being modifiedto be an extension of ArcView ’s Geographic Information System (GIS), called SBAS-A.Linkages between ArcView and SBAS-A will be transparent to the user, so that GIS data canbe readily accessed within the sediment budget system. Both SBAS (non-GIS, described in thisCHETN and in Rosati and Kraus [1999b]) and SBAS-A (extension of ArcView ) will bemaintained and upgraded separately.OBTAINING SBAS. Users in US Army Corps of Engineer Districts, Divisions, andLaboratories can obtain SBAS and the SBAS demonstration by contacting Alan Cialone(Alan.Cialone@usace.army.mil). The software is being distributed to other users (privateconsultants, academia, other governmental agencies) by a private company with whom theCoastal and Hydraulics Laboratory has a Cooperative Research and Development Agreement11
ERDC/CHL CHETN-XIV-3June 2001 (rev. June 2003)(CRDA). A reduced purchase price has been established for school departments and students.For these users, SBAS2000 may be obtained from Veri-Tech, Incorporated,http://www.veritechinc.com . P.O. Box 568, Summit, MS, 39666, info@veritechinc.com.ADDITIONAL INFORMATION. This Coastal and Hydraulics Engineering Technical Note(CHETN) was written by Drs. Julie D. Rosati and Nicholas C. Kraus, Coastal and HydraulicsLaboratory, US Army Engineer Research and Development Center (ERDC), Vicksburg, MS.The research was jointly supported by the Coastal Inlets Research Program, Inlet Channels andAdjacent Shorelines work unit; and by the Coastal Sedimentation and Dredging Program,Regional-Scale Modeling Morphology Change and Sediment Transport work unit. Additionalinformation pertaining to the Coastal Inlets Research Program (CIRP) can be found at the CIRPweb site http://cirp.usace.army.mil and pertaining to the Regional Sediment Management (RSM)program can be found at the RSM web site http://rsm.usace.army.milQuestions pertaining to this CHETN may be addressed to:Dr. Julie D. RosatiJulie.D.Rosati@usace.army.milLinda S. Lillycrop(RSM Program Manager)Linda.S.Lillycrop@usace.army.milThis ERDC/CHL CHETN-XIV-3 should be cited as follows:Rosati, J.D., and N.C Kraus. 2001 (revised 2003). Sediment budget analysissystem (SBAS): Upgrade for regional applications. Coastal and HydraulicsEngineering Technical Note ERDC/CHL CHETN-XIV-3. Vicksburg, MS: USArmy Engineer Research and Development Center, Coastal and HydraulicsLaboratory. s/chetn/pdf/chetn-xiv-3.pdfREFERENCES.Bodge, K. R. 1993. Gross transport effects at inlets. Proceedings, 6th Annual National Conference onBeach Preservation Technology. Tallahassee, FL: Florida Shore and Beach PreservationAssociation. pp. 112-127.Bodge, K. R. 1999. Inlet impacts and families of solutions for inlet sediment budgets. In Proceedings,Coastal Sediments ’99. Hauppauge, NY: American Society of Civil Engineers. pp. 703-718.Carr, E. E. and N. C Kraus. 2001. Morphologic asymmetries at entrances to tidal inlets. Coastal andHydraulics Engineering Technical Note ERDC/CHL CHETN-IV-33. Vicksburg, MS: US ArmyEngineer Research and Development Center, Coastal and Hydraulics publications/chetn/pdf/chetn-iv-33.pdfJarrett, T. 1991. Coastal sediment budget analysis techniques. Proceedings, Coastal Sediments ’91.Seattle, WA: American Society of Civil Engineers. pp. 2,223-2,233.Kraus, N. C. and J. D. Rosati. 1998. Estimation of uncertainty in coastal sediment budgets at inlets.Coastal and Hydraulics Engineering Technical Note CHETN-IV-16. Vicksburg, MS: US ArmyEngineer Waterways Experiment Station, Coastal and Hydraulics publications/chetn/pdf/chetn-iv-16.pdfKraus, N. C., H. Hanson, and S. Blomgren. 1994. Modern functional design of groins. Proceedings, 24thCoastal Engineering Conference. Kobe, Japan: American Society of Civil Engineers. pp. 1,3271,342.12
ERDC/CHL CHETN-XIV-3June 2001 (rev. June 2003)Mann, D. W. 1999. The importance of inlet littoral budget variability. Proceedings, Coastal Sediments’99. Hauppauge, NY: American Society of Civil Engineers. pp. 688-702.Rosati, J. D. and N. C. Kraus. 1999a. Sediment budget analysis system (SBAS). Coastal and HydraulicsEngineering Technical Note CHETN-IV-20. Vicksburg, MS: US Army Engineer Research andDevelopment Center, Coastal and Hydraulics publications/chetn/pdf/chetn-iv-20.pdfRosati, J. D. and N. C. Kraus. 1999b. Formulation of sediment budgets at inlets. Coastal and HydraulicsEngineering Technical Note CHETN-IV-15. Vicksburg, MS: US Army Engineer Research andDevelopment Center, Coastal and Hydraulics publications/chetn/pdf/chetn-iv-15.pdfUS Army Corps of Engineers. 1984. Shore Protection Manual. 4th edition, 2 Vol. Washington, DC: USGovernment Printing Office. ote: The contents of this technical note are not to be used for advertising, publication, orpromotional purposes. Citation of trade names does not constitute an official endorsement orapproval of the use of such products.13
A tutorial is available as discussed at the end of this technical note. BACKGROUND. A regional characterization of coastal and riverine sediment transport rates . to unity (unidirectional longshore transport). ERDC/CHL CHETN-XIV-3 June 2001 (rev. June 2003) 3 . Color-coding of the cells indicates whether the cell is balanced or not (Figure .