Transcription
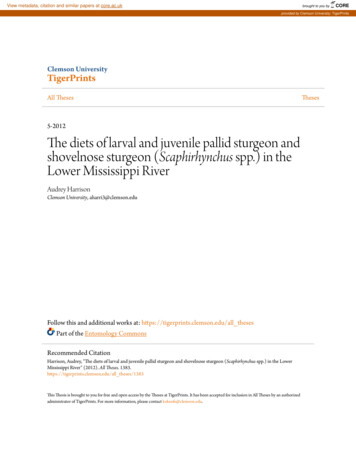
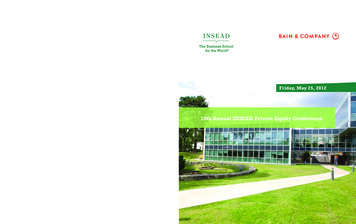
ERDC/TN EQT-16-2August 2016Verification and Evaluation of AquaticContaminant Simulation Module (CSM)by Zhonglong Zhang and Billy E. JohnsonPURPOSE: The United States Army Engineer Research and Development Center (ERDC)developed the aquatic contaminant simulation module (CSM). The overall purpose of the CSM is toprovide a “plug in” contaminant simulation module for existing hydrologic and hydraulic (H&H)models. The CSM computes internal source and sinks for a wide range of contaminants for bothwater column and underlying sediment layer. Likewise, it was written as a dynamic link library(DLL) and compiled as CSM.dll. The CSM is independent of the dimensionality of the spatialdomain and has general applicability to aquatic systems. In addition, it has been integrated into theHydrologic Engineering Center-River Analysis System (HEC-RAS) (HEC 2010a, b) and Soil andWater Assessment Tool (SWAT) (Arnold et al. 1998, Neitsch et al. 2011). It will also be integratedinto ERDC's Adaptive Hydraulics (AdH) model (Berger et al. 2012).The CSM has been verified and evaluated through a series of test cases. In these tests, CSMcomputed results were compared to observed data available in published literatures and similaroutputs generated from the RECOVERY model (Boyer et al. 1994, Ruiz et al. 2000) and Waterquality Analysis Simulation Program (WASP) model (Wool et al. 2006). This technical note (TN)describes the results of the model verification and evaluation studies. Likewise, this TN alsoprovides information about the CSM parameter inputs and capabilities.BRIEF DESCRIPTION OF CONTAMINANT SIMULATION MODULE (CSM): The CSM wasdesigned to compute kinetics of contaminants in aquatic systems. Figure 1 depicts the conceptualrepresentation of a contaminant kinetics modeled in CSM. The model domain is conceptualized as awell-mixed water column underlain by an active sediment layer. Each chemical species in the watercolumn is subject to adsorption and desorption. In CSM, the truly dissolved phase in bulk water(aqueous phase), sorbed phase to dissolved organic carbon (DOC), algae, and sorbed phases to solidsare modeled for the water column. Solid particles consist of an inorganic fraction (e.g., silts, andclays) and an organic fraction (e.g., algae, zooplankton, bacteria, and detritus). Natural waters cancontain a mixture of solid particles ranging from gravel (2 mm to 20 mm) or sand (0.07 mm to2 mm) down to very small particles classified as silt or clay (smaller than 0.07 mm). The finefraction of solids is characterized as cohesive sediment. From a water quality perspective, cohesivesediments are usually of greater importance in water quality modeling. The chemical species in theactive sediment layer is also partitioned into corresponding forms: truly dissolved phase in the porewater, sorbed phase to DOC in the pore water, and sorbed phase to the sediments. Suspended solidsand underlying sediments have two types of partitioning options: equilibrium and non-equilibrium.The air compartment can be considered a sink for volatile contaminants. In CSM, contaminants canenter the water column via surface runoff, atmospheric deposition, and/or direct discharge. Oncecontaminants are in aquatic systems, they may be degraded or transformed by various processesApproved for public release; distribution is unlimited.
ERDC/TN EQT-16-2August 2016shown in Figure 1. The following processes are modeled in CSM: ionization, multi-phasepartitioning, degradation, photolysis, hydrolysis, volatilization, generalized second-order reactionand transformations. The relative importance of each of the processes is directly governed by thecontaminant species and their properties. The theory and mathematical formulations included inCSM can be found in Zhang and Johnson (2016).Figure 1.Conceptual representation of contaminant processes modeled in CSM.In CSM, the sediment layer represents the upper mixed layer and may be on the order of severalcentimeters thick due to bioturbation and mixing. The mass balance of contaminants must be trackedfor the sediment layer in the underlying water column. The sediment layer in CSM is assumed ashomogeneous (i.e., well mixed), and the model does not change the thickness of sediment layer duringthe simulation. As the sediment layer accepts a new sediment increment on the top, an equal amount isremoved from the sediment layer for burial. When sediment re-suspension occurs, it is assumed thatdeeper sediments below this sediment layer are entrained into the upper layer and then mixed with theremaining sediments. The density of the sediment layer can vary depending on the variable sedimentcomposition. The porosity within the sediment layer is assumed constant and user defined.Concentrations of the contaminant computed in CSM for the sediment layer include dissolved, DOCsorbed, particulate organic matter (POM), and solids sorbed phases. All concentrations in source andsink term equations in CSM, including those for sediment contaminants, are expressed in terms of massper unit volume of water plus solids (µg L-1). This method is more amenable to integration with H&Htransport models, for which the common concentration units are mass per unit volume. Table 1 lists theCSM’s output concentrations for each contaminant.2
ERDC/TN EQT-16-2August 2016Table 1. Computed concentrations of each contaminant in Cpom2Cpt2Cpts2DefinitionWater columnTotal concentration in waterIonic concentration in waterConcentration of dissolved phase in waterConcentration of DOC sorbed phase in waterConcentration of algae sorbed phase in waterConcentration of POM sorbed phase in waterTotal concentration of solids sorbed phase in waterTotal concentration of solids sorbed phase in waterSediment layerTotal concentration in sedimentIonic concentration in waterConcentration of dissolved phase in pore waterConcentration of DOC sorbed phase in pore waterConcentration of POM sorbed phase in sedimentTotal concentration of solids sorbed phase in sedimentTotal concentration of solids sorbed phase in sedimentUnitsµg L-1µg L-1µg L-1µg L-1µg L-1µg L-1µg L-1µg g-1µg L-1µg L-1µg L-1µg L-1µg L-1µg L-1µg g-1VERIFICATION STUDIES: An important category of a newly developed CSM includes thealgorithm tests normally associated with verification of computer codes. Algorithm tests servemultiple purposes. They are intended, in part, to discover bugs and, in part, to verify the merit of thealgorithm to solve the problems. Therefore, we conducted a set of model testing cases to verify theCSM and evaluate the model performance. The CSM was first verified against field-scaleexperiment data included in the RECOVERY model (Boyer et al. 1994). The benefits of CSM fieldverification efforts are significant, including confirming the CSM to field conditions. Since the keykinetic algorithms in CSM are adopted from the WASP model, results generated from WASP wereused to verify the CSM. The CSM and WASP models were run with a consistent set of kineticcoefficients and parameters and initial conditions in all test cases. In addition, non-linear and nonequilibrium sorptions can be modeled in CSM for algae, POM, and solids, but these mechanisms arenot included in the WASP model. Therefore, the CSM was further tested and evaluated throughseveral special cases and sensitivity analysis.Field Data Verification. The CSM was used to analyze a field-scale experiment in which a floodedlimestone quarry was treated with equal amounts of the insecticides Dichlorodiphenyldichloroethylene(DDE) and lindane. The study was conducted in two flooded limestone quarries (T and C) located nearthe town of Oolitic in Bedford County, IN. The quarries were allowed to flood naturally for five yearsbefore being dosed with DDE and lindane. Quarry T was the smaller of the two in area, with extremelyclear water and generally flat bottom. Quarry T was 91.4 m long, 41.1 m wide, and an average of15.2 m deep. The water depth in the quarry was 13.9 m. The average Secchi disc reading for quarries Cand T was 20 ft. Both quarries exhibited thermal stratification from March to November. The bottommaterial in quarry T was made up of 3 to 5 cm of fine brownish gyttja underlain by a white inorganicmixture of limestone dust and silica sand. In general, the top sediment layers were aerobic, while themud layer contained, on average, 1% sand, 42% silt, and 57% clay.3
ERDC/TN EQT-16-2August 2016Quarry T was treated with DDE and lindane at a concentration of 200 ppt to the epilimnion or 50 pptoverall (2.7764 g of DDE and 2.7752 g of lindane) (Waybrant 1973). The quarries were analyzedafter the treatment, and the results showed that essentially all of the insecticides were initiallyreleased in the epilimnion. The quarries were periodically sampled, and both water and bottomsediments were analyzed for DDE and lindane. The detailed data used in this test case is available inDi Toro and Paquin (1982) and Boyer et al. (1994). This experiment was previously analyzed withthe RECOVERY model. The RECOVERY model results for DDE and lindane in the water columnand bottom sediment material were provided in Boyer et al. (1994) and Ruiz et al. (2000).Initial water concentration for DDE was set to 3.5·10-3 µg L-1 and 2.54·10-2 µg L-1 for lindane. Theinitial sediment concentration was set to 3.53·10-2 µg L-1 for DDE and 1.87·10-3 µg L-1 for lindane.Suspended solids were set to 5 mg L-1. Resuspension was set to zero, and the burial velocity was setto 5.0·10-4 m year-1. Di Toro and Paquin (1982) indicated that the inflow to the quarry was assumedto be insignificant in comparison to the overall volume of water in the quarry, so inflow loads areignored in CSM simulation. The settling velocity was set to 87.5 m year-1, which was estimated fromthe solids mass balance in RECOVERY (Boyer et al. 1994). In addition to sedimentation processes(i.e., settling and burial), kinetic processes modeled for DDE and lindane included partitioning,degradation, and volatilization. Table 2 provides a summary of DDE and lindane parameters used inthis verification study. Other parameters for DDE and lindane were provided in Boyer et al. (1994).Table 2. Summary of DDE parameters used in the CSM 4354.65.0·10-61.37·10-60.01Unitsm d-1m yr-1g mol-1cm2 s-1cm s-1m5.0·1041.54·1030.051.54·103L kg-1L kg-10.05-vvKHDefinitionSettling velocityBurial velocityMolecular weightMolecular diffusivitySediment-water mass transfer velocitySediment layer thicknessEquilibrium partitioningOctanol-water partitioning coefficientEquilibrium partition coefficient for solids in waterFraction of organic carbon in suspended solidsEquilibrium partition coefficient for solids insedimentsFraction of organic carbon in sediment solidsVolatilizationVolatilization velocityHenry’s constant0.140583.9·10-5KGKLMass transfer velocity from the gaseous filmMass transfer velocity from the liquid film58213108.9m d-1atm m3 (gmol oK)-1m d-1m d-1KowKpfocKp2foc2The information in Tables 2 and 3 was used to fill out the Input Parameters from the CSM userinterface. The CSM was setup to simulate DDE and lindane for a 10 year period. Excludingadjustments made for the sediment-water transfer velocity, minimum calibration was performed duringverification. The total concentrations, dissolved, and solid sorbed phases of DDE and lindane in the4
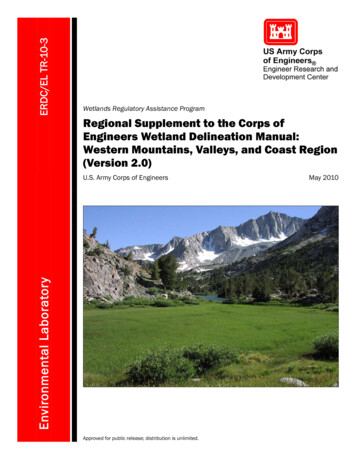
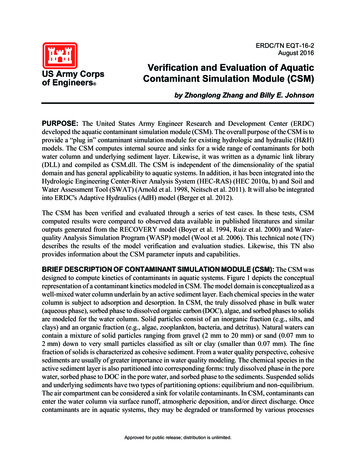
ERDC/TN EQT-16-2August 2016water column and upper sediment layer were reported in model outputs. The CSM simulation resultswere compared with observed data. The comparisons between computed CSM and observed DDEconcentrations for the water column and upper sediment layer are presented in Figures 2 and 3. Majorlosses of DDE from the water column are caused by settling of suspended solids, attached DDE, andthe volatilization process. The only removal mechanism in the sediment layer is deep burial. Thesediment-water transfer flux is small. The model prediction does not represent range established for theobserved data at the beginning of the simulation. The field data are strongly subject to dailyfluctuations, which affect the simulation for DDE with the calibrated parameters where the same regionpresents DDE in accordance with the trend observed for DDE. Despite the variability in measured data,modeled DDE values captured the major trends of DDE temporal variation in both water column andsediment layer. A strong indication of the model prediction with the observed data is found after fiveyears. Computed DDE in the water column agrees very well with the observed concentration of lessthan 1·10-3 µg L-1. The CSM over-predicts the DDE concentration of 5.6 µg L-1 in the upper sedimentlayer after five years. Likewise, the RECOVERY model also produced similar results (Boyer et al.1994).Table 3. Summary of lindane parameters used in the CSM �10-60.035.01·1031.54·1020.051.54·1020.05L kg-1L kg-1-10.90.010.90.0d-1d-1d-1d-1vvKHSettling velocityBurial velocityMolecular weightMolecular diffusivitySediment-water mass transfer velocitySediment layer thicknessEquilibrium partitioningOctanol-water partitioning coefficientEquilibrium partition coefficient for solids in waterFraction of organic carbon in suspended solidsEquilibrium partition coefficient for solids in sedimentsFraction of organic carbon in sediment solidsDegradationDegradation order in waterDegradation rate for dissolved phase in waterDegradation rate for solids sorbed phase in waterDegradation order in sedimentDegradation rate for dissolved phase in sedimentDegradation rate for solids sorbed phase in sedimentVolatilizationVolatilization velocityHenry’s constantUnitsm d-1m yr-1g mol-1cm2 s-1cm s-1m0.00184.9·10-7KGKLMass transfer velocity from the gaseous filmMass transfer velocity from the liquid film3183195.3m d-1atm m3 (gmol oK)-1m d-1m 5Value
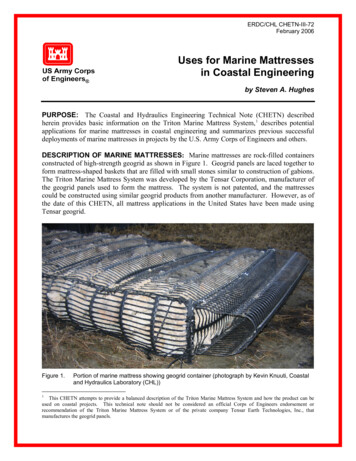
ERDC/TN EQT-16-2August 2016Figure 2.Comparison of CSM computed and measured concentrations of DDE in the watercolumn.Figure 3. Comparison of CSM computed and measured concentrations of DDE in the upper sedimentlayer.Figues 4 and 5 show the comparison of CSM computed and observed lindane concentrations in thewater column and sediment layer. Concentrations of lindane decrease more quickly than DDE due toadditional degradation. Lindane decreases from initial 0.025 µg L-1 in the water column and 1.8 µg L1in the upper sediment layer to almost zero after five years. Besides the volatilization, its degredationis the major mechanism for the decrease from the water column. This field verification and6
ERDC/TN EQT-16-2August 2016comparison against the field observed data shows the ability of the CSM to simulate behavior of twoinsecticides in an aquatic system with a limited amount of data. CSM computed results are similar tothose predicted by the RECOVERY model, thus, appear to demonstrate the validity of the algorithmsused to describe the kinetics and fate of insecticides in the water column and underlying sediments.Figure 4. Comparison of CSM computed and measured concentrations of lindane in the watercolumn.Figure 5. Comparison of CSM computed and measured concentrations of lindane in the uppersediment layer.7
ERDC/TN EQT-16-2August 2016Comparison of CSM and WASP Model Simulations. In this test case, an equivalent watercolumn and benthic sediment segment was set up for CSM and WASP simulations. Each model ranfor a period of 1000 days. The concentrations and pathway fluxes of contaminants computed by theCSM were compared against their values generated from the WASP simulation. Three contaminantsnamed as Chem 1, Chem 2, and Chem 3 were simulated for each model. The diffusion velocitybetween the water column and underlying sediment-water was set to zero because this process,included in WASP, did not behave appropriately. Different kinetic processes for each contaminantwere simulated to validate CSM performance against corresponding WASP simulation for eachcontaminant during this test case. Three species of contaminants and two solids classes weresimulated in both models.The first two contaminants (Chem 1 and Chem 2) represent two insecticides thiometon and disulfoton.Wanner et al. (1989) performed a detailed modeling study for the transport and fate of these twocompounds at the Rhine River in Schweizerhalle, Switzerland. A dynamic mathematical model wasdeveloped to predict the propagation and attenuation of the pulse of the two chemicals in the RhineRiver. The internal processes modeled in their study include sorption and settling, diffusion intosediments, water/air exchange, as well as chemical, photochemical, and biological transformations. Intheir study, abiotic hydrolysis and biological transformation of thiometon and disulfoton have beenmeasured in laboratory experiments. Their laboratory data, together with estimates based on availabledata, were used in CSM and WASP simulations. The detailed data used for these two compounds isavailable in Wanner et al. (1989). Because some kinetic processes were not simulated for these twocompounds, a third contaminant, which is an arbitrary chemical used to test and validate contaminantskinetics not simulated for thiometon and disulfoton, was included in this case study.Multi-phase partition to DOC, POM, and two solid classeses were allowed for the third contaminant.The three contaminants were also subject to several reactions and transformations, includingdegradation, hydrolysis, phololysis, generalized second-order reaction, transformations in the watercolumn and sediment layer, and volatilization of contaminants in the water column. Thesesimulations assumed that solid 1 and solid 2 settle out at a velocity of 1.0 and 5.0 m/day. Solid 1 andsolid 2 in the surficial sediment compartments were assumed to resuspend at a velocity of 0.01 and0.05 m/day, respectively. Sediment burial rate was setup as 0.0002 m/day. The exchanging solidscarry sorbed contaminants between the water column and surficial sediment. Table 4 presents thevalues of the contaminant parameters used in these two models.Biochemical processes simulated for Chem 1 included contaminant partitioning (five phases),degradation, photolysis, volatilization, and transformations due to the degradation. In this test case,equilibrium partitioning coefficients for DOC, POM, and solids were selected as user specifiedparameters in both models. Volatilization velocity of Chem 1 was internally computed in bothmodels. Comparisons of CSM and WASP model computed concentrations of Chem 1 in the watercolumn and sediment layer are shown in Figures 6 and 7. Total and dissolved concentrations arepresented for the water column. Total concentration and sorbed mass on sediment solids arepresented for the sediment layer. The CSM and WASP produced identical results as expectedbecause the same biochemical reactions and transformation mechanisms and rates were applied bothmodels. Examination of Figure 6 reveals that the dissolved concentration contains a significantportion of the total concentration in the water column.8
ERDC/TN EQT-16-2August 2016Table 4. Summary of contaminant parameters used in CSM and WASP simulations.ValueVariableDefinitionMWMolecular weighth2Sediment layer thicknessvmSediment-water masstransfer velocityKowOctanol-water partitioningcoefficientαdocPartition correlationcoefficientαpomPartition correlationcoefficientαpPartition correlationcoefficientKdocEquilibrium partitioncoefficient for DOCKdoc2Equilibrium partitioncoefficient for DOCKpomEquilibrium partitioncoefficient for POMKpom2Equilibrium partitioncoefficient for POMKp 1Equilibrium partitioncoefficient for solid 1Kp2 1Equilibrium partitioncoefficient for solid 1Kp 2Equilibrium partitioncoefficient for solid 2Kp2 2Equilibrium partitioncoefficient for solid 2nDegradation orderk1dDegradation rate fordissolved phase in waterk1d2Degradation rate for dissolvedphase in sedimentk1docDegradation rate for DOCsorbed phase in waterk1doc2Degradation rate for DOCsorbed phase in sedimentk1pomDegradation rate for POMsorbed phase in waterk1pom2Degradation rate for POMsorbed phase in sedimentk1pDegradation rate for solidssorbed phase in waterk1p2Degradation rate for solidssorbed sorbed phase insedimentY12Transformation yieldcoefficient from chemical 1to 2Temp.Coeff.Chem 1(Disulfoton)2000.150ValueTemp.Coeff.Chem 2(Thiometon)ValueTemp.Coeff.Chem 3Units0.15-0.15-g mol-1m0-0-m 50-65000-L kg-11500250-65000-L kg-11200240---L kg-11200240---L kg-1500120---L kg-1500120---L kg-130060---L kg-130060---L -0.29
ERDC/TN EQT-16-2August rhydkedkedockepomkepked2Transformation yieldcoefficient from chemical 10.3to 2Aquatic photolysis rate for0.00752dissolved phaseAquatic photolysis rate for0.00376DOC sorbed phaseLight intensity when kpht is200measuredVolatilization velocity21.025Henry’s constant2.5·10-3 5.0·10-4Alkaline hydrolysis rate ofdissolved phase in waterAlkaline hydrolysis rate ofdissolved phase in sedimentAlkaline hydrolysis rate ofDOC sorbed phase in waterAlkaline hydrolysis rate ofDOC sorbed phase insedimentActivation energy for alkalinehydrolysisNeutral hydrolysis rate ofdissolved phase in waterNeutral hydrolysis rate ofdissolved phase in sedimentNeutral hydrolysis rate ofDOC sorbed phase in waterNeutral hydrolysis rate of DOCsorbed phase in sedimentActivation energy for neutralhydrolysisAcid hydrolysis rate ofdissolved phase in waterAcid hydrolysis rate ofdissolved phase in sedimentAcid hydrolysis rate of DOCsorbed phase in waterAcid hydrolysis rate of DOCsorbed phase in sedimentActivation energy for acidhydrolysisReference watertemperature for hydrolysisSecond-order rate fordissolved phase in waterSecond-order rate for DOCsorbed phase in waterSecond-order rate for POMsorbed phase in waterSecond-order rate for solidssorbed phase in waterSecond-order rate fordissolved phase in sediment10---------d-1----d-1----W m-2----m d-1atm L mol-12---m3 mol-1 d-12---m3 mol-1 d-11---m3 mol-1 d-11---m3 mol-1 d-165---KJ 6---d-176---KJ mol-110---m3 mol-1 d-110---m3 mol-1 d-15---m3 mol-1 d-15---m3 mol-1 d-165---KJ .001-(mg L-1)-1d-1(mg L-1)-1d-1(mg L-1)-1d-1(mg L-1)-1d-1(mg L-1)-1d-1
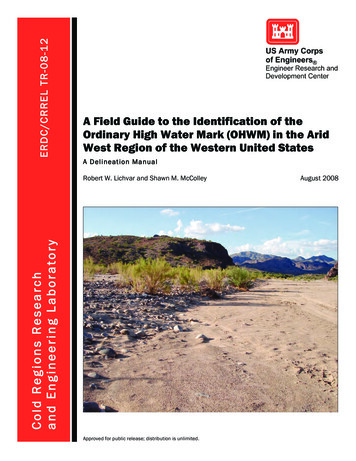
ERDC/TN EQT-16-2August 2016kedoc2kepom2kep2EaeTraeSecond-order rate for DOCsorbed phase in sedimentSecond-order rate for POMsorbed phase in sedimentSecond-order rate for solidssorbed phase in sedimentActivation energy forgeneralized second-orderreactionReference water temperaturefor generalized second-orderreaction(mg L-1)-1d-1(mg L-1)-1d-1(mg 8-KJ mol-1----24-oC(a)(b)Figure 6. CSM and WASP computed concentrations of Chem 1 in the water column: (a) total (CT)and (b) dissolved (Cd).(c)(d)Figure 7. CSM and WASP computed concentrations of Chem 1 in the sediment layer: (a) total (CT)and (b) solids sorbed (Cpt).Biochemical processes simulated for Chem 2 include contaminant partitioning (five phases),hydrolysis, and transformation due to hydrolysis. Comparisons of CSM and WASP model computedconcentrations of Chem 2 in the water column and sediment layer are shown in Figures 8 and 9. Thetotal and dissolved concentrations of Chem 2 are presented for the water column. The CSM and WASPproduced identical results, as expected, because the same biochemical reactions and transformationmechanisms and rates were applied in these two models. Among three contaminants, Chem 2 wasrepresented with the lowest Kd value. Examination of Figure 8 reveals that the total concentration ofChem 2 is about the same magnitude as the dissolved concentration, or most of the water concentrationof Chem 2 is in dissolved form because lower partitioning coefficients were specified.11
ERDC/TN EQT-16-2August 2016(a)Figure 8.(b)CSM and WASP computed concentrations of Chem 2 in the water column: (a) total (CT) and(b) dissolved (Cd).(a)Figure 9.(b)CSM and WASP computed concentrations of Chem 2 in the sediment layer: (a) total (CT) and(b) solids sorbed (Cpt).Biochemical processes simulated for Chem 3 include contaminant partitioning (five phases),generalized second-order reaction, and transformation due to the second-order reaction. In this testcase, equilibrium partitioning coefficients for DOC, POM, and solids were computed from Kowinputs instead of user specified. Comparisons of CSM and WASP computed concentrations of Chem3 in the water column and sediment layer are shown in Figures 8 and 9. Total and dissolvedconcentrations are presented for the water column. The CSM and WASP produced identical results,as expected, because the same second-order reaction and transformation mechanisms and rates wereapplied both models. Among the three contaminants, Chem 3 was represented with the highest Kdvalue. Examination of Figures 9 and 10 reveals that the total concentration of Chem 3 is aboutseveral order of magnitude greater than the dissolved concentration, or most of the waterconcentration of Chem 3 is in particulate form (i.e., attached to solids). Chemicals with high Kd tendto be absorbed by the solids much more readily than those with low Kd.Besides observing sediment-water fluxes computed from CSM and WASP are different, we noticedsome contaminant processes included in CSM and WASP also perform differently. These differencesinclude: (1) photolysis, (2) equilibrium partitioning coefficients computed from Kow, and (3) ionization.For the above test cases, degradation, volatilization, and all transforms were turned off for Chem 1.Only partitioning and photolysis processes were simulated in CSM and WASP. The normalized lightintensity in WASP was set to equal the light intensity / reference light intensity in CSM. The modelresults reveal that the two models generated identical results as shown in Figure 8 if the photolysis ratefor dissolved phase is specified to a no-zero value, and the photolysis rate for DOC-complex is set tozero. However, if the photolysis rate for DOC-complex is set to a no-zero value and zero for thedissolved phase, the contaminant concentrations predicted from the two models are slightly differentbecause the computed photolysis rates were different, as shown in Figure 12.12
ERDC/TN EQT-16-2August 2016(a)(b)(c)(d)Figure 10. CSM and WASP computed concentrations of Chem 3 in the water column: (a) total (CT), (b)dissolved (Cd), (c) DOC sorbed (Cdoc), and (d) solids sorbed (Cpt).(a)(b)(c)(d)Figure 11. CSM and WASP computed concentrations of Chem 3 in the sediment layer: (a) total (CT), (b)dissolved (Cd), (c) DOC sorbed (Cdoc), and (d) solids sorbed (Cpt).13
ERDC/TN EQT-16-2August 2016Figure 12. CSM and WASP computed total concentrations of Chem 1 in thewater column.Two options are included in CSM and WASP for defining contaminant’s equilibrium partitioncoefficients (Kdoc, Kpom, Kpn): (1) user-defined and (2) model computed from the octanol-waterpartition coefficient (Kow) of the contaminant. As for the second option, different foc values for solidgroups were specified in CSM and WASP, but user-specified foc values did not affect computed Kd inWASP; Therefore computed Kd values from CSM and WASP were different, which affected themodel predictions.Lastly, the ionization process in CSM and WASP behave differently. For the above test cases,ionization was turned on for Chem 3. Dissolved concentrations of Chem 3 in the water column andsediment layer are shown in Figures 13 and 14. These figures show that the dissolved concentrationscomputed from CSM and WASP are slightly different. Although dissolved concentrations for CSMand WASP are different, DOC and solids sorbed concentrations are approximately the same. InCSM, the contaminant is first distributed into five ionic species. Then, each species is partitionedaccording to its partition coefficients, which does not affect the concentration of ionic species.However, the concentration of ionic species varies with partition coefficients in WASP, resulting indifferent results shown in Figures 13 and 14.Overall, CSM computed concentrations and pathway fluxes of the three contaminants were identicalor slightly different compared with the corresponding results generated from the WASP model.These slight differences were largely due to some processes being implemented differently in WASP.However, the algorithm and computer code computation were implemented in CSM withconfidence.14
ERDC/TN EQT-16-2August 2016Figure 13.CSM and WASP computed dissolved concentrations of Chem 3 in the watercolumn.Figure 14.CSM and WASP computed dissolved concentrations of Chem 3 in thesediment layer.ADDITIONAL VERIFICATION AND EVALUATION: A set of Microsoft Excel spreadsheets weredeveloped to verify multiple phase partitioning, pathways, and concentrations of each phasecomputed in CSM. One testing case was to turn on all kinetic processes included in CSM for anarbitrary contaminant (e.g. ionization, multi-phase partitioning, degradation, photolysis, hydrolysis,volatilization, generalized second-order reaction, and transformations). Contaminant partition toDOC, algae, POM, and three solids classes were modeled for this contaminant. The dissolvedspecies was allowed to exchange between the water column and underlying sediments through avertical diffusion process. CSM computed concentration and pathway fluxes were identical with theresults generated from source and sink term equations basedExcel spreadsheet. Comparisons of thetotal concentrations in the water column and sediment layer are presented in Figures 15 and 16respectively.15
ERDC/TN EQT-16-2August 2016Figure 15.CSM and Excel com
ERDC/TN EQT-16-2 August 2016. 3. Table 1. Computed concentrations of each contaminant in CSM. Name Definition Units Water column C T Total concentration in water -µg L 1 Cion Ionic concentration in water µg L-1 Cd Concentration of dissolved phase in water µg L-1 Cdoc Concentration of DOC sorbed phase in water µg L-1 Cap Concentration -of algae sorbed phase in water µg L 1