Transcription
Introduction to Hierarchical Linear Models/MultilevelAnalysisEdps/Psych/Soc 589Carolyn J. AndersonDepartment of Educational Psychologyc Board of Trustees, University of IllinoisJanuary 13, 2021
IntroductionData and ExamplesApplicationsMultilevel Theories & PropositionsSummaryOverviewHierarchical Linear ModelsMultilevel Analysis using Linear Mixed ModelsVariance Components AnalysisRandom coefficients ModelsGrowth curve analysisAll are special cases of Generalized Linear Mixed Models (GLMMs)Reading:Snijders & Bosker (2012) — chapters 1 & 2C.J. Anderson (Illinois)Hierarchical Linear Models/Multilevel AnalysisJanuary 13, 20212.2/ 54
IntroductionData and ExamplesApplicationsMultilevel Theories & PropositionsSummaryDefinition of Multilevel AnalysisSnijders & Bosker (2012):Multilevel analysis is a methodology for the analysis of data withcomplex patterns of variability, with a focus on nested sources ofvariability.Wikipedia (Aug, 2014):Multilevel models (also hierarchical linear models, nested models,mixed models, random coefficient, random-effects models, randomparameter models, or split-plot designs) are statistical models of parameters that vary at more than one level. These models can be seenas generalizations of linear models (in particular, linear regression),although they can also extend to non-linear models. These modelsbecame much more popular after sufficient computing power andsoftware became available.[1]Today:Data and examplesRange of applicationsMultilevel TheoriesC.J. Anderson (Illinois)Hierarchical Linear Models/Multilevel AnalysisJanuary 13, 20213.3/ 54
IntroductionData and ExamplesApplicationsMultilevel Theories & PropositionsSummaryData and ExamplesChildren within families:Children with same biological parents tend to be more alike thanchildren chosen at random from the general population.They are more a like becauseGeneticsEnvironmentBothC.J. Anderson (Illinois)Hierarchical Linear Models/Multilevel AnalysisJanuary 13, 20214.4/ 54
IntroductionData and ExamplesApplicationsMultilevel Theories & PropositionsSummaryDataMeasurements on individuals (e.g., blood pressure: systolic & diastolic).Sources of VariabilityIMeasured at the same time Measurement error, between individualsII Members of same familyMeasurement error, between members, between familiesIII Under different conditions Measurement error, serial, betweenor over timeindividualsIV Measures of members of a Measurement error, between indifamily over time (or differ- viduals, between families, serialent conditionsC.J. Anderson (Illinois)Hierarchical Linear Models/Multilevel AnalysisJanuary 13, 20215.5/ 54
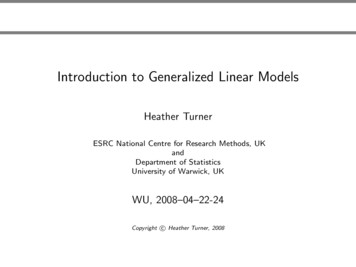
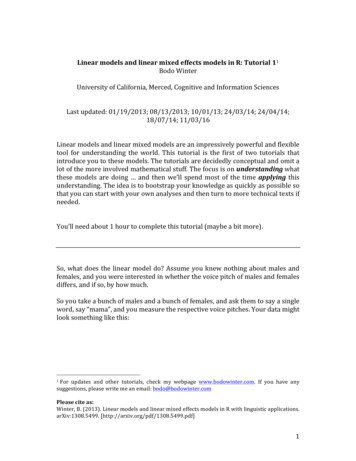
IntroductionData and ExamplesApplicationsMultilevel Theories & PropositionsSummaryExamples of Hierarchies(a) Individuals within groupsGroup 1Group 2Level 2Level 1 . . . .Group N . . . . . .person22person2n2 onN nN21N(b) LongitudinalLevel 2Level 1Person 1 time11 time12 time1t1 trial12 trialn1trial1 trial2trialn2 . . . timeN 1 timeN 2 timeN tN. . . . Person N . . . Person 2 . . . C.J. Anderson (Illinois) time21 time22 time2t2(c) Repeated MeasuresPerson 1Level 2Level 1 trial11.Person 2 . . . Person N . . . trialN 1 trialN 2 trialN nNHierarchical Linear Models/Multilevel AnalysisJanuary 13, 20216.6/ 54
IntroductionData and ExamplesApplicationsMultilevel Theories & PropositionsSummaryMore Examples of Hierarchiespeer octorschildrenstudentspatientsC.J. Anderson (Illinois)Hierarchical Linear Models/Multilevel AnalysisJanuary 13, 20217.7/ 54
IntroductionData and ExamplesApplicationsMultilevel Theories & PropositionsSummaryA Little TerminologyHierarchySchoolsLevelslevel 3Labels/terminologypopulation, macro, primary units(first level sampled)Classeslevel 2sub-population, secondary units,groupsStudentslevel 1individuals, micro(last level sampled)C.J. Anderson (Illinois)Hierarchical Linear Models/Multilevel AnalysisJanuary 13, 20218.8/ 54
IntroductionData and ExamplesApplicationsMultilevel Theories & PropositionsSummarySampling DesignsStructure of data obtained by the way data are collected.Observational Studies.Experiments.C.J. Anderson (Illinois)Hierarchical Linear Models/Multilevel AnalysisJanuary 13, 20219.9/ 54
IntroductionData and ExamplesApplicationsMultilevel Theories & PropositionsSummaryObservational StudiesMulti-stage sampling is cost effective.1Take random sample from populatione.g.(schools).2Take random sample from sub-population (classes).3Take random sample from sub-population (students).C.J. Anderson (Illinois)Hierarchical Linear Models/Multilevel AnalysisJanuary 13, 202110.10/ 54
IntroductionData and ExamplesApplicationsMultilevel Theories & PropositionsSummaryExperimentsHierarchies are created in the experiment.Random assignment of individuals to treatments and create within groupdependencies (compleletely randomized design).e.g., randomly assign patients to different clinics and due to groupingcreate within groups dependencies.e.g., randomly assign students to classes and due to groupingdependencies of individuals in the same group created.C.J. Anderson (Illinois)Hierarchical Linear Models/Multilevel AnalysisJanuary 13, 202111.11/ 54
IntroductionData and ExamplesApplicationsMultilevel Theories & PropositionsSummaryExperiments (continue)Grouping may initially be random but over the course of the experimentindividuals become differentiated.Groups members.Members groups.C.J. Anderson (Illinois)Hierarchical Linear Models/Multilevel AnalysisJanuary 13, 202112.12/ 54
IntroductionData and ExamplesApplicationsMultilevel Theories & PropositionsSummaryAnalysis Must Incorporated StructureNeed to take structure of data into account becauseInvalidates most traditional statistical analysis methods (i.e.,independent observations).Risk overlooking important group effects.Within group dependencies is interesting phenomenon.People exist within social contexts and want to study and makeinferences about individuals, groups, and the interplay betweenthem.C.J. Anderson (Illinois)Hierarchical Linear Models/Multilevel AnalysisJanuary 13, 202113.13/ 54
IntroductionData and ExamplesApplicationsMultilevel Theories & PropositionsSummaryClassic ExampleBennett (1976): Statistically significant difference between ways ofteaching reading (i.e., “formal” styles are better than others).Data analyzed using traditional multiple regression where studentswere the units of analysis.Atikin et al (’81): When the grouping of children into classes wasaccounted for, significant differences disappeared.C.J. Anderson (Illinois)Hierarchical Linear Models/Multilevel AnalysisJanuary 13, 202114.14/ 54
IntroductionData and ExamplesApplicationsMultilevel Theories & PropositionsSummaryReferencesAitkin, M, Anderson, D, & Hinde, J. (1981). Statistical modelling ofdata on teaching styles. Journal of the Royal Statistical Society, A,144, 419-461.Aitkin, M., & Longford, N. (1986). Statistical modeling issues inschool effectiveness studies. Journal of the Royal Statistical Society,A, 149, 1-43. (with discussion).Goldstein, H. (1995). Multilevel statistical models, 2nd Edition.London: Arnold.C.J. Anderson (Illinois)Hierarchical Linear Models/Multilevel AnalysisJanuary 13, 202115.15/ 54
IntroductionData and ExamplesApplicationsMultilevel Theories & PropositionsSummaryWhat happened?Children w/in a classroom tended to be more similar with respect totheir performance.Each child provides less information than would have been the case ifthey were taught separately.Teacher should have been the unit of comparison.Students provide information regarding the effectiveness of teacher.C.J. Anderson (Illinois)Hierarchical Linear Models/Multilevel AnalysisJanuary 13, 202116.16/ 54
IntroductionData and ExamplesApplicationsMultilevel Theories & PropositionsSummaryWhat Happened? (continued)Students provide information regarding the effectiveness of teacher.Increase the number of students per teacher,Increase the precision of measurement of teacher.Increase the number of teachers (with same or even fewerstudents),Increase the precision of comparisons between teachers.C.J. Anderson (Illinois)Hierarchical Linear Models/Multilevel AnalysisJanuary 13, 202117.17/ 54
IntroductionData and ExamplesApplicationsMultilevel Theories & PropositionsSummaryUnit of Analysis ProblemProblems with ignoring hierarchical structure of data were wellunderstood, but until recently, they were difficult to solve.Solution: Hierarchial linear models, along with computer software.Hierarchical linear models areGeneralizations of traditional linear regression models.Special cases of them include random and mixed effects ANOVA andANCOVA models.C.J. Anderson (Illinois)Hierarchical Linear Models/Multilevel AnalysisJanuary 13, 202118.18/ 54
IntroductionData and ExamplesApplicationsMultilevel Theories & PropositionsSummaryA Little Example: NELS88 dataNational Education Longitudinal Study — conducted by National Centerfor Education Statistics of the US department of Education.Data constitute the first in a series of longitudinal measurements ofstudents starting in 8th grade. Data were collected Spring 1988.I obtained the data used here fromwww.stat.ucla.edu/ deleeuw/sagebookFrom these data, we’ll use 2 out of the 1003 schools.C.J. Anderson (Illinois)Hierarchical Linear Models/Multilevel AnalysisJanuary 13, 202119.19/ 54
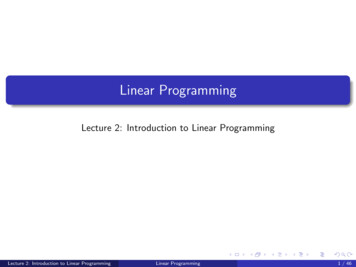
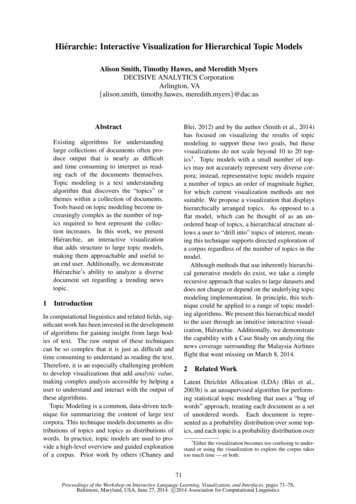
IntroductionData and ExamplesApplicationsMultilevel Theories & PropositionsSummaryNELS88: Data from two schools50203040Math Scores607080NELS Data (sub set)01234567Time Spent Doing HomeworkC.J. Anderson (Illinois)Hierarchical Linear Models/Multilevel AnalysisJanuary 13, 202120.20/ 54
IntroductionData and ExamplesApplicationsMultilevel Theories & PropositionsSummaryNELS88: Data from two schools with a Little Jittering50203040Math Scores607080NELS Data (sub set) with some Horizondent Jittering01234567Time Spent Doing HomeworkC.J. Anderson (Illinois)Hierarchical Linear Models/Multilevel AnalysisJanuary 13, 202121.21/ 54
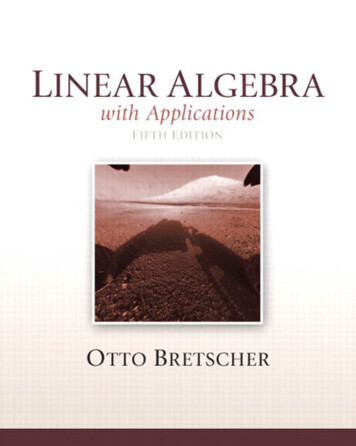
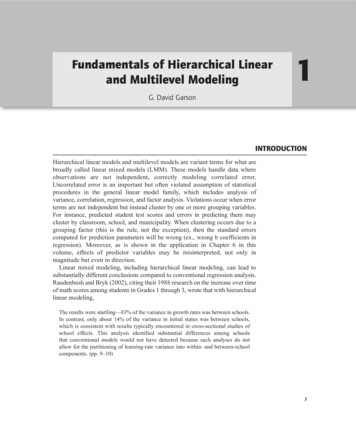
IntroductionData and ExamplesApplicationsMultilevel Theories & PropositionsSummarySchools 24725 and 62821 identified80NELS: Linear Regression by School50203040Math Scores6070School 62821School 2472501234567Time Spent Doing HomeworkC.J. Anderson (Illinois)Hierarchical Linear Models/Multilevel AnalysisJanuary 13, 202122.22/ 54
IntroductionData and ExamplesApplicationsMultilevel Theories & PropositionsSummaryApplications of Multilevel ModelsAn incomplete list of possibilities:Sample surveySchool/teacher effectivenessLongitudinalDiscrete responsesRandom cross-classificationsMeta AnalysisC.J. Anderson (Illinois)Measurement errorMultivariateStructural EquationEvent historyNonlinear patternsIRT ModelsHierarchical Linear Models/Multilevel AnalysisJanuary 13, 202123.23/ 54
IntroductionData and ExamplesApplicationsMultilevel Theories & PropositionsSummarySurvey SamplesMulti-stage sampling often used to collect data.geographical area(clustering of polticial attitudes)neighborhoods(clustering of SES)households“Nuisance factor”The population structure is not interesting. So, multilevel sampling is away to collect and analyze data about higher level units.C.J. Anderson (Illinois)Hierarchical Linear Models/Multilevel AnalysisJanuary 13, 202124.24/ 54
IntroductionData and ExamplesApplicationsMultilevel Theories & PropositionsSummarySchool (teacher) EffectivenessStudents nested within schools.1995 special issue Journal of Educational and Behavioral Statistic, 20(summer) on Hierarchical Linear Models: Problems and Prospects.Educational researchers interested in comparing schools w/rt studentperformance (measured by standardized achievement tests).Public accountability.What factors explain differences between schools.C.J. Anderson (Illinois)Hierarchical Linear Models/Multilevel AnalysisJanuary 13, 202125.25/ 54
IntroductionData and ExamplesApplicationsMultilevel Theories & PropositionsSummaryExamplesQuestion: Does keeping gifted students in class or separate classes lead tobetter performance?Measures available: Performance at beginning of year, performance at endof year, and aptitude.Question: To what extent do differences in average exam results betweenschools accounted for by factors such asOrganizational practicesCharacteristics of studentsC.J. Anderson (Illinois)Hierarchical Linear Models/Multilevel AnalysisJanuary 13, 202126.26/ 54
IntroductionData and ExamplesApplicationsMultilevel Theories & PropositionsSummaryAdvantages of multilevel approachStatistically efficient estimates of regression coefficients.Correct standard errors, confidence intervals, and significance tests.Can use covariates measured at any of the levels of the hierarchy.C.J. Anderson (Illinois)Hierarchical Linear Models/Multilevel AnalysisJanuary 13, 202127.27/ 54
IntroductionData and ExamplesApplicationsMultilevel Theories & PropositionsSummaryExample with DataRank schools w/rt to quality (adjusting for factors such as student“intake”)Data: http://multilevel.ioe.ac.uk/“The data come from the Junior School Project (Mortimore et al, 1988).There are over 1000 students measured over three school years with 3236records included in this data set. Ravens test in year 1 is an abilitymeasure.”C.J. Anderson (Illinois)Hierarchical Linear Models/Multilevel AnalysisJanuary 13, 202128.28/ 54
IntroductionData and ExamplesApplicationsMultilevel Theories & PropositionsSummaryJSP Data:Columns1-214-1516DescriptionSchoolMathematics testJunior school yearCodingCodes from 1 to 50Score 1-40One 0; Two 1;Three 2Goldstein,H. (1987). Multilevel Models in Educational and SocialResearch. London, Griffin; New York, Oxford University Press.1Mortimore,P.,Sammons,P.,Stoll,L.,Lewis,D. & Ecob,R. (1988).School Matters, the Junior Years. Wells, Open Books.Prosser,R., Rasbash,J., and Goldstein,H.(1991). ML3 Software forThree-level Analysis, Users’ Guide for V.2, Institute of Education,University of London.1Thedata usedby GoldsteinconsistofModels/Multilevelmeasures onAnalysis728 studentsin 5013,elementaryC.J. 29/ 54
IntroductionData and ExamplesApplicationsMultilevel Theories & PropositionsSummaryJSP: Level 1 Within School #1 Variation(R2 .70)50JSP Data,3020010Math Scores Year 140math1 3.4251 0.8803*math00C.J. Anderson (Illinois)10203040Hierarchical LinearModels/MultilevelAnalysisMathScores Year 050January 13, 202130.30/ 54
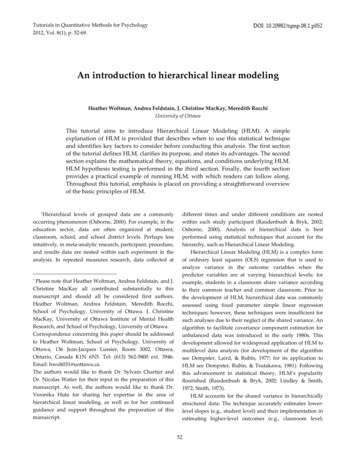
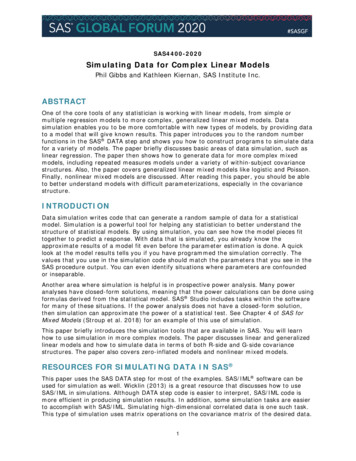
IntroductionData and ExamplesApplicationsMultilevel Theories & PropositionsSummaryJSP: Level 2 Between School VariationMost R2 ’s between .6 and .9.2010Math Scores in Year 13040JSP: Linear Regression by School510152025303540Math Scores in Year 0Different slopes and intercepts.C.J. Anderson (Illinois)Hierarchical Linear Models/Multilevel AnalysisJanuary 13, 202131.31/ 54
IntroductionData and ExamplesApplicationsMultilevel Theories & PropositionsSummarySchool/Teacher EffectivenessMay be OK to fit separate regressions, ifOnly a few schools each with a large numberof studentsOnly want to make inferences about these specific schools.However, if view schools as random sample from a large population ofschools, then need multilevel approach.C.J. Anderson (Illinois)Hierarchical Linear Models/Multilevel AnalysisJanuary 13, 202132.32/ 54
IntroductionData and ExamplesApplicationsMultilevel Theories & PropositionsSummaryLongitudinal DataSame individuals measured on multiple occasions.IndividualOccasionsStrong hierarchies.Much more variations between individuals than between occasionswithin individuals.C.J. Anderson (Illinois)Hierarchical Linear Models/Multilevel AnalysisJanuary 13, 202133.33/ 54
IntroductionData and ExamplesApplicationsMultilevel Theories & PropositionsSummaryA Little (hypothetical) ExampleResponse variable: reading abilityExplanatory variable: AgeTwo measurement occasionsC.J. Anderson (Illinois)Hierarchical Linear Models/Multilevel AnalysisJanuary 13, 202134.34/ 54
IntroductionData and ExamplesApplicationsMultilevel Theories & PropositionsSummaryHypothetical ExampleAny explanations?C.J. Anderson (Illinois)Hierarchical Linear Models/Multilevel AnalysisJanuary 13, 202135.35/ 54
IntroductionData and ExamplesApplicationsMultilevel Theories & PropositionsSummaryLongitudinal (continued)Traditional procedures:Balanced designs (no missing data)All measurement occasions the same for all individuals.Multilevel modeling allows:Different occasions for different individuals.Different number of observations per individual.Build in particular error structures within individuals (eg,auto-correlated errors).Others.laterC.J. Anderson (Illinois)Hierarchical Linear Models/Multilevel AnalysisJanuary 13, 202136.36/ 54
IntroductionData and ExamplesApplicationsMultilevel Theories & PropositionsSummaryDiscrete Response DataThe response dependent variables are discrete rather than continuous.School’s exam pass rate (proportions).Graduation rate as a function of ethnic class.Rate of arrest from 911 calls.Generalized linear mixed models (SAS procedures NLMIXED, GLMMIX,MDC, MCMC).Some common IRT models are generalized non-linear mixed models (e.g.,Rasch, 2PL, others).C.J. Anderson (Illinois)Hierarchical Linear Models/Multilevel AnalysisJanuary 13, 202137.37/ 54
IntroductionData and ExamplesApplicationsMultilevel Theories & PropositionsSummaryMultivariate DataThis is a variation of the use of hierarchical linear models for analyzinglongitudinal data.x1ւx2individualւ.ցxpHere we can have different variables and not every individual needs to havebeen measured on all of the variables.C.J. Anderson (Illinois)Hierarchical Linear Models/Multilevel AnalysisJanuary 13, 202138.38/ 54
IntroductionData and ExamplesApplicationsMultilevel Theories & PropositionsSummaryNonlinear ModelsNonlinear models that are not linear in the parameters (e.g.,multiplicative).Some kinds of growth models.e.g., Growth spurts in children and when reach adulthood, growth levelsoff.Some nonlinear patterns can be modeled by polynomials or splines, butnot all (e.g., logistic, discontinuous).C.J. Anderson (Illinois)Hierarchical Linear Models/Multilevel AnalysisJanuary 13, 202139.39/ 54
IntroductionData and ExamplesApplicationsMultilevel Theories & PropositionsSummaryRandom ntary schoolցXhigh schoolւindividualRaudenbush, S.W. (1993). A crossed random effects model for unbalanceddata with applications in cross-sectional and longitudinal research. Journalof Educational Statistics, 18, 321–350.C.J. Anderson (Illinois)Hierarchical Linear Models/Multilevel AnalysisJanuary 13, 202140.40/ 54
IntroductionData and ExamplesApplicationsMultilevel Theories & PropositionsSummaryStructural Equation ModelingIncluding Factor analysisgroupitem1individualւց.item20If apply factor analysis to responses from group data, the resulting factorscould representGroup differencesIndividual differencesC.J. Anderson (Illinois)Hierarchical Linear Models/Multilevel AnalysisJanuary 13, 202141.41/ 54
IntroductionData and ExamplesApplicationsMultilevel Theories & PropositionsSummaryMeasurement Error. . . in the explanatory variables at different levels.e.g. Let Yij be measure on individual i within group/cluster j and x ij bean explanatory variable measured with error.Yij βo β1 x ij ǫij βo β1 (xi uj ) ǫij (βo β1 uj ) β1 xi ǫij βoj β1 xi ǫijSee also Muthën & Asparouhov (2011) who take a latent variableapproach.C.J. Anderson (Illinois)Hierarchical Linear Models/Multilevel AnalysisJanuary 13, 202142.42/ 54
IntroductionData and ExamplesApplicationsMultilevel Theories & PropositionsSummaryOther ApplicationsImage analysis (e.g., analysis of shapes, DNA patterns, computerscans).How is repeated measures different from longitudinal?How could you do a meta-analysis as a multilevel (HLM) analysis?For some examples of these, seehttp://www.dartmouth.edu/ eugened (Demidenko, Eugene MixedModels: Theory and Applications. NY: Wiley).C.J. Anderson (Illinois)Hierarchical Linear Models/Multilevel AnalysisJanuary 13, 202143.43/ 54
IntroductionData and ExamplesApplicationsMultilevel Theories & PropositionsSummaryMultilevel Theories and PropositionsFrom Snijders & BoskerHandy device:Macro-levelMicro-levelC.J. Anderson (Illinois)Zmarco in capital letters. . . ց. . . . . .x ymicro in lower caseHierarchical Linear Models/Multilevel AnalysisJanuary 13, 202144.44/ 54
IntroductionData and ExamplesApplicationsMultilevel Theories & PropositionsSummaryMicro-level propositionsNo variables as the macro-level.Dependency is a nuisance. .x ye.g., At macro-level you’ve randomly sampled towns and within townshouseholds.x occupational status,y incomeC.J. Anderson (Illinois)Hierarchical Linear Models/Multilevel AnalysisJanuary 13, 202145.45/ 54
IntroductionData and ExamplesApplicationsMultilevel Theories & PropositionsSummaryMacro-level propositionsZ Y. .Z and Y are not directly observable, but are composites (averages,aggregates) of micro-level measurements, then we end up with multilevelstructure.e.g., Z wealth of area (average SES).Y school performance (mean achievement test).lower mean SES lower mean achievement test scores. or Z student/teacher ratio.C.J. Anderson (Illinois)Hierarchical Linear Models/Multilevel AnalysisJanuary 13, 202146.46/ 54
IntroductionData and ExamplesApplicationsMultilevel Theories & PropositionsSummaryMacro-Micro relationsThree basic possibilities:1. Macro to micro.2. Macro and micro to micro.3. Macro–micro interaction.C.J. Anderson (Illinois)Hierarchical Linear Models/Multilevel AnalysisJanuary 13, 202147.47/ 54
IntroductionData and ExamplesApplicationsMultilevel Theories & PropositionsSummary1. Macro to Micro.Z. . . ց. . . . . .yy math achievementZ mean SES of studentsTheory/proposition:Higher average SES higher math achievementC.J. Anderson (Illinois)Hierarchical Linear Models/Multilevel AnalysisJanuary 13, 202148.48/ 54
IntroductionData and ExamplesApplicationsMultilevel Theories & PropositionsSummary2. Macro and Micro to MicroZ. . . ց. . . . . .x yx # of hours spent doing homework.Theory/proposition:Given time spent doing homework, higher average SES highermath achievement.Given average SES, more time spent doing homework higher mathachievement.C.J. Anderson (Illinois)Hierarchical Linear Models/Multilevel AnalysisJanuary 13, 202149.49/ 54
IntroductionData and ExamplesApplicationsMultilevel Theories & PropositionsSummary3. Macro-Micro InteractionIn the two macro-micro relations above, there is essentially a change inmean (random intercept). Here the relationship between x and y dependson Z.Z. . . . . . . . .x yZ no/ability grouping of children,x aptitude or IQ, and y achievement.Theory: Small effect of x when there is grouping but large effect whenthere is no grouping.C.J. Anderson (Illinois)Hierarchical Linear Models/Multilevel AnalysisJanuary 13, 202150.50/ 54
IntroductionData and ExamplesApplicationsMultilevel Theories & PropositionsSummaryEmergent or micro-macro propositionsZ. . . ր. . . . . .xZ teacher’s experience of stress.x student achievement.C.J. Anderson (Illinois)Hierarchical Linear Models/Multilevel AnalysisJanuary 13, 202151.51/ 54
IntroductionData and ExamplesApplicationsMultilevel Theories & PropositionsSummaryAnother Example of EmergentWZ. . . ց. . . . . . ր. . . . . .x yW teacher’s attitude toward learning.x student’s attitude toward learning.y student achievement.Z teacher’s prestige.C.J. Anderson (Illinois)Hierarchical Linear Models/Multilevel AnalysisJanuary 13, 202152.52/ 54
IntroductionData and ExamplesApplicationsMultilevel Theories & rarchically structured data are assumed to be1Random sample of macro-level units from population of macro-levelunits (or a representative sample).2Random sample of micro-level units from population of a (sampled)macro-level unit (or a representative sample).C.J. Anderson (Illinois)Hierarchical Linear Models/Multilevel AnalysisJanuary 13, 202153.53/ 54
IntroductionData and ExamplesApplicationsMultilevel Theories & PropositionsSummaryAdvantages of multilevel approachTakes care of dependencies in data and gives correct standard errors,confidence intervals, and significance tests.Statistically efficient estimates of regression coefficients.With clustered/multilevel/hierarchially structured data, can usecovariates measured at any of the levels of the hierarchy.Model all levels simultaneously.Study contextual effects.Theories can be rich.However,Need to modify tools used in normal linear regression.Models can become overwhelmingly complex.Estimation can be a problem.C.J. Anderson (Illinois)Hierarchical Linear Models/Multilevel AnalysisJanuary 13, 202154.54/ 54
mixed models, random coefficient, random-effects models, random parameter models, or split-plot designs) are statistical models of pa-rameters that vary at more than one level. These models can be seen as generalizations of linear models (in particular, linear regression), although they can also extend to non-linear models. These models