Transcription
Resolutions of Remote Sensing1. Spatial (what area and how detailed)2. Spectral (what colors – bands)3. Temporal (time of day/season/year)4. Radiometric (color depth)Spatial Resolution describes how muchdetail in a photographic image is visible tothe human eye.The ability to "resolve," or separate, smalldetails is one way of describing what wecall spatial resolution.1
Spatial resolution of images acquired by satellite sensorsystems is usually expressed in meters.For example, we often speak of Landsat as having “30meter" resolution, which means that two objects, thirtymeters long or wide, sitting side by side, can beseparated (resolved) on a Landsat image.Other sensors have lower or higher spatial resolutions.Comparison of Landsat SensorsThematic Mapper(TM) Landsat 4 and 516Enhanced ThematicMapper Plus (ETM )Landsat 71. 0.45-0.522. 0.53-0.613. 0.63-0.694. 0.78-0.905. 1.55-1.756. 2.09-2.357. 10.4-12.58. 0.52-0.90 (Pan)15 x 15 (Pan)30 x 3060 x 60 (TIR)16185 x 185183 x 170185 x 185705705915 (Landsat 1,2,3)SpectralResolution(µm)1. 0.45-0.52 (B)2. 0.52-0.60 (G)3. 0.63-0.69 (R)4. 0.76-0.90 (NIR)5. 1.55-1.75 (MIR)6. 2.08-2.35 (MIR)7. 10.4-12.5 visit in days)Spatialcoverage (km)Altitude (km)30 x 30120 x 120 (TIR)MultispectralScanner (MSS)Landsat 1-50.5-0.6 (green)0.6-0.7 (red)0.7-0.8 (NIR)0.8-1.1 (NIR)79 x 79182
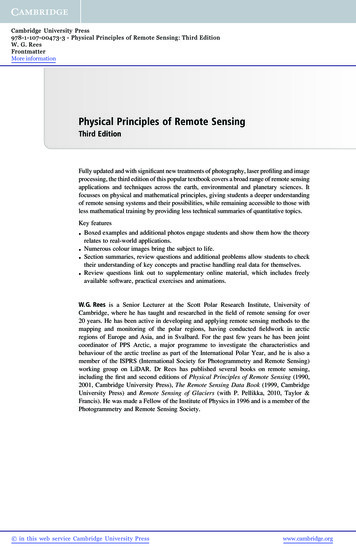
Spatial ResolutionPlanimetric data – roads, buildings, drivewaysSpatial Resolution80 meter MSS w/ planimetric overlay3
Spatial Resolution30 meter TM w/ planimetric overlaySpatial Resolution10 meter SPOT w/ planimetric overlay4
Spatial Resolution1 meter DOQ w/ planimetric overlaySpatial ResolutionSub-meter data w/ planimetric overlay5
Looking More Closely at ResolutionLooking More Closely at Resolution6
Looking More Closely at ResolutionLandsat MSSSatellite80 MeterResolution GridCellLooking More Closely at ResolutionLandsat TMSatellite30 MeterResolution GridCell7
Looking More Closely at ResolutionSPOT Satellite 10 MeterResolution Grid CellLooking More Closely at ResolutionIKONOS Satellite4 Meter ResolutionGrid Cell8
Looking More Closely at ResolutionIKONOS Satellite1 Meter ResolutionGrid CellSelected Satellite FootprintsLandsat 7185 by 170 km30-m multispectralIndian RemoteSensing145 by 145 km25-m multispectralSPOT60 by 60 km20-m multispectralQuickBird 216 by 16 km2.5-m multispectralIKONOS11 by 11 km4-m multispectralOrbView 310100010108 by 8 km4-m multispectral1-m panchromatic9
Resolutions of Remote Sensing1. Spatial (what area and how detailed)2. Spectral (what colors – bands)3. Temporal (time of day/season/year)4. Radiometric (color depth)The best spatial resolution?10
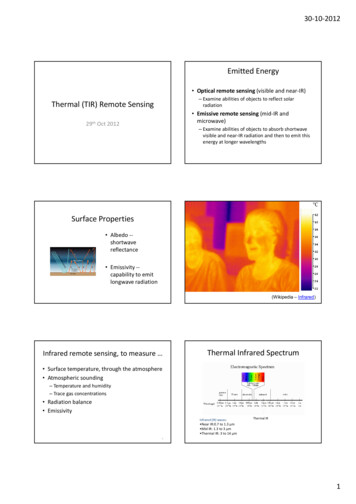
Resolutions of Remote Sensing1. Spatial (what area and how detailed)2. Spectral (what colors – bands)3. Temporal (time of day/season/year)4. Radiometric (color depth)Spectral Response CurveEMRpatterns arerecorded .sc.edu/geog/rslab/Rscc/mod1/emrpaths.gif11
Electromagnetic Radiation (EMR)Spectral Response Curve12
The spectralreflectance curves,or spectralsignatures, ofdifferent types ofground targetsprovide theknowledge basefor informationextraction.Spectral Response Curve13
Spectral Response CurveConcept of Spectral BandsSpectral responsesfrom ground tragetsare recorded inseparate spectralbands by sensors.Spectral Resolution Number of spectral bands (red, green, blue, NIR,Mid-IR, thermal, etc.) Width of each band Certain spectral bands (or combinations) aregood for identifying specific ground features Panchromatic – 1 band (B&W)Color – 3 bands (RGB)Multispectral – 4 bands (e.g. RGBNIR)Hyperspectral – hundreds of bands14
Comparison of Landsat SensorsThematic Mapper(TM) Landsat 4 and 516Enhanced ThematicMapper Plus (ETM )Landsat 71. 0.45-0.522. 0.53-0.613. 0.63-0.694. 0.78-0.905. 1.55-1.756. 2.09-2.357. 10.4-12.58. 0.52-0.90 (Pan)15 x 15 (Pan)30 x 3060 x 60 (TIR)16185 x 185183 x 170185 x 185705705915 (Landsat 1,2,3)SpectralResolution(µm)1. 0.45-0.52 (B)2. 0.52-0.60 (G)3. 0.63-0.69 (R)4. 0.76-0.90 (NIR)5. 1.55-1.75 (MIR)6. 2.08-2.35 (MIR)7. 10.4-12.5 visit in days)Spatialcoverage (km)Altitude (km)30 x 30120 x 120 (TIR)MultispectralScanner (MSS)Landsat 1-50.5-0.6 (green)0.6-0.7 (red)0.7-0.8 (NIR)0.8-1.1 (NIR)79 x 7918QuickBird SatelliteTrue-color andPseudo-color Images2.5-m Spatial ResolutionConcept of MultispectralAnd Pseudo-color Image15
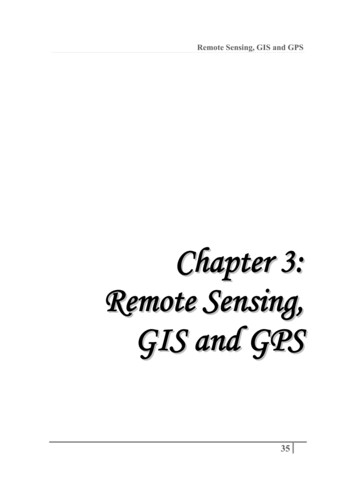
Landsat-7 Panchromatic Data (15 m)Landsat-7 ETM Data (30 m), Bands 3, 2, 1 in RGBLandsat-7 ETM Data (30 m), Bands 4, 3, 2 in RGBLandsat-7 ETM Data (30 m), Bands 4, 5, 3 in RGBSpectral Response CurveApril and May Spectra for P. australisand S. patens0.6BlueGreenRedNIRApril P. australisMay P. australisApril S. patensMay S. patensReflectance (%)0.50.40.30.20.10350450550650750850950Wavelength (nm)16
Spectral Response CurvesApril and May Spectra for P. australisand S. patens0.6VioletBlueGreenRedNIRMid-IRApril P. australisMay P. australisApril S. patensMay S. patensReflectance (%)0.50.40.30.20.10350450550650750850950Wavelength (nm)Airborne Terrestrial Applications Sensor (ATLAS)17
band wavelength (µm)Landsat-7ETM band #1-4Spectral Cover ofLandsat Sensors576Band 1: 0.45-0.52µm (blue).Provide increased penetration of waterbodies, as well as supporting analysis of landuse, soil, and vegetation characteristics.Band 2: 0.52-0.60µm (green).This band spans the region between the blueand red chlorophyll absorption bands andtherefore corresponds to the greenreflectance of healthy vegetation.Band 3: 0.63-0.69µm (red).This is the red chlorophyll absorption bandof healthy green vegetation and representsone of the most important bands forvegetation discrimination.18
Spectral Cover ofLandsat Sensors Band 4: 0.76-0.90µm (reflectiveinfrared). This band is responsive to theamount of vegetation biomass present inthe scene. It is useful for cropidentification and emphasizes soil-cropand land-water contrasts.Band 5: 1.55-1.75µm (mid-infrared)This band is sensitive to the amount ofmoisture in plants and therefore useful incrop draught and in plant vigor studies.Band 6: 2.08-2.35µm (thermal infrared)This band measures the amount ofinfrared radiant flux emitted from surface.Band 7: 2.08-2.35µm (mid-infrared)This is an important band for thediscrimination of geologic rockformation. It is effective in identifyingzones of hydrothermal alteration in rocks.Hyperspectral DataExample:Hyperion hyperspectral sensor is capable ofresolving 220 spectral bands at 10 nminterval (from 0.4 to 2.5 µm) with a 30 meterspatial resolution.The shown image, acquired April 6, 2004, isdisplayed as-- 640.50 µm in Red color-- 548.92 µm in Green color-- 457.34 µm in Blue color19
Hyperspectral DataAVIRIS DataNinigret PondRhode IslandTrue Colorvs.Pseudo ColorThermal Band (Landsat TM band 6)20
Resolutions of Remote Sensing1. Spatial (what area and how detailed)2. Spectral (what colors – bands)3. Temporal (time of day/season/year)4. Radiometric (color depth)Temporal ConsiderationsTime of day/season image acquisition Leaf on/leaf off Tidal stage Seasonal differences Shadows Phenological differences Relationship to field sampling21
Seasonal Considerations Spatial Spectral Temporal(seasonal) RadiometricSpring - bands 4,5,3Seasonal Considerations Spatial Spectral Temporal(seasonal) RadiometricSummer - bands 4,5,322
Seasonal Leaf-on vs. Leaf-offSeasonal Leaf-on vs. Leaf-off23
Forest Cover 1987Mt.Kilimanjaro(5,895m)Mt. Meru(4,566m)Forest Cover 2000Mt.Kilimanjaro(5,895m)Mt. Meru(4,566m)24
Landsat June 21, 2000Landsat June 14, 200325
How much has changed?How severe was the damage?What will be the ecosystem impacts? Repeat Coverage Considerations Revisit period for satellites – how often can youmake a measurement for the same area– Landsat – 16 days (continuous collection)– Quickbird – varies (point-and-shoot)– MODIS – daily (continuous collection) Airborne images – collected as needed26
Comparison of Landsat SensorsThematic Mapper(TM) Landsat 4 and 516Enhanced ThematicMapper Plus (ETM )Landsat 71. 0.45-0.522. 0.53-0.613. 0.63-0.694. 0.78-0.905. 1.55-1.756. 2.09-2.357. 10.4-12.58. 0.52-0.90 (Pan)15 x 15 (Pan)30 x 3060 x 60 (TIR)16185 x 185183 x 170185 x 185705705915 (Landsat 1,2,3)SpectralResolution(µm)1. 0.45-0.52 (B)2. 0.52-0.60 (G)3. 0.63-0.69 (R)4. 0.76-0.90 (NIR)5. 1.55-1.75 (MIR)6. 2.08-2.35 (MIR)7. 10.4-12.5 visit in days)Spatialcoverage (km)Altitude (km)30 x 30120 x 120 (TIR)MultispectralScanner (MSS)Landsat 1-50.5-0.6 (green)0.6-0.7 (red)0.7-0.8 (NIR)0.8-1.1 (NIR)79 x 7918Resolutions of Remote Sensing1. Spatial (what area and how detailed)2. Spectral (what colors – bands)3. Temporal (time of day/season/year)4. Radiometric (color depth)27
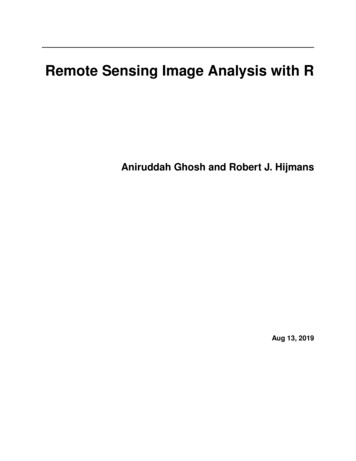
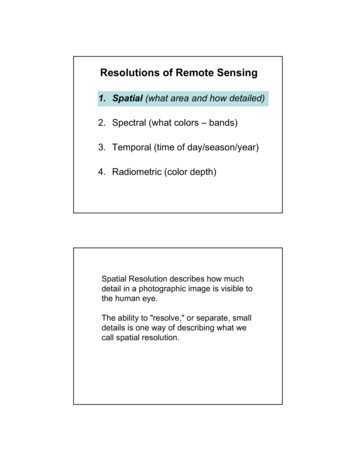
Radiometric ResolutionEvery time an image is acquired by a sensor,its sensitivity to the magnitude of theelectromagnetic energy determines theradiometric resolution.The finer the radiometric resolution of a sensor,the more sensitive it is to detecting smalldifferences in reflected or emitted energy.Imagery data are represented by positive digital numbers which varyfrom 0 to a selected power of 2. This range corresponds to thenumber of bits used for coding numbers in binary format. Each bitrecords an exponent of power 2.The maximum number of brightness levels available depends on thenumber of bits used in representing the energy recorded. Thus, if asensor used 8 bits to record the data, there would be 28 256 digitalvalues available, ranging from 0 to 255.8 bits11 bits1234567891011Number of bits24816326412825651210242048MaximumValuesData volume will increase as the radiometric resolution increases?28
Band 6: 2.08-2.35µm (thermal infrared) This band measures the amount of infrared radiant flux emitted from surface. Band 7: 2.08-2.35µm (mid-infrared) This is an important band for the discrimination of geologic rock formation. It is effective in identifying zones of hydrothermal alteration in rocks. Spectral Cover of Landsat Sensors