Transcription
Hydrology and Groundwater NotesTestmasters
Table of ContentsHydrology 4Hydrology and the Hydrologic Cycle 4Components of the Hydrologic Cycle – Storages and Flows 5Precipitation 7Storm Characteristics 7Intensity-Duration-Frequency (IDF) Curves 7Synthetic Rainfall Distributions from the NRCS 10Double-Mass Analysis of Point Precipitation 12Estimating Missing Point Precipitation Data 13Converting Point Precipitation to Areal Precipitation 14Evapotranspiration 16Evaporation from an Open-Water Body 16Reservoirs 17Water Supply Reservoirs 17Reservoirs for Flood Control and Other Uses 18Flood Control Analysis and Design 19Streamflow or Total Runoff Hydrograph 21Frequency and Probability for Flood Control Design 24Travel Time Concepts 25Time of Concentration 25Effective Rainfall Model for Effective Rainfall Generation from Rainfall 32Phi (Φ) Index Approach 32NRCS (previously SCS) Curve Number Method 33Peak Runoff Calculation 45Rational Formula 45Modified Rational Formula 47NRCS Graphical Peak Discharge Method 48Total Runoff Hydrograph Separation into Direct Runoff and Baseflow 53Unit Hydrograph Method for Converting Effective Rainfall into a Direct RunoffHydrograph 55Determination of a Unit Hydrograph from a Total Runoff Hydrograph 55Convolution of Effective Rainfall with the Unit Hydrograph to Generate Direct Runoff Hydrographs57Generating Unit Hydrographs of Different Duration (tr) 59NRCS Synthetic Unit Hydrograph 62Groundwater 66Aquifers 66Aquifer Characteristics 67Permeability, Conductivity, Transmissivity 68Averaging Saturated Hydraulic Conductivity on Layered Aquifers 70Constant Head Permeability Test 71Variable or Falling Head Permeability Test 72Empirical Formulas for Estimating Hydraulic Conductivity or Permeability 73Storativity, Specific Retention, and Specific Capacity 732
Unsaturated Zone 75Darcy’s Law 76Well Drawdown in Aquifers 77Steady-State Well Discharge for an Unconfined Aquifer 77Steady-State Well Discharge for a Confined Aquifer 78Transient or Unsteady Well Discharge for a Confined Aquifer 80Typical Soil Properties 823
HydrologyHydrology and the Hydrologic Cycle Hydrology – Science that is concerned with the occurrence, movement anddistribution of water within the Earth (land and ocean) and atmosphere. Hydrologic cycle – Continuous process by which water is purified by evaporationand transported from the Earth’s surface including oceans to the atmosphere andback to the land and oceans as precipitation. Watershed, drainage basin – Topographically defined area drained by a river orsystem of interconnected rivers such that the entire outflow from the area isdischarged through a single outlet. Water balance equation – The change in storage per unit time on a control volume(e.g. area, watershed, reservoir etc.) equals the sum of the inflows minus the sumof the outflows from the control volume. S Qin Qout t S t ( Qin Qout ) Vin Vout S change in storage on a control volume (L3) t time interval (t)Qin inflows into the control volume (L3/t)Qout outflows out of the control volume (L3/t)Vin volume into the control volume (L3)Vout volume out of the control volume (L3)Qin SQoutover time interval tOver a long period, positive and negative water storage variations tend to balanceand the change in storage S may be disregarded.4
Components of the Hydrologic Cycle – Storages and Flows Precipitation – Includes rain, snow and other forms of water falling from theatmosphere in liquid or solid phase into the land and oceans. Evaporation – Physical process by which water is vaporized into the atmospherefrom free water surface and land areas. Transpiration – Water from the soil is absorbed by plant roots and eventuallydischarged into the atmosphere through little pores in the leaves called stomata. Itis a side effect of the plant needing to open its stomata in order to obtain carbondioxide from the air for photosynthesis. Transpiration cools plants and allowsflow of nutrients from the plants roots to its stems and leaves. Evapotranspiration – Combined processes by which water is transferred to theatmosphere from open water surfaces and vegetation. Potential Evapotranspiration – Measure of how much the atmosphere controlsevapotranspiration independent of the surface hydrologic conditions. Quantity ofwater evaporated from an idealized extensive free water surface per unit area, perunit time under existing atmospheric conditions. Detention storage – Fraction of precipitation that is stored temporarily on the landsurface en route to a stream. Infiltration – Movement of water from the land surface to the upper layers of thesoil. It is usually the major abstraction from rainfall during a significant runoffproducing storm. Percolation – Movement of water through the subsurface down to the water table. Overland flow – Portion of runoff that travels over the surface of the ground toreach a stream channel and through the channel to the basin outlet. This processoccurs relatively quickly. Surface runoff – Includes all overland flow as well as precipitation falling directlyonto stream channels. Subsurface runoff – Portion of runoff that travels under the ground to reach astream channel and to the basin outlet. It includes: a) interflow, and b)groundwater runoff. Interflow, throughflow, subsurface storm flow – Portion of subsurface runoff thattravels laterally through the unsaturated zone or through a shallow perched5
saturated zone towards a stream channel. This process is slower than surfacerunoff. Groundwater runoff – Portion of subsurface runoff that comes from infiltrationand subsequently percolation down to the water table and eventually reaches astream channel. This process occurs relatively slowly. Baseflow, base runoff, delayed runoff – Portion of the total runoff hydrograph at astream location which is composed of contributions from: a) groundwater runoff,and b) delayed interflow. Baseflow is the result of water accumulating fromprevious storms and being released over an extended period of time. Direct runoff – Portion of the total runoff hydrograph at a stream which is causedby and directly following a rainfall or snowmelt event. It consists of: a) overlandflow, and b) quick interflow Effective precipitation, effective rainfall, precipitation excess – Portion ofprecipitation that reaches stream channels as direct runoff. Abstractions – Portion of precipitation that does not contribute to direct runoff.Includes interception, depression storage, and infiltration. Infiltration is usuallythe major abstraction from rainfall during a significant runoff-producing storm. Initial abstractions – Abstractions prior to the beginning of runoff includinginfiltration prior to ponding, depression storage and interception Interception – Fraction of precipitation that is retained on buildings and plants andis eventually evaporated. Depression storage – Fraction of precipitation that is trapped in puddles, ditches,and other surface depressions from where it evaporates or infiltrates into the soil.6
PrecipitationPrecipitation is one of the most important components of the hydrologic cycle as itconnects the atmospheric component of the hydrologic cycle with the land and oceancomponents. It includes rain, snow and other forms of water falling from the atmospherein liquid or solid phase into the land and oceans.The most common types of rain gages are the tipping-bucket gage, and the weighing raingage. Data collected from these gages can be plotted as a hyetograph, which is a plot ofthe amount of precipitation (volume or intensity) that falls as a function of time.Storm CharacteristicsThe characteristics of a storm, namely depth, duration, intensity and distribution, affectthe watershed response to the rainfall event.Depth – Amount of precipitation that falls (usually in or cm).Duration – Length of a storm (usually min, hr or day)Intensity – Depth of rainfall per unit time (usually in/hr or cm/hr). Rainfall intensitychanges continuously throughout a storm, but it may be averaged over short timeintervals or over the entire storm duration.Distribution – Describes how rainfall depth or intensity varies in space over an area orwatershedIntensity-Duration-Frequency (IDF) CurvesIntensity – Depth of rainfall per unit time (usually in/hr or cm/hr). Rainfall intensitychanges continuously throughout a storm, but it may be averaged over short timeintervals or over the entire storm duration.Duration – length of a storm (usually min, hr or day)Return period, frequency of occurrence, recurrence interval (F, years) – Average numberof years between events of a given intensity.1P( X x)F return period (years)F 7
P( X x) cumulative or exceedance frequency probability that an event X in anygiven year will equal or exceed xP( X x) can be approximated based on historical data by:mP ( X x) n 1m rank of value x, with the largest equal to 1n number of values (in this case, number of years in the period of record) The probability of an event of recurrence interval F occurring in any given yearis:1P ( X x) FFor example, a 1 in 100 year storm has a 1% chance of being equaled or exceededin intensity each year. That is, the storm would be equaled or exceeded onaverage 1 in 100 years. The probability of an event of recurrence interval F not occurring in any givenyear is:1P ( X x) 1 P ( X x) 1 FFor example, a 1 in 100 year storm has a 99% chance of not being exceeded inintensity each year. The probability of exactly K events of recurrence interval F occurring in n yearsis:k n k1 1 P{exactly K of F events in n years} C kn 1 F F wheren!C kn k!(n k )!The probability of at least one event of recurrence interval F occurring in n yearsis:P{at least one F event in n years} 1- P{exactly 0 F events in n years}1 1 1 F nRelationship between intensity, duration and frequency of a storm: The longer the duration of a storm, the lower its average intensity.High-intensity storms happen infrequently (have a large return period).8
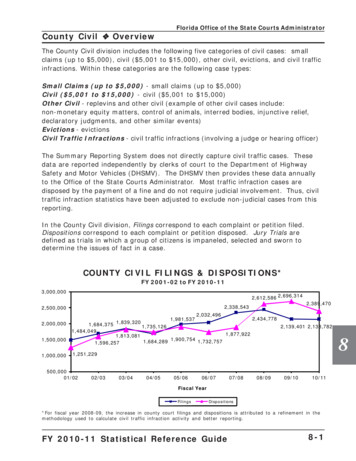
Typical Intensity-Duration Frequency CurveSource: Civil Engineering Reference Manual for the PE Exam, 10th Ed. (Lindeburg,2006)Steel’s formula encapsulates these two observations:Kt bi intensity (in/hr)t duration (min or hr depending on how K and b are defined)K,b constants empirically derived for a return period and locationi Steel formulaWhen using the rational formula to compute peak runoff rate for storm drainage design, tis usually taken as the time of concentration, tc, for the drainage area.The constants K and b can be obtained by performing an I-D-F analysis of historicalprecipitation data. These constants have been developed for 7 rainfall regions in the USand can be used in the absence of local historical precipitation data (Table 20.2 of theCERM, 10th ed. Lindeburg, 2006).9
Steel formula Rainfall Regions and CoefficientsNote: The above coefficients apply for i in inches/hr, and t in minutes.Source: Civil Engineering Reference Manual for the PE Exam, 10th Ed. (Lindeburg,2006)Synthetic Rainfall Distributions from the NRCSThe National Resources Conservation Service (previously the Soil Conservation Service)has developed four synthetic 24-hour rainfall distributions that can be used for stormdrainage design in the absence of historical rainfall records. These distributions applywithin predefined regions of the United States with common climatic and watershedconditions and are based on duration-frequency data from the National Weather Serviceas well as local storm data. Type IA is the least intense and type II represents the mostintense short duration rainfall. The distributions are tabulated in the NRCS TechnicalRelease 20 (TR-20) in terms of the fraction of 24-hour rainfall that occurs within the 24hours.10
SCS 24-hour rainfall distributionsSource: NRCS TR-55Approximate geographic boundaries for NRCS (SCS) rainfall distributionsSource: NRCS TR-5511
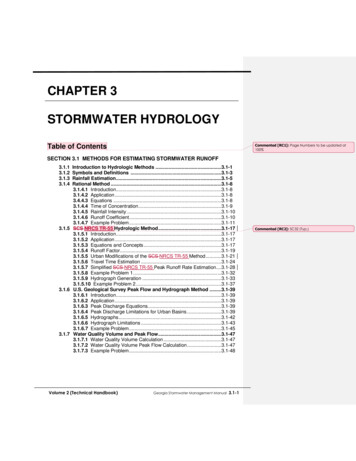
Double-Mass Analysis of Point PrecipitationThe double-mass analysis is used to detect if data at a site have been subjected to asignificant change in magnitude due to external factors such as problems withinstrumentation, observation practices, or recording conditions.It consists of plotting cumulative rainfall values at a test station against the cumulativemean rainfall values at surrounding (base) stations. It is assumed that changes due tometeorological factors will affect all stations equally and therefore any breaks in thedouble-mass curve are strictly due to external factors. However, natural variations in thedata can produce apparent changes in slope that need to be investigated further byperforming statistical hypothesis testing analysis.If the data are consistent, the double-mass curve will be a straight line of constant slope.If the data is not consistent, a break in the double-mass curve will be apparent. The ratioof the slopes prior (a) and after the break (b) can be used to adjust the data in two ways:1. The data can be adjusted to reflect conditions prior to the break. This is done bymultiplying each precipitation value after the break by the ratio a/b.or2. The data can be adjusted to reflect recent conditions after the break. This is doneby multiplying each precipitation value prior to the break by the ratio b/a.Applicability: Base stations should be located relatively close to station being tested. Method should not be used in mountainous areas where precipitation can deviatesignificantly for nearby stations. Method should only be used for long-term adjustment of precipitation data but notfor adjusting daily or storm precipitation.12
Double-mass curve analysis100Cumulative rainfall at test stationOriginal dataData adjusted toreflect conditionsprior to the break90807060bbreak501Data adjusted toreflect conditionsafter the break4030a2011010090807060504030201000Cumulative value at surrounding (base) stationsEstimating Missing Point Precipitation DataThe most common methods for estimating missing point precipitation data include: Arithmetic Average Method – Missing precipitation values at a station can beestimated by a simple arithmetic-average of concurrent precipitation at three ormore stations which are close to and evenly spaced around the location wheredata is missing. Use method only if the normal annual precipitation at the threesites do not vary significantly ( 5-10%) from the missing station’s normal annualprecipitation. Normal Ratio Method - Missing precipitation values at a station can beestimated from concurrent observations at 3 or more neighboring stations basedon the normal-ratio method:Px1 n P i N x n i 1 N i Px missing precipitation value at station xNx normal long-term, usually annual, precipitation at station X. Nx could alsobe taken as the long-term average value for a particular month for all years ofrecord.Pi precipitation value at neighboring station i for the concurrent period13
Ni normal long-term precipitation for neighboring station in number of neighboring stations Inverse Distance Squared Method – Missing precipitation values at a stationcan be estimated from concurrent precipitation measurements at the closeststations in each of 4 quadrants (North, South, East, and West). n Pi 2 i 1 d i x Px n 1 2 i 1 d i x Px missing precipitation value at station xdi-x distance from station i to station xPi precipitation value at neighboring station i for the concurrent periodn number of neighboring stations (4: one on each quadrant N, S, E, W)Converting Point Precipitation to Areal PrecipitationThe most common methods of determining rainfall averages for an area based on data fora limited number of precipitation gages include: Arithmetic Average Method – Assigns equal weight to all gages irrespective oftheir relative spacing and other factors. Appropriate if gages are uniformlydistributed over a flat area. Thiessen Polygon Method – Perpendicular bisectors of the lines connecting thegages form polygons around each gauge. The basin average rainfall is thendetermined as a weighted average of the precipitation at each gage, with theweighting factor being the polygon area.NP i 1N i 1Ai PiAiP average precipitation for the areaPi precipitation at gage iAi area of Thiessen polygon enclosing gage iN number of gages or Thiessen polygons Isohyetal Method – It is considered the most accurate method since it considersorographic effects.1. Contours of equal precipitation are drawn.2. The area between successive isohyets is computed and multiplied by thenumerical average of the two contour values.14
3. The sum of #2 is computed and divided by the total drainage area to computethe weighted average precipitation.NP i 1N i 1Ai PiAiP average precipitation for the areaPi average precipitation between two successive contoursAi area between two successive contoursN number of areas between successive contours15
EvapotranspirationEvapotranspiration (actual evapotranspiration, AET) is the combined processes bywhich water is transferred to the atmosphere from open water surfaces and vegetation. Itconsists of evaporation, which is the amount of water vaporized into the atmosphere fromopen water surfaces and land areas, and transpiration, which is the amount of waterabsorbed by plants and crops and eventually discharged into the atmosphere through theplants stomata. The source of water for the plants and crops can be from the unsaturatedand saturated zones.During larger storm events, the intensity of precipitation is much larger than the rate ofevapotranspiration. Therefore, evapotranspiration is commonly ignored or lumped withother abstractions when analyzing the water budget during and immediately following astorm event. For longer and drier periods, evapotranspiration becomes a significantcomponent of the water budget.Potential evapotranspiration (PET) is a measure of how much the atmosphere controlsevapotranspiration independent of the surface hydrologic conditions. It is the quantity ofwater evaporated from an idealized extensive free water surface per unit area, per unittime under existing atmospheric conditions.Moisture deficiency limits the actual evapotranspiration rate, therefore AET PET.Evaporation from an Open-Water BodyAn evaporation pan is usually used to estimate evaporation from an open water body (e.g.lake or reservoir). The pan evaporation is computed based on the difference in theobserved water levels adjusted for any precipitation observed between observations. Theactual evaporation from a real open water body is smaller than that measured from a pan.Therefore, a correction coefficient is applied to the measured pan evaporation:E L KE PEL evaporation from an open water bodyK pan coefficient (0.6-0.8, with an average value of 0.7)EP pan evaporationApplicability: The largest errors in the evaporation pan method are due to the assumed pancoefficient. Therefore, the method is usually useful to provide long-term ballparkestimates of evaporation and to analyze the variability of evaporation.The method is more appropriate for very shallow water bodies. For large waterbodies, it may necessary to adjust for heat storage and energy advection.16
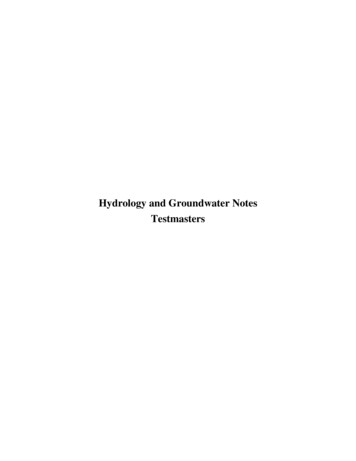
ReservoirsIn an ideal world, the quantity, timing, quality, and distribution of available water wouldmatch human needs. Unfortunately, freshwater is scarce in many parts of the world,threatening human health, limiting agricultural and industrial production, and causingecological degradation. It is estimated that less than 3/4 of a percent of the total volumeof water on Earth is freshwater stored in aquifers, the vadose zone, lakes, streams,wetlands, and the atmosphere. On the other hand, excess water at the wrong time andlocation, can cause catastrophic flooding.Reservoirs serve multiple purposes that are directly related to the quantity, timing, qualityand distribution of water. These include flood control, water supply, water quality,groundwater recharge, sediment control. Secondary purposes include recreation, wildlifehabitat enhancement, etc.Water Supply ReservoirsWater supply reservoirs are used to store water during periods of surplus and provide asource of water during periods of drought. Water supply reservoirs may serve a dualpurpose of flood control.A Rippl diagram is a common method of sizing water supply reservoirs. It consists of agraph of cumulative inflows and cumulative demands from the reservoir with respect totime. Generally a constant demand is assumed, so the cumulative demand will plot as astraight line. The cumulative inflow curve will have a large slope during periods of highinflow, and will flatten out during periods of little or no inflow. If pseudo-demand linesare drawn tangent to a peak and a subsequent trough, the separation between the two linesgives the volume that would need to be stored in the reservoir to satisfy the constantdemand for that period. The reservoir capacity required so that the community served bythe reservoir does not run out of water during a drought condition would be the largestseparation between pseudo-demand lines.17
Rippl diagramCumulative inflowCumulative demand70000Cumulative inflow or demand (ac-ft)60000Minimumrequiredreservoircapacity 32,160 ac-ft5000040000300002000010000Jan9M 6ar-9M 6ay-9Ju 6l -9Se 6pN 96ov-9Ja 6n9M 7ar-9M 7ay-9Ju 7l -9Se 7pN 97ov-9Ja 7n9M 8ar-9M 8ay-9Ju 8l -9Se 8pN 98ov-9Ja 8n9M 9ar-9M 9ay-9Ju 9l -9Se 9pN 99ov-9Ja 9n0M 0ar-0M 0ay-0Ju 0l -0Se 0pN 00ov-000DateRippl Diagram of cumulative inflow and demandReservoirs for Flood Control and Other Uses Detention reservoir/pond/basin, dry pond – Reservoir designed to store watertemporarily as part of a flood control management system. It has no conservationpool. The reservoir is designed to temporarily store a specific volume of runoff,which is usually defined in terms of a return frequency (e.g. 100 year flood).Most are designed to empty out the runoff after the peak of the runoff has passed(usually less than a day) by slowly draining (usually through a bleeder) into anearby flood control conveyance system. If the flow exceeds the storage capacityof the reservoir, an uncontrolled structure (usually a spillway) provides an outletfor the excess water. Retention reservoir/pond/basin – Reservoir that holds water for an extendedperiod of time. It has a conservation pool. Retention ponds usually serve twomain purposes: to contain runoff generated by urban development, and to providelocalized recharge to the groundwater system which would otherwise be limiteddue to imperviousness of urban cover. Other uses include pollution control byfiltering of stormwater, fish and wildlife habitat, sedimentation control, recreationetc. If the flow exceeds the storage capacity of the reservoir, an uncontrolledstructure (usually a spillway) provides an outlet for the excess water.18
Flood Control Analysis and DesignFlood control reservoirs and other flood control facilities are designed to contain excessprecipitation resulting from extreme storms or rapid snowmelt. In designing thesefacilities, it is important to estimate the timing, quantity, distribution and peak flowassociated with extreme storm events. This information is encapsulated in a hydrograph,which is a plot of streamflow as a function of time at a specific location in a streamchannel. In addition, it is important to determine the probability of exceedance of theseevents due to safety and economic considerations.The diagrams below summarize the processes required for estimating a hydrograph at alocation downstream of a stream or reservoir, and the peak flood discharge associatedwith a storm event. These processes are discussed in more detail in the next infallStreamand/orreservoirroutinghydrologic ingDownstreamhydrograph**Not discussed hereProcess for generating an outflow (downstream) hydrograph for a stream orreservoir starting from lModelEffectiveRainfallPeakdischargeProcess for estimating the peak discharge starting from rainfall19
To generate a downstream hydrograph, the rainfall falling on a watershed or contributingarea is converted into effective rainfall by means of an effective rainfall model. Aneffective rainfall model converts the total (gross) precipitation into abstractions andeffective rainfall which eventually reaches a stream channel as direct runoff.The abstractions are the portion of precipitation that does not contribute to direct runoff.They include interception, depression storage, and infiltration. Infiltration is usually themajor abstraction from rainfall during a significant runoff-producing storm. Someabstractions occur immediately after the beginning of a storm prior to the beginning ofrunoff. These are called initial abstractions and include infiltration prior to ponding,depression storage and interception. Infiltration – Movement of water from the land surface to the upper layers of thesoil. It is usually the major abstraction from rainfall during a significant runoffproducing storm. Depression storage – Fraction of precipitation that is trapped in puddles, ditches,and other surface depressions from where it evaporates or infiltrates into the soil. Interception – Fraction of precipitation that is retained on buildings and plants andis eventually evaporated.Effective rainfall (effective precipitation, precipitation excess) is the portion ofprecipitation that is available as overland flow supply. In order for water to start flowingthrough the land surface, first a very thin layer of water needs to be stored on the landsurface to provide continuity of flow en route to a stream. This volume of water is calleddetention storage. The effective rainfall (overland flow supply) travels through the landsurface until it eventually reaches stream channels as direct runoff. Direct runoff – Portion of the total runoff hydrograph at a stream which is causedby and directly following a rainfall or snowmelt event. It consists of: a) overlandflow, and b) quick interflow. It contributes rather quickly to streamflow.To quantify this lag or travel time between effective rainfall and direct runoff, a basinrouting model is used. One such model is a unit hydrograph, which describes the shortterm response of a watershed to a unit volume of effective rainfall applied uniformly overthe entire watershed at a constant rate for a unit time. It includes contributions tostreamflow immediately following a rainfall event (i.e. only includes contribution fromdirect runoff and excludes baseflow). The unit hydrograph is assumed to encapsulate allthe combined physical characteristics of the basin and that of the storm. Based on theeffective rainfall and the basin routing model the direct runoff hydrograph reaching astream is produced. Alternatively, if only the peak of the direct runoff hydrograph is ofinterest, a peak discharge model can be used.In addition to the direct runoff, a stream receives inflows from the subsurface. Thiscomponent of the streamflow hydrograph is known as baseflow or delayed runoff since it20
has a much longer travel time than the direct runoff. The source of this flow is fromwater that infiltrated during previous storm events and percolated down into thegroundwater, where it flowed through the unsaturated and saturated zones until itdischarged into a stream. Baseflow, base runoff, delayed runoff – Portion of the total runoff hydrograph at astream location which is composed of contributions from: a) groundwater runoff,and b) delayed interflow. Baseflow is the result of water fr
Source: Civil Engineering Reference Manual for the PE Exam, 10th Ed. (Lindeburg, 2006) Steel's formula encapsulates these two observations: t b K i Steel formula i intensity (in/hr) t duration (min or hr depending on how K and b are defined) K,b constants empirically derived for a return period and location