Transcription
WHEATand FLOURTESTINGMETHODSA Guideto UnderstandingWheat and FlourQualityWHEAT MARKETING CENTER, INC.
Wheat and Flour Testing Methods: A Guide to Understanding Wheatand Flour Quality provides an introduction to the analysis of wheatand flour in a clear and concise format. Basic information ispresented on standardized testing procedures for wheat and flourquality characteristics as well as dough properties. Results fromthese tests are explained and applied to processing performance andend product quality. Laboratory testing of a variety of wheat-basedfinished products is also included. The finished product formulationsand processes described are laboratory testing protocols that areused to evaluate flour quality. They are model systems that maybe used to predict commercial production for common uses ofwheat flour worldwide.Additional support provided by:ColoradoWheat CommissionWashingtonWheat Commission
W H E AT A N D F LO U RTESTING METHODSA Guide to UnderstandingWheat and Flour QualityWheat Marketing Center, Inc.Portland, OregonUSA
Copyright 2004All rights reserved. No part of this publication may be reproduced or transmitted in anyform or by any means, electronic or mechanical, including photocopying, recording or anyinformation storage or retrieval system, without permission in writing fromWheat Marketing Center, Inc. or North American Export Grain Association, Inc.1. Copies Available: This publication was produced with financial assistance provided underthe Untied States Department of Agriculture Market Access Program as authorized underSection 203 of the Agricultural Trade Act of 1978 and amended. Additional copies can beobtained by contacting either Wheat Marketing Center Inc. (WMC), 1200 NW Naito Parkway,Suite 230, Portland, OR 97209-2831, 503.295.0823 or North American Export GrainAssociation (NAEGA), 1250 Eye Street NW, Suite 1003, Washington D.C. 20005, 202.682.4030.2. Disclaimer: The information in this publication was developed by Wheat Marketing Center,Inc. with the support of North American Export Grain Association. The accuracy of theinformation reported and interpreted is not guaranteed. All contents are subject to correctionand revision. WMC and NAEGA disclaim any responsibility whatsoever for the use of theinformation contained herein.3. Notice: In accordance with Federal law and U.S. Department of Agriculture, NAEGA andWMC do not discriminate on the basis of race, color, national origin, sex, age, religion,or disability.Printed in the United States of America.Design: Laurie Causgrove DesignEditing: Pamela Causgrove, English Language SolutionsPhotography: Burt Peterson PhotographyPages 52 & 60: Courtesy of Wheat Foods Council
W H E AT A N D F LO U R T E S T I N G M E T H O D SPrefaceThe purpose of this book is to provide an introduction to theanalysis of wheat and flour. Basic information on chemicaltesting, physical testing, and flour milling is presented in Section One.Additional information on the rheological properties of dough isincluded as well as comparisons of the weak and strong glutenproperties.Laboratory product testing of a variety of wheat-based finishedproducts is presented in Section Two. Formulas and processing stepsare briefly described and finished product attributes are presented.This book is designed to provide basic information in a clearand concise format. The testing methods and finished product pagesare organized into three parts. The first part is titled “Method” andoutlines the steps involved in performing the analysis or producingthe product. The second part is titled “Results” and explains the resultsof the testing procedures and how they are expressed. The third partis titled “Why is this important?” and discusses the relevance andapplication of the testing methods and the finished products.
North American Export Grain Association, Inc. (NAEGA)North American Export Grain Association (NAEGA) was established in 1912 topromote and sustain the development of commercial export of grain and oilseed tradefrom the United States. NAEGA is comprised of private companies, public corporations, andfarmer-owned cooperatives involved in the bulk grain and oilseed exporting industry.Members of NAEGA ship the vast majority of 15 billion in exports of U.S. bulk grain andoilseeds. NAEGA acts as a unified voice for the export grain industry to represent its views andconcerns. Government agencies and officials rely on NAEGA to communicate U.S. policiesand programs to the trade and to gather input on farm and trade policy issues. NAEGA publications provide information and commentary on industry issues, developments, and events.NAEGA committees act in leadership roles to address technical issues affecting the industry,such as grain handling, grades and inspection, and trade and contract matters. NAEGA isactive in the international grain and oilseed market and works with the USDA Market AccessProgram (MAP) to promote exports of U.S. farm products.Wheat Marketing Center, Inc. (WMC)Wheat Marketing Center, Inc. (WMC) was founded in 1989 to provide a bridge betweenU.S. wheat farmers and wheat consumers worldwide. To meet the needs of the wheatindustry, WMC conducts objective wheat utilization research on all classes of wheat andprovides timely, relevant research to wheat buyers, processors, and sellers. WMC educatesthe wheat industry on end-use quality characteristics by developing and delivering dynamicmultimedia wheat quality courses, publications, and presentations. WMC partners with allsegments of the wheat industry, including North American Export Grain Association, U.S.Wheat Associates, farmers, wheat exporters, wheat organizations, and domestic and international wheat and flour processors, and strives for continuous impact by dynamic responsiveness to market fluctuations. WMC has technical expertise in wheat and flour testing andfinished product attributes that is used by wheat processors in Asia, Latin America, NorthAmerica, and Europe.4
W H E AT A N D F LO U R T E S T I N G M E T H O D SAcknowledgementsThis book is the result of a U.S. Department of Agriculture Market Access Program(MAP) grant made available to Wheat Marketing Center, Inc. by the Market AccessProgram Committee of the North American Export Grain Association (NAEGA).Writing and producing this book is a joint project with many people contributing.Wheat Marketing Center, Inc. (WMC) appreciates the help and support of: Gary Martin, President and CEO of NAEGA, for his leadership in providing direction andarranging financial assistance for this project. Tom Hammond, Chairman of the NAEGA MAP Committee, for his leadership andforesight in recognizing the potential benefits of this project to the wheat export industry. The technical staff of Wheat Marketing Center, Inc: Annette Doan, Carla Franzoni,Kevin Marquardt, Tina Tran, Flora Engelmann, Khari Holmes, and Mia Biberic for theircommitment to excellence and enthusiastic assistance in producing this book, and toWMC Technical Manager and Asian Foods Specialist Gary Hou and Laboratory SupervisorBon Lee for their technical expertise, critical insights, and valuable suggestions. The creative team who produced this book: Editor Pamela Causgrove for her precise command of the written word. Photographer Burt Peterson for his remarkable ability to capture the essence of atechnical process in a single photo frame.GraphicDesigner Laurie Causgrove for her artistic design of this book. Colorado Wheat Administrative Committee, Idaho Wheat Commission, Montana Wheatand Barley Committee, Nebraska Wheat Board, North Dakota Wheat Commission,Oregon Wheat Commission, Washington Wheat Commission, and U.S. Wheat Associatesfor their support of this project as well as ongoing support of Wheat Marketing Center,Inc. programs. The Wheat Foods Council for granting permission to use its photos and diagrams toenhance the material.David SheltonExecutive DirectorWheat Marketing Center, Inc.5
Table of ContentsSection OneW H E ATANDFLOUR TESTS .9Basic TestsMoisture Content . . . . . . . . . . . . . . . . . . . . . . . . . . . . . . . . . . . . . . . 10Ash Content. . . . . . . . . . . . . . . . . . . . . . . . . . . . . . . . . . . . . . . . . . . . 12Protein Content . . . . . . . . . . . . . . . . . . . . . . . . . . . . . . . . . . . . . . . . 14Falling Number . . . . . . . . . . . . . . . . . . . . . . . . . . . . . . . . . . . . . . . . . 16Physical TestsFlour Color Analysis . . . . . . . . . . . . . . . . . . . . . . . . . . . . . . . . . . . . . 18Single Kernel Characterization System (SKCS) . . . . . . . . . . . . . . . . 20Milling TestBuhler Laboratory Flour Mill . . . . . . . . . . . . . . . . . . . . . . . . . . . . . . 22“How Wheat is Milled” Diagram . . . . . . . . . . . . . . . . . . . . . . . . . . . 24Wet Gluten TestGlutomatic. . . . . . . . . . . . . . . . . . . . . . . . . . . . . . . . . . . . . . . . . . . . . 26Dough and Gluten Strength TestsFarinograph . . . . . . . . . . . . . . . . . . . . . . . . . . . . . . . . . . . . . . . . . . . . 28Extensigraph . . . . . . . . . . . . . . . . . . . . . . . . . . . . . . . . . . . . . . . . . . . 32Alveograph. . . . . . . . . . . . . . . . . . . . . . . . . . . . . . . . . . . . . . . . . . . . . 36Mixograph . . . . . . . . . . . . . . . . . . . . . . . . . . . . . . . . . . . . . . . . . . . . . 40Flour Starch Viscosity TestsAmylograph . . . . . . . . . . . . . . . . . . . . . . . . . . . . . . . . . . . . . . . . . . . . 44Rapid Visco Analyzer. . . . . . . . . . . . . . . . . . . . . . . . . . . . . . . . . . . . . 486
W H E AT A N D F LO U R T E S T I N G M E T H O D SContentsSection TwoL A B O R A T O R Y P R O D U C T T E S T S . . . . . . . . . . . . . . . . . . . . . . . 51Product TestsPan Bread. . . . . . . . . . . . . . . . . . . . . . . . . . . . . . . . . . . . . . . . . . . . . . 52Hearth Bread . . . . . . . . . . . . . . . . . . . . . . . . . . . . . . . . . . . . . . . . . . . 54Flat Bread. . . . . . . . . . . . . . . . . . . . . . . . . . . . . . . . . . . . . . . . . . . . . . 56Asian Steamed Bread . . . . . . . . . . . . . . . . . . . . . . . . . . . . . . . . . . . . . 58Sugar Snap Cookie . . . . . . . . . . . . . . . . . . . . . . . . . . . . . . . . . . . . . . 60Sponge Cake . . . . . . . . . . . . . . . . . . . . . . . . . . . . . . . . . . . . . . . . . . . 62Extruded Pasta. . . . . . . . . . . . . . . . . . . . . . . . . . . . . . . . . . . . . . . . . . 64Asian Sheeted Noodles . . . . . . . . . . . . . . . . . . . . . . . . . . . . . . . . . . . 66Product AnalysesAsian Noodle Texture Analysis . . . . . . . . . . . . . . . . . . . . . . . . . . . . . 68Asian Noodle Color Analysis . . . . . . . . . . . . . . . . . . . . . . . . . . . . . . 707
A Kernel of Wheat. . . sometimes called the wheat berry. The kernelis the seed from which the wheat plant grows.Each tiny seed contains three distinct parts that are separatedduring the milling process to produce flour.KernelBran. . . about 83% of the kernelweight and the source of whiteflour. The endosperm contains the greatest share ofprotein, carbohydrates, and iron as well as themajor B-vitamins, such as riboflavin, niacin, andthiamine. It is also a source of soluble fiber.EndospermEndosperm. . . about 14% of the kernel weight.Bran is included in whole wheat flourand can also be bought separately. The bran contains a small amount of protein, trace minerals,and dietary fiber (primarily insoluble).Bran. . . about 2.5% of the kernel weight.The germ is the embryo or sproutingsection of the seed. It is often separated from flourbecause the fat content (10%) limits shelf life. Thegerm contains minimal quantities of high quality proteinand a greater share of B-complex vitamins and traceminerals. Wheat germ is a part of whole wheat flour andcan be purchased separately.GermGerm8Courtesy of Wheat Foods Council, 10841 S. Crossroads Drive, Suite 105, Parker, Colorado 80138.
Section OneWH E ATA N DTFL O U RE S T SThe wheat and flour tests described in this section are standardized testingprocedures commonly used for quality control purposes. Results from these testshave a direct relationship to finished product quality.Wheat and flour specifications are communications between buyers and sellers.These specifications are requirements for particular wheat and flour characteristics. Tomeet these specifications, wheat and flour quality testing is necessary. Specifications formoisture content, ash content, protein content, and falling number are determined withbasic tests. Physical tests included in this book are conducted to determine flour colorand wheat kernel characteristics specified by wheat processors. The laboratory millingtest is used to evaluate the milling performance of wheat and to produce flour for otherlaboratory tests.Wheat and flour specifications often require specialized testing to determinehow flour will perform during processing. Several tests evaluate dough and gluten strengthproperties. The farinograph and mixograph tests measure the resistance of dough to mixing.The extensigraph test measures the resistance of dough to stretching. The alveograph testmeasures the resistance of a bubble of dough to expansion. The wet gluten test measuresthe amount of gluten protein in flour. The starch properties of flour are measured by theamylograph and the rapid visco analyzer tests.Section One is intended to provide information on wheat and flour quality testsused by the wheat industry worldwide to promote an orderly marketplace.
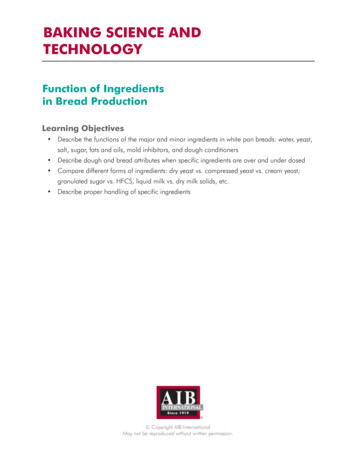
Moisture ContentFlora Engelmann, Laboratory Technician Low temperature heating Measures moisture content
MOISTURE CONTENT1. A small sample of flour or ground wheat (2–3 grams) is weighed andBasic TestsMethodplaced in a moisture dish.2. The sample is heated at 130o C in an air oven for 1 hour.3. The sample is cooled to room temperature and the residue is weighed.ResultsWhy is thisimportant? Moisture content is determined by heating a flour or ground wheatsample in an air oven and comparing the weight of the sample beforeand after heating. The amount of weight loss is the moisture content. Moisture content results are expressed as a percentage. An example of awheat moisture content is 12%.Determining moisture content is an essential first step in analyzing wheator flour quality since this data is used for other tests. Flour millers adjustthe moisture in wheat to a standard level before milling. Moisture contentof 14% is commonly used as a conversion factor for other tests in whichthe results are affected by moisture content.Moisture is also an indicator of grain storability. Wheat or flour withhigh moisture content (over 14.5%) attracts mold, bacteria, and insects,all of which cause deterioration during storage. Wheat or flour with lowmoisture content is more stable during storage.Moisture content can be an indicator of profitability in milling. Flouris sold by weight, grain is bought by weight, and water is added to reachthe standard moisture level before milling. The more water added, themore weight and profitability gained from the wheat. Wheat with toolow moisture, however, may require special equipment or processes beforemilling to reach the standard moisture level.Other methods of determining moisture content are used in theindustry. For example, Federal Grain Inspection Service (FGIS) usesthe GAC 2100 to measure moisture content of whole wheat kernels.Adapted from Method 44-15A, Approved Methods of the American Association of Cereal Chemists,10th Edition. 2000. The Association, St. Paul, MN.11
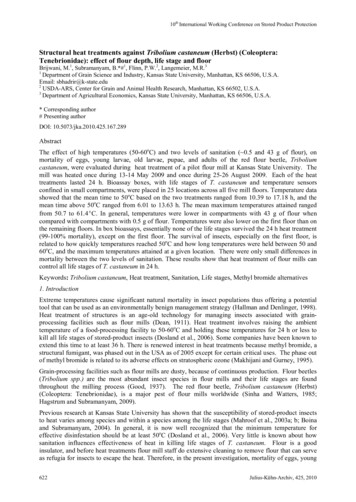
Ash ContentKevin Marquardt, Laboratory Technologist High temperature incineration Measures mineral (ash) content
ASH CONTENT1. A sample of flour or ground wheat (3–5 grams) is weighed and placedBasic TestsMethodin an ash cup.2. The sample is heated at 585 C in an ash oven until its weight is stable(usually overnight).3. The residue is cooled to room temperature and then weighed.ResultsWhy is thisimportant? Ash content is determined by high temperature incineration in anelectric muffle furnace. When a sample is incinerated in an ash oven, the high temperaturedrives out the moisture and burns away all the organic materials(starch, protein, and oil), leaving only the ash. The residue (ash) iscomposed of the non-combustible, inorganic minerals that areconcentrated in the bran layer. Ash content results for wheat or flour ash are expressed as a percentageof the initial sample weight; for example, wheat ash of 1.58% or flourash of 0.52%. Wheat or flour ash is usually expressed on a commonmoisture basis of 14%.The ash content in wheat and flour has significance for milling. Millersneed to know the overall mineral content of the wheat to achieve desiredor specified ash levels in flour. Since ash is primarily concentrated in thebran, ash content in flour is an indication of the yield that can be expectedduring milling. Ash content also indicates milling performance byindirectly revealing the amount of bran contamination in flour. Ashin flour can affect color, imparting a darker color to finished products.Some specialty products requiring particularly white flour call for lowash content while other products, such as whole wheat flour, havea high ash content.Adapted from Method 08-01, Approved Methods of the American Association of Cereal Chemists,10th Edition. 2000. The Association, St. Paul, MN.13
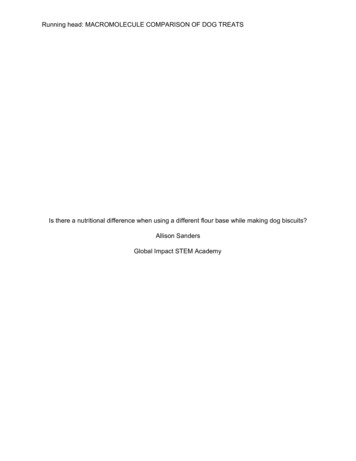
Protein ContentTina Tran, Laboratory Technologist High temperature combustion Measures protein content
PROTEIN CONTENTMethodBasic TestsCombustion Nitrogen Analyses (CNA) is one of several methods usedto determine protein content in flour or wheat.1. A sample of flour or ground wheat (0.15–0.20 grams) is weighedand placed into a CNA protein analyzer.2. This process is fully automated and begins by dropping the sampleinto a hot oven where it is burned at 952 C.3. The amount of nitrogen gas released during burning is measured anda formula is applied to convert this measurement to protein content inthe sample.ResultsWhy is thisimportant? Protein content is determined through high temperature combustionin a protein analyzer. Since protein is the major wheat compound thatcontains nitrogen, the protein content can be determined by measuringthe amount of nitrogen released during burning. Protein content results are expressed as a percentage of the total sampleweight; for example, 10% protein content on 12% moisture basis forwheat or 8.5% on 14% moisture basis for flour.Protein content is a key specification for wheat and flour purchasers sinceit is related to many processing properties, such as water absorption andgluten strength. Protein content can also be related to finished productattributes, such as texture and appearance. Low protein content isdesired for crisp or tender products, such as snacks or cakes. Highprotein content is desired for products with chewy texture, such as panbread and hearth bread.Bakers use protein content results to anticipate water absorptionand dough development time for processes and products, because higherprotein content usually requires more water and a longer mixing time toachieve optimum dough consistency.Combustion Nitrogen Analysis (CNA) is often used to developcalibrations for other protein methods, such as Near InfraredTransmittance (NIRT) or Near Infrared Reflectance (NIRR).Adapted from Method 46-30, Approved Methods of the American Association of Cereal Chemists,10th Edition. 2000. The Association, St. Paul, MN.15
Falling NumberKhari Holmes, Laboratory Technician Viscosity analysis Measures the effects of sprout damage
FALLING NUMBER1. A 7-gram sample of ground wheat or flour is weighed andBasic TestsMethodcombined with 25 ml of distilled water in a glass falling number tubewith a stirrer and shaken to form a slurry.2. As the slurry is heated in a boiling water bath at 100o C and stirredconstantly, the starch gelatinizes and forms a thick paste.3. The time it takes the stirrer to drop through the paste is recorded as thefalling number value.ResultsWhy is thisimportant? The falling number instrument analyzes viscosity by measuring theresistance of a flour and water paste to a falling stirrer. Falling number results are recorded as an index of enzyme activity in awheat or flour sample and the results are expressed in time as seconds. A high falling number (for example, above 300 seconds) indicatesminimal enzyme activity and sound quality wheat or flour. A low falling number (for example, below 250 seconds) indicatessubstantial enzyme activity and sprout-damaged wheat or flour.The level of enzyme activity measured by the Falling Number Test affectsproduct quality. Yeast in bread dough, for example, requires sugars todevelop properly and therefore needs some level of enzyme activity in thedough. Too much enzyme activity, however, means that too much sugarand too little starch are present. Since starch provides the supportingstructure of bread, too much activity results in sticky dough during processing and poor texture in the finished product. If the falling number istoo high, enzymes can be added to the flour in various ways to compensate. If the falling number is too low, enzymes cannot be removed from theflour or wheat, which results in a serious problem that makes theflour unusable.Adapted from Method 56-81B, Approved Methods of the American Association of Cereal Chemists,10th Edition. 2000. The Association, St. Paul, MN.17
Flour Color AnalysisMia Biberic, Student Intern Color analysis Measures flour color
F LO U R C O LO R A NA LYS I SMethodPhysical TestsOne method used to measure flour color is the Minolta Chroma Meter Test.1. A sample of flour is placed on the granular materials attachment andcompacted.2. The Minolta Chroma Meter is inserted into the granular materialsattachment.3. Measurements are taken and recorded.Results Flour color is determined by measuring the whiteness of a flour samplewith the Minolta Chroma Meter. Flour color results are reported in terms of 3-dimensional color valuesbased on the following rating scale: L* valuewhiteness100 white0 blacka* valuepositive valuesnegative values 60 red color–60 green colorb* valuepositive valuesnegative values 60 yellow color–60 blue colorThe color values of a typical white flour, for example, are:L* value 92.5 whitenessa* value –2.4 green colorb* value 6.9 yellow colorWhy is thisimportant?Flour color often affects the color of the finished product and is thereforeone of many flour specifications required by end-users. Generally speaking,a bright white color flour is more desirable for many products.Adapted from Minolta Chroma Meter CR-310 Instruction Manual, Minolta Camera Co., Ltd. 1991.19
Single Kernel Characterization SystemSKCSAnnette Doan, Laboratory Technologist Kernel analysis Measures kernel characteristics
S I N G L E K E R N E L C H A R A C T E R I Z A T I O N S Y S T E M (S K C S)1. A sample of wheat kernels (12–16 grams) is prepared byPhysical TestsMethodremoving broken kernels, weed seeds, and other foreign material.2. The sample is poured into the access hopper of the Single KernelCharacterization System instrument.3. The SKCS instrument analyzes 300 kernels individually and recordsthe results on a computer graph.ResultsWhy is thisimportant? Wheat kernel characteristics are analyzed for: kernel weight by load cell,kernel diameter and moisture content by electrical current, and kernelhardness by pressure force. Averages and standard deviations of these parameters are reported asSKCS results in terms of values: kernel weight is expressed in milligrams(mg); kernel diameter is expressed in millimeters (mm); moisturecontent is expressed as a percentage; and kernel hardness is expressedas an index of –20 to 120. A graph displaying kernel characteristics is shown on the computermonitor in the photo on page 20.The Single Kernel Characterization System Test evaluates wheat kerneltexture characteristics by measuring the weight, electrical current, andforce needed to crush the kernels. Kernel characteristics are related toimportant milling properties, such as conditioning (tempering), roll gapsettings, and flour starch damage content.Adapted from Method 55-31, Approved Methods of the American Association of Cereal Chemists,10th Edition. 2000. The Association, St. Paul, MN.21
Buhler Laboratory Flour MillKhari Holmes, Laboratory Technician Laboratory-scale flour mill Determines flour yield and makes flourfor other tests
B U H L E R L A B O R ATO RY F LO U R M I L L1. A sample of wheat is cleaned and the moisture content is determined.Milling TestMethod2. Water is added to condition (temper) the wheat overnight prior tomilling. Soft wheats require less water and less time than hard wheats.3. The tempered wheat sample is run through the mill the following day.4. The mill fractions, such as flour streams, bran, and shorts, are weighedand recorded.ResultsWhy is thisimportant? Wheat samples are milled to evaluate wheat milling properties, includingflour extraction and the amount of non-flour components produced,such as bran and shorts. Buhler Laboratory Flour Mill results are expressed as the weight of flour,bran, and shorts. Often, flour extraction is reported as a percentage offlour compared to the total output of other mill products. Flour is produced for other tests.The Buhler Laboratory Flour Mill Test indicates milling properties onsmall wheat samples. Commercial flour mills can use to this informationto adjust mill settings to adjust flour extraction. See “How Wheat isMilled” diagram on pages 24–25.Small samples of wheat are milled on the Buhler Laboratory Mill toproduce flour. This flour is used to evaluate properties, such as ash andprotein content, and in gluten strength tests, such as the farinograph.Adapted from Methods 26-21A, 26-30A, 26-31, 26-41, Approved Methods of the AmericanAssociation of Cereal Chemists, 10th Edition. 2000. The Association, St. Paul, MN.23
How Wheat is MilledIt starts here . . .MagneticSeparatorIron or steelarticles areremoved.BargeRailTruckThis flow diagramis greatly simplified.The sequence,number, andcomplexity ofoperations varyin different mills.ElevatorStorage andcare of wheat.ProductControlChemists inspectand classifywheat. Blendingis often done atthis point.SeparatorReciprocatingscreens removestones, sticks,and othercoarse or finematerials.Tempering BinsScourerBeaters in screencylinder scouroff impuritiesand roughage.TemperingWater toughensouter bran coatsfor easier separation, softeningor mellowingendosperm.BlendingTypes of wheat areblended to makespecific flours.AspiratorAir currentsremove lighterimpurities.Disc SeparatorBarley, oats,cockle, and otherforeign materialsare removed.24Washer-StonerHigh speed rotorscirculate wheat andwater. Stones areremoved.EntoleterImpact machinebreaks and removesunsound wheat.Grinding BinFirst BreakCorrugated rollsbreak wheat intocoarse particles.Courtesy of Wheat Foods Council, 10841 S. Crossroads Drive, Suite 105, Parker, Colorado 80138
SIMPLIFIED COMMERCIAL MILLING PROCESS DIAGRAMSifterMilling Processto a series of purifiers,reducing rolls, and sifters.PurifierBroken wheat issifted through successive screens ofincreasing fineness.ReducingRollsPurifierAir currents andsieves separate branand classify particles(or middlings).BranSifterBran and ShortsReducingRollsSmoothrollsreducemiddlingsinto flour.ShortsPurifierClear FlourSifterGerm RollsA series of purifiers,reducing rolls, andsifters repeat theprocess.SifterGermFLOURBleachingFlour ismaturedand colorisneutralized.Bulk StorageEnrichingThiamine,niacin,riboflavin,and ironare added.Patent FlourBulk DeliveriesTo bakeries . . .bytruckbyrail25
GlutomaticTina Tran, Laboratory Technologist Gluten washing Measures wet gluten content
G LU TO M AT I C1. A 10-gram sample of flour or ground wheat is weighed and placed intoWet Gluten TestMethodthe glutomatic washing chamber on top of the polyester screen.2. The sample is mixed and washed with a 2% salt solution for5 minutes.3. The wet gluten is removed from the washing chamber, placed in thecentrifuge holder, and centrifuged.4. The residue retained on top of the screen and through the screenis weighed.ResultsWhy is thisimportant? Wet gluten content is determined by washing the flour or ground wheatsample with a salt solution to remove the starch and other solubles fromthe sample. The residue remaining after washing is the wet gluten. During centrifugation, the gluten is forced through a sieve. The percentageof gluten remaining on the sieve is defined as the Gluten Index, whichis an indication of gluten strength. A high gluten index indicatesstrong gluten. Wet gluten content results are expressed as a percentage on a 14%moisture basis; for example, 35% for high protein, strong gluten wheator 23% for low protein, weak gluten wheat.The wet gluten test provides information on the quantity and estimatesthe quality of gluten in wheat or flour samples. Gluten is responsible forthe elasticity and extensibility characteristics of flour dough. Wet glutenreflects protein content and is a common flour specification required byend-users in the food industry.Adapted from Method 38-12A, Approved Methods of the American Association of Cereal Chemists,10th Edition. 2000. The Association, St. Paul, MN.27
Far inographFlora Carla Franzoni, Laboratory Technologist Recording dough mixer Measures flour water absorptionand dough strength
FARINOGRAPH1. A flour sample of 50 or 300 grams on a 14% moisture basis is weighedDough & Gluten Strength TestsMethodand placed into the corresponding farinograph mixing bowl.2. Water from a buret is added to the flour and mixed to form a dough.3. As the dough is mixed, the farinograph records a curve on graph paper.4. The amount of water added (absorption) affects the position of thecurve on the graph paper. Less water increases dough consistency andmo
The amount of weight loss is the moisture content. Moisture content results are expressed as a percentage.An example of a wheat moisture content is 12%. Determining moisture content is an essential fi