Transcription
2017 ASEE Zone II ConferenceAre Steam Tables Running Out Of Steam?Smitesh BakraniaRowan UniversityAbstractConsidering air and water are common power cycle working fluids, engineering thermodynamicscourses begin with an introduction to the ideal gas law and the steam tables. The ideal gas law isa relatively straightforward concept. On the other hand, students often struggle with the steamtables. Instead, many students prefer to use computerized resources to determine steamproperties. This paper highlights the deficiencies of both steam tables and popular computerizedresources in their ability to reinforce the thermodynamics concepts. Thermodynamic propertiesare inter-related and therefore supplying state property values without emphasizing theirrelationships holds limited value from a student learning perspective. This paper recommends theuse of property diagrams instead. Thermodynamic property diagrams are relatively simple to use,and more importantly, enable students to visualize the property relationships.KeywordsThermodynamics, Properties of Water, Steam Tables, Property Diagrams, Property Charts.IntroductionSteam tables have been integral part of engineering thermodynamics since over a century. Thesetables of thermodynamic properties of water are used to study the ubiquitous Rankine powergeneration cycle. Almost all thermodynamics textbooks dedicate several pages of theirappendices to the tabulated steam thermodynamic properties, conventionally separated byphases. The tables were originally developed to provide accurate steam property values to anytrained engineer working in power generation industry. It is common practice for instructors toimpart this traditionally valued skill to future engineers. The retrieval procedure begins withidentifying the phase of water (namely, compressed liquid, saturated or superheated states) andmay ultimately involve the need to interpolate to calculate the intermediate property values.Presently, the associated complexities and the easy access to numerous digital (computer oronline) alternatives have made abandoning the traditional steam tables remarkably appealing.Several software-, online- and mobile-based tools exist to promptly deliver desired stateproperties.1-7 Unlike steam tables, given two thermodynamic state properties, the rest of theproperties can be quickly determined without the need to identify the phase or the need tointerpolate. Here, we inherently recognize the inability of the digital database to reinforcefundamental thermodynamics concepts. However, this deficiency also exists with use oftabulated steam properties.Both steam tables and the common digital resources supply state property values withoutreinforcing how the properties are related to each other. Emphasis is placed on the absoluteproperty values rather than property relations. Without explicitly investigating the propertytrends, students using either tool fail to recognize how one property changes in response to the American Society for Engineering Education, 2017
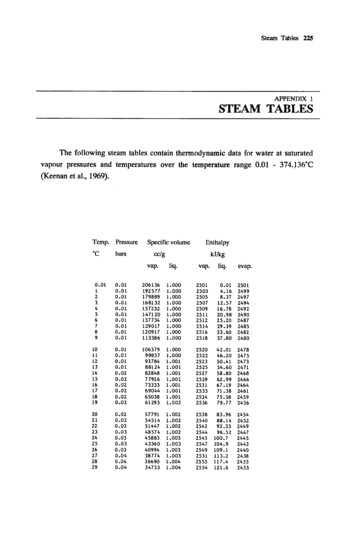
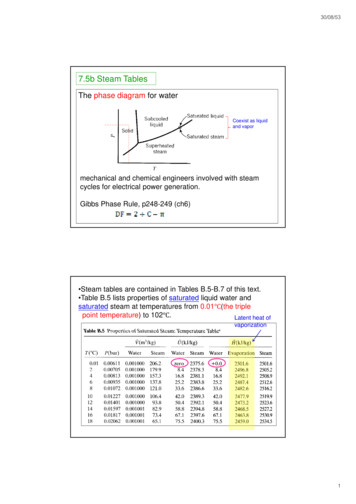
2017 ASEE Zone II Conferenceother. The knowledge of property relationships is more fundamental than the numeric value. Infact, it is common practice to sketch the states and processes on temperature versus entropy (T-s)diagrams to visualize the thermodynamics problems. Here, isentropic, isobaric, isothermal, etc.,processes can be easily depicted to aid the analysis. Beyond simply visualizing the constantproperty processes, studying the relative changes in the subsequent state properties can providemeaningful insights into the processes themselves. Additionally, students may find it difficult todepict a constant specific volume v or constant density ρ process on a T-s diagram with the steamtables as the primary source for properties.To emphasize property relations while eliminating the complexities associated with the use ofsteam tables, this paper advocates the use of detailed property diagrams to study thermodynamicprocesses. Property diagrams are powerful visual tools to retrieve property values. At the sametime they afford deliberate emphasis on property relationships. If existing computationalalternatives are integrated with property diagrams, there is evidence to suggest a positive impacton student learning as far as property trends are concerned.8 The paper provides instructionalguidelines to eliminate steam tables and emphasize property relations using property diagrams.The paper also discusses tools that can be used to harness the power of property visualization.Overall, steam tables have lost their relevance in modern engineering education. However thereis a need to ensure the replacements to the steam tables reinforce the thermodynamics conceptswhile simplifying the process of retrieving property values.BackgroundThermodynamic Property DiagramsProperty diagrams of steam have likely existed as long as the steam tables have. They are simplythe visual depiction of the property data. Property diagrams plot six the commonly used steamthermodynamic properties, namely, Pressure P, Temperature T, Specific Volume v, SpecificInternal Energy u, Specific Enthalpy h, and Specific Entropy s on a two-dimensional graph. Themost common of these is a T-s diagram that maps isobars and constant enthalpy lines. See Figure1 for an example of the T-s diagram. Property diagrams are extremely useful to visualize phasechange, and therefore T-v diagrams are regularly used to introduce the water properties. Students,quickly learn the constant property lines to visualize various processes they encounter especially considering their previous exposure to the ideal gas processes on P-v-T space.However, due to the accuracy afforded by steam tables in practice, property diagrams are oftenrelegated as a useful analytical aide when solving thermodynamic problems with steam.On the Utility of Steam TablesOnce students are introduced to the overall property relations using property diagrams, they aretaught how to retrieve the numeric property values from the steam tables. The steam tables areorganized by phases (and the superheated region further separated by pressures) and onlydiscrete values can be provided to limit total textbook pages dedicated to properties. Theretrieval procedure can be complex and cumbersome. Besides their use during testing, studentsrely on online tools to confirm or to swiftly acquire their state values. Considering the additionaltime required teaching steam tables and for the students to develop comfort, when they can easilyacquire values from online resources, what function do steam tables currently serve? The ability American Society for Engineering Education, 2017
2017 ASEE Zone II Conferenceto use the steam table was critical when digital resources were not ubiquitous, as they are today.If the steam tables serve the function of delivering state property values, then the digitalalternatives are more than adequate to rapidly and accurately supply property values.Figure 1. A Temperature-Entropy (T-s) diagram with red constant enthalpy h lines, greenconstant density ρ lines, and black constant pressure P lines (isobars). Note: the figure uses tinstead of T for temperature. Created by Kaboldy for Wikipedia.org.Replacing the Steam TablesThe use of steam tables has lost its relevance in modern engineering pedagogy and practice. Withaccess to online information widely expanded by mobile devices, it is time to part with the steamtables. Rather than simply replacing steam tables with digital resources, it is valuable to extendthe utility of thermodynamic property diagrams, with which the students are already familiar. Adetailed thermodynamic property diagram that fits on a single printed page can supply the sixcommonly used thermodynamic properties with a reasonable precision to solve most of thefundamental engineering thermodynamics problems. Detailed T-s or P-h diagrams are readilyavailable online and in several textbooks for offline usage. Students can print copies for useduring problem solving and testing. Most importantly, with the use of property diagrams studentsvisually reinforce their understanding of property relationships while retrieving property values.In essence, combining the visualization of thermodynamic processes and property value retrievalinto a single intuitive step eliminates the need to master the arguably obsolete steam tables.Instead, teaching property diagrams requires significantly less time compared to the steam tables.Furthermore, the property retrieval procedure becomes a natural extension of the introduction tophase change in pure substances. American Society for Engineering Education, 2017
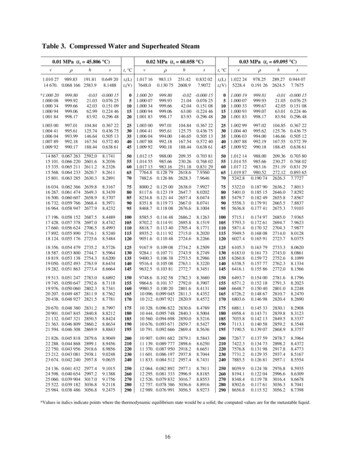
2017 ASEE Zone II ConferenceAmong the several advantages of using property diagrams over steam tables, the key benefits canbe summarized as: A full range of steam properties can be supplied on a single pageReduced instruction time devoted to teaching the steam tablesStudents become inherently aware of property trends and relationshipsProvide accurate visualization of thermodynamic processes and cyclesLess emphasis on precision of property values and more on trendsPhases are self-evident with known state valuesHowever, the replacement of steam tables presents a challenge to the textbook-driven traditionalinstruction because textbooks continue to rely on steam tables. Therefore, an alternate method ofinstruction was developed and implemented in an existing course.Instruction and ImplementationPhase change in pure substances is covered in the first few weeks of thermodynamics course.The topic is typically devoted a week of lectures that naturally transition from an advancedtreatment of ideal gas laws where entropy s is briefly introduced as yet another thermodynamicproperty. Students may not understand entropy s as a concept but are made aware that itcorresponds to the second law of thermodynamics. Steam properties are introduced using anatmospheric pressure example of water undergoing phase change (boiling at 100 oC) on a T-vdiagram (see Figure 2(a)).Figure 2. (a) T-v diagram depicting isobars used to demonstrate phase change of water fromatmospheric conditions and (b) T-s diagram with the same isobars to highlight the similaritiesbetween the two diagrams and introduce entropy s as a ‘yet another thermodynamic property’.Upon describing the liquid-vapor mixture region, also known as vapor dome, the critical pointand the superheated regions, in the past the students were taught how to obtain the variousproperties from the steam tables using the textbook appendices. Instead, this time students wereshown a T-s diagram, which happens to map well to a T-v diagram. Using a diagram, such as theone presented in Fig. 2(b), similarities are identified and students are again reminded of entropy s American Society for Engineering Education, 2017
2017 ASEE Zone II Conferenceas a property they will use at a later stage when discussing efficiencies of processes. For now, thestudents are asked to focus on the known thermodynamic properties of P and T.Next, a detailed T-s diagram with isobars, constant density and constant enthalpy lines ispresented from the Cengal, et al., Property Tables Booklet (similar to the one presented in Fig. 1but with density numeric values provided). Using the T-s diagram, the concept of mixture qualityx is described. It is critical to reinforce that every point on the T-s diagram represents athermodynamic state with defined thermodynamic property values (P, T, h, ρ, s, and x).Considering the presentation of specific T-s diagram, students are reminded enthalpy representsthe combination of internal energy u and flow work P/ρ (where ρ 1/v). In other words,problems involving internal energy u will require subtracting the flow work term from enthalpy.This is a useful exercise to remind students how enthalpy h differs from internal energy u.Students need to be taught the process of reading constant density ρ lines that are separatedlogarithmically in this particular presentation of the T-s diagram.Example problems involving steam properties are presented next. Example problems are used tohelp students practice property retrieval and emphasize property trends. For instance, the T-sdiagram is used to highlight ideal gas behavior of steam to the far right of the vapor dome byobserving that the constant enthalpy h lines are effectively a function of temperature (sincesuperheated enthalpy lines are effectively horizontal on a T-s diagram, see Fig. 1). Usingexamples, students are shown how precision of steam property values minimally impactcalculation of thermodynamic terms. For the Fall 2016 term, students were also asked tocompare values obtained from the T-s diagram versus the steam table values. Students wereasked to use the T-s diagram to complete the homework assignment and recognize that thenumeric answers to the problems may not match the textbook solutions due to imprecise readingof the diagram, which was acceptable.Supplementary MaterialsHandouts consisting of a single page of a detailed T-s diagram were shared with the students touse during homework assignments and quizzes. For quizzes, students were only allowed to usethe T-s diagram to solve steam-related problems. Additionally, to further familiarize studentswith the T-s diagram a T-shirt depicting the detailed diagram was designed for each student.Figure 3 provides a photograph of students with T-s diagram T-shirts. Students were alsointroduced to the Clausius mobile application; an app designed and developed by the author forthe Apple iPad.9 Clausius uses T-s, P-h and P-v diagram to supply thermodynamic properties asthe users glide their fingers across the property diagram.10 The app was also useful todemonstrate how properties evolve in real-time along a constant property line. Since Clausiusserves as an analog to the printed property diagrams, students were encouraged to use the app forhomework assignments but were limited to the printed version for quizzes. In a separate researchstudy, the use of Clausius app has been shown to positively impact students’ grasp of propertytrends in thermodynamics.8 American Society for Engineering Education, 2017
2017 ASEE Zone II ConferenceFigure 3. Students and instructor from the Thermal-Fluid Science I section wearing customdesigned T-s diagram T-shirt.Outcomes and ConclusionBeyond the inherent benefits of eliminating the cumbersome steam tables, there were severaladvantages that were observed as a result of adopting property diagrams. Despite being instructorobservations, as opposed to outcomes from a formal study, the following provide critical insightsinto the implementation. Developing Comfort. Majority of the students quickly mastered the property retrievalprocedure, as opposed to the time required to master the use of steam tables.Engaging with the Material. Students often used multiple copies of the propertydiagram to solve individual problem so that they can mark and visualize thethermodynamic states directly on the T-s diagram.Efficiency. Students used less time to retrieve thermodynamic property values whilesolving problems when compared to the use of steam tables (especially if interpolationwas involved).Visual Aide. Students were able to easily visualize constant density ρ, constant enthalpyh, and constant quality x processes directly on the T-s diagram. These processes areparticularly difficult to visualize using steam tables.Precision. Initially, few students struggled with the imprecise nature of numeric solutionsand checked their answers using the steam tables for accuracy. Once they werecomfortable with this concept, the students used the T-s diagram exclusively.Overall, the introduction of property diagrams as the primary source of water thermodynamicproperties presented a notable advantage over the use of steam tables. Apart from practicalbenefits of the implementation, students became visually aware of property trends with the use ofproperty diagrams. It is anticipated that the use of property diagrams will further facilitate theanalysis of thermodynamic cycles involving phase change, namely, the Rankine Cycle and theVapor-Compression Cycle. In conclusion, the exercise demonstrated property diagrams assuperior replacements for traditional steam tables. American Society for Engineering Education, 2017
2017 ASEE Zone II ConferenceAcknowledgementsThe author likes to acknowledge Dr. Krishan Bhatia from the Rowan University MechanicalEngineering Department who pioneered the replacement of steam tables with property diagramsin thermodynamics courses. The Clausius app was co-developed with Rowan University studentAustin Carrig who continues to add new functionalities to the app.References1.2.3.4.5.6.7.8.9.10.Lai, F. C., & Ngo, C. C. (2002, June), “Web Based Thermodynamics Wizard” 2002 ASEE AnnualConference,Montreal, Canada. https://peer.asee.org/10540NIST, Thermophysical Properties of Fluid Systems, nal Steam Tables IAPWS-IF97 app, mtables/id502937992?mt 8Steam Tables app, 948012?mt 8StateCalc app, 148?mt 8PureFluids, 2933?mt 12Engineering Equation Solver (EES), http://www.fchart.com/ees/Bakrania, S.D., and Carrig, A., “Touching Water: Exploring Thermodynamic Properties with ClausiusApp,” American Society of Engineering Education Conference, New Orleans, LA June 26-29, 2016.Clausius app, 133?mt 8Clausius Introduction Video on YouTube.com, https://youtu.be/U34Dn5NZacASmitesh BakraniaDr. Smitesh Bakrania is an associate professor in Mechanical Engineering at Rowan University.He received his Ph.D. from University of Michigan in 2008 and his B.S. from Union College in2003. His research interests include combustion synthesis of nanoparticles and combustioncatalysis using nanoparticles. He teaches thermal-fluid sciences, combustion, andnanotechnology courses. He is also involved in developing educational apps for instructional andresearch purposes. American Society for Engineering Education, 2017
Replacing the Steam Tables The use of steam tables has lost its relevance in modern engineering pedagogy and practice. With access to online information widely expanded by mobile devices, it is time to part with the steam tables. Rather than simply replacing steam tables with digital resources, it is valuable to extend