Transcription
https://stock-screener.orgDisclaimerThe information provided is not to be considered as a recommendation tobuy certain stocks and is provided solely as an information resource to helptraders make their own decisions. Past performance is no guarantee offuture success. It is important to note that no system or methodology hasever been developed that can guarantee profits or ensure freedom fromlosses. No representation or implication is being made that using this eBookwill provide information that guarantees profits or ensures freedom from losses.Copyright 2009-2019. All rights reserved. No part of this book may bereproduced or transmitted in any form or by any means, electronic ormechanical, without written prior permission from the author.
What is swing trading?Swing trading is a short term trading method used for trading a variety of investments,such as stocks, bonds, commodities, options, and currencies. Unlike day trading wherepositions typically last only one day, swing trading positions usually range from two tofive days, but can last as long as two or three weeks. Swing traders use technical analysisand disregard fundamental analysis. They aren’t interested in the intrinsic value of stocks,but rather they look for stocks with short-term momentum that can allow them to capturegains in just a few days.Introducing Technical AnalysisTechnical analysis is the study of past market data, through the use of charts, to predict asecurity’s future price. Unlike fundamental analysis, technical analysis does not focus onstudying a company’s financial statements and earnings to determine a company’sintrinsic value, or its actual worth. Instead, technical analysts use charts and technicalindicators to identify patterns that can suggest future price movements. They disregardthe underlying data that causes the price movements and focus on what the market isvaluing the stock at.The charts themselves do not cause market action, but rather, they indicate the actions ofthe marketplace and what has already happened. Charts reflect trades by all marketparticipants, such as buyers, sellers, and even insiders. Analyzing charts means that youare analyzing the behavior of all these traders. Each price on the charts reflects theactions or lack of actions by all the traders in the market.Find Trending Stocks @ www.stock-screener.org2
Technical analysis can be applied to any security with historical trading data. Thisincludes stocks, futures and commodities, fixed-income insecurities, forex and more.Although we will usually analyze stocks in our examples, keep in mind that theseconcepts can also be used on other types of securities.For further clarifications, see how technical analysis is different from fundamentalanalysis.Technical Analysis AssumptionIn author Tony Plummer’s book, The Psychology of Technical Analysis, he paraphrases aquote by Oscar Wilde by stating, “A technical analyst knows the price of everything, butthe value of nothing.” Technicians are more concerned with the “what” rather than the“why.”The study of technical analysis is based on three main assumptions:1) The market discounts everything.2) Prices move in trends.3) History tends to repeats itself.1) The market discounts everythingTechnical analysis is based on the Dow Theory that the market discounts everything andthat all past, current, and even future information, is reflected in the security’s price. Thisinformation includes fundamental factors, psychological factors, and any recent newsabout the company.Find Trending Stocks @ www.stock-screener.org3
Technicians believe that if everything is already reflected in the market price, then it isonly necessary to study price charts. They believe that by studying price charts, you areindirectly studying the fundamentals of a company, as well as the psychology of themarketplace for that company. For example, if prices are going up, they assume thatdemand must be exceeding supply, indicating that the fundamentals are bullish. If pricesare falling, they assume that supply must be exceeding demand, indicating that thefundamentals are bearish.Since the market discounts everything, technicians ignore the factors that cause pricemovements and exclusively study price history and volume data.2) Prices Move in TrendsTechnicians believe that prices are not always random and tend to follow trends, such asan uptrend or downtrend. Most technical trading strategies are based on the assumptionthat once a trend has been established, the future price movement is more likely to be inthe same direction as the trend than to be against it. Since technical analysis can beapplied to many different time frames, it is possible to identify both short-term and longterm trends.3) History tends to repeat itselfA study of history shows that set patterns tend to repeat themselves over long periods.The repetitive nature of price movements is attributed to market psychology, meaningtraders tend to have a consistent reaction to similar market stimuli over time. SinceFind Trending Stocks @ www.stock-screener.org4
investor behavior repeats itself so often, technicians believe that predictable price patternswill develop on charts.By relying on price patterns, we can identify optimal trade entry and exit points.Recognizing trends in their early stages allows us to trade favorably in the direction ofthose trends until it shows signs of reversing.How to Read Stock ChartsOne glance at a stock chart might seem daunting. However, once you learn how to readstock charts, you will find it to be second nature. The nice thing about stock charts isyou don’t need a finance degree to analyze it. With enough practice, you will be able tounderstand it easily so that you can use it to making your trading decisions.A price chart is a series of prices plotted over a specific time period. There are manydifferent types of stock charts, such as bar, line, OHLC (open-high-lowclose), candlestick, point-and-figure and more. They can all be viewed in different timeframes, whether it’s intraday, daily, weekly or monthly. Each type of stock chart displaysvarious kinds of information and has its own advantages and disadvantages, but they allreveal valuable price and volume information.A stock chart looks like a regular graph, where the price is plotted on the y-axis, orvertical axis, and the time is plotted on the x-axis, or horizontal axis.Find Trending Stocks @ www.stock-screener.org5
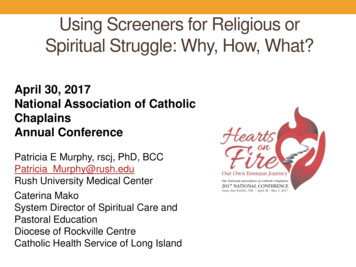
Types of Stock ChartsBelow are the most popular stock charts:Bar ChartFind Trending Stocks @ www.stock-screener.org6
One of the most popular charting methods is the OHLC chart, where the high, low, closeand open prices are needed to form each price bar. The length of each vertical bar showsa stock’s trading range for that time period. The top of the bar shows the highest price thestock was purchased for during that period, and the bottom of the bar shows the lowestprice the stock was purchased for. A short horizontal line to the right side shows theclosing price while a line to the left side shows the opening price.It is also important to know the stock chart’s time frame and the time that each price barrepresents. On a daily stock chart, each price bar represents the high, low, open, and closeprices of the security during that day. On a monthly chart, each price bar represents theprices the security traded during that month.Find Trending Stocks @ www.stock-screener.org7
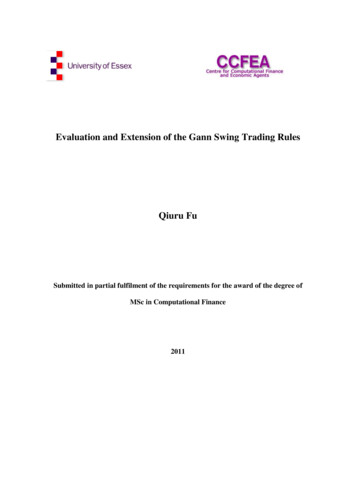
Line ChartLine charts only show only the close of the day and do not show the open, high, and thelow data points. Some traders think that the closing price is the most important. Line chartsshow less clutter, however they do not provide as much detail as the other charts.Candlestick ChartsFind Trending Stocks @ www.stock-screener.org8
Candlestick charts show the open, high, low, and close prices. Many traders like this typeof chart because its contrasting colors provide fast visual interpretations. The open andclose prices are represented by horizontal lines and they form a box, called the body.White candles form when the close price is higher than the open price and black candlesform when the open price is higher than the close price. The lines extending from thebody are called shadows and represent the high and low. Here are the 10 most popularcandlestick patterns.Find Trending Stocks @ www.stock-screener.org9
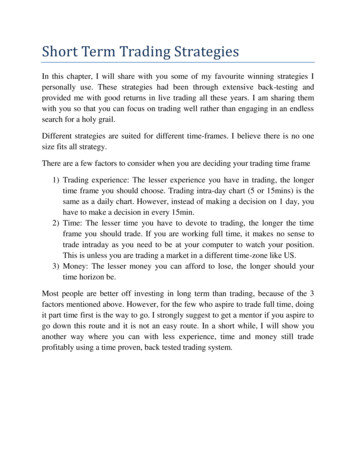
Stock Chart AnalysisWhen you look at a stock chart, there are several questions that you should ask yourself.First, identify whether the stock is an uptrend or downtrend. If a stock is heading upwardstoward the right corner of the chart, then the stock is in an uptrend. Likewise, if the stockis heading downwards, then the stock is in a downtrend.Next, identify if there is a level of support or resistance. A support level is when thestock cannot drop past a certain price level and a resistance level is when the stock cannotbreak through a certain price level. The below chart shows Apple’s stock trading in atrading channel, which is the space between an asset’s support and resistance levels. Theprice stays within these levels until a breakout occurs.Find Trending Stocks @ www.stock-screener.org10
Find Trending Stocks @ www.stock-screener.org11
The vertical lines at the bottom of stock charts show the stock’s volume, or the numberof shares traded during the specific time frame of the chart. A trading signal with highvolume enhances that signal. For example, the stock finally broke out through thatresistance level on February 1 on high volume. This high volume means that the buyinginterest is strong and that an uptrend is likely to occur. As you can see, the price istrended upwards toward the right corner of the chart for the next two months.Some traders might make multiple trades when a stock is in a trading channel, buyingwhen the price gets to the bottom of the channel and selling when the prices gets close tothe top of the channel. This trading strategy is known as range-bound trading. Byfinding major support and resistance levels, traders can make profits on the price spread.They repeat this process of buying at support and selling at resistance until the stockbreaks out from the channel.Why do we study stock charts?Technical analysts, or technicians, study stock charts to analyze price information andforecast future price movements. Knowing how to read a stock chart is a greatadvantage because they provide an easy-to-read illustration of a security’s pricemovement over a specific time frame and can help you make better trading decisions. It isalso essential for those interested in swing trading.Find Trending Stocks @ www.stock-screener.org12
Swing Trading StrategiesOne of the main appeals of swing trading is being able to capture significant gains inless than a week, and without having it to be a full-time job. Of course, you must stillwork hard to find these short-term opportunities to take advantage of. It is helpful tounderstand some of the swing trading strategies that successful traders use and it isimportant that you have a set of your own trading strategies.First, let’s briefly go over the definition of swing trading.Swing Trading MethodsMarkets often go nowhere. They usually rally a few days, decline a few days, pause andthen rally again. Small swings in the markets are common and it is our interest to captureprofits from these small swings.Most of the swing trading strategies involve studying chart patterns to find trade entryand exit points. These strategies differ and there isn’t any one “right” strategy. Everytrader has his or her own preferred methods and strategies. Study and apply thesestrategies to different charts and see which ones work best for you. You can also havemore than one strategy.Find Trending Stocks @ www.stock-screener.org13
1. Trend Following StrategyMost swing traders assume the “Trend is your friend.” Trend following is the mostpopular type of swing trading strategy where you find a trending stock and trade alongits trend. This strategy is used by both long-term investors and short-term traders. For thepurpose of swing trading, the trend following strategy is used to spot patterns and trendsthat happen over a short period of time. For example, if the security is in an uptrend, theswing trader will be bullish and go long on the security by buying shares or call options.The trader plans to hold the security short-term and sell when he or she sees signs ofreversals. Likewise, if the overall trend is down, then the trader will be bearish and canshort shares or buy put options.Drawing Trend LinesIt is helpful to know how to draw trend lines on a stock chart. A trend line is a straightline that connects at least two price points and acts as a line of support or resistance. Anuptrend line has a positive slope and is formed by drawing the trend line along the lowestpoints in the trend without letting the line cross through prices. The second low pointmust be higher than the first low point in order to have a positive slope. A downtrend linehas a negative slope and is formed by drawing the trend line along the highest points inthe trend without letting the line cross through prices. The second high pointmust be lower than the first high point in order to have a negative slope.Find Trending Stocks @ www.stock-screener.org14
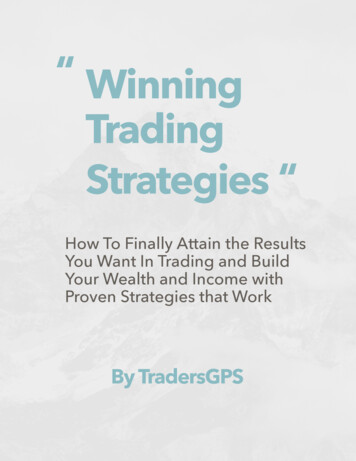
You can apply trend lines to find securities with channel patterns. Channel patterns serveas a trading range and consist of two parallel trend lines, where the lower trend line actsas support and the upper trend line acts as resistance.Trend Following Entry and Exit PointsSwing traders normally enter the market after the trend has established itself, betting thatthe trend will continue. Below is an example of a trade that I executed. The first greenarrow is where I entered the trade. Microsoft was one of the stocks that I was watchingand I saw that the uptrend validated itself, as indicated by the third orange circle. Itypically wait for at least three to four points to hit my trend line to confirm the trend’svalidity before I make any action. As the price bounced up from the third circle, I boughtshares. About a week later, the stock hit my target price and I got out.Find Trending Stocks @ www.stock-screener.org15
How to Trade Channel PatternsThe strategy of trading channel patterns is to identify valid trends and trade in thedirection of the trend. When the price touches the support trend line, or the lower trendline, of an ascending channel, a buy trade is signaled. When the price touches theresistance trend line, or the upper trend line, a short trade is signaled. It is also importantto pay attention to the volume of the stock. If the stock breaks support with high volume,it is a greater indication that the trend is broken. However, if the stock breaks supportwith low volume, it is okay to hold a little longer since it could be a false breakout. If youchoose to hold a little longer, make sure you have a stop loss.2. Breakout Trading StrategyBesides entering a trade in a channel pattern, you can also enter a trade when a breakoutoccurs from the channel. A breakout is when the price closes above or below theboundaries of the pattern.The below chart of Amazon stock shows a breakout from the uptrend. The increase involume also signifies that the uptrend is broken and a downtrend might be imminent.Swing traders may see this as an opportunity to short this stock.Find Trending Stocks @ www.stock-screener.org16
A breakout doesn’t necessarily have to occur from an uptrend or downtrend pattern. Forexample, if a stock goes up and down in the 10- 15 range for a long time and then itbreaks out from this range on high volume, it also signifies a breakout. Breakouts are alsoopportunities that I watch out for. However, you need to be careful of false breakouts. Ifthe volume is weak, the price breakout might only be temporary and can pull back intothat range.3. Japanese Candlestick ChartingThe Japanese candlestick is a popular charting technique used for short-term outlooks.Candlestick charts displays the opening, close, high, and low prices for a security eachday. Many traders find candlestick charts easier to look and more useful than traditionalbar charts because it reveals more about a stock’s price action. The shape and color ofcandlesticks help traders gauge the emotions around a stock by showing us if there ismore buying (greed) than selling (fear). There are many candlestick patterns and it isimportant to understand what is happening in each pattern. Japanese candlesticks are aFind Trending Stocks @ www.stock-screener.org17
way of looking at prices and should be used with other technical indicators for them tobe useful.Bullish candlestick patterns – The below are examples of candlestick reversalpatterns signaling a chance of a rally. For any of these patterns to signal a rallymeans that there must have been a preceding downtrend.Bearish candlestick patterns – The below are examples of candlestick reversal patternssignaling a pullback. For any of these patterns to signal a sell means that there musthave been a preceding uptrend.These are a few of the popular swing trading strategies. It is important to usemultiple indicators and not trade on any one technical concept in isolation. There isFind Trending Stocks @ www.stock-screener.org18
a higher chance for a profitable trade if many technical tools are signaling the samemessage. Regardless of the strategy and the technical indicators you use, youshould always enter a trade with a clear trading plan. This means you should have atarget price and a stop loss. Through analysis and experience, you can determinewhich swing trading strategies work best for you.Signup Up FreeSignup free to use our advanced stock screener, get stock trading tips and ideas. Becomea better and more profitable trader today.Find Trending Stocks @ www.stock-screener.org19
Swing trading is a short term trading method used for trading a variety of investments, such as stocks, bonds, commodities, options, and currencies. Unlike day trading where positions typically last only one day, swing trading positions usually range from two to five days, but can last as long as two or three weeks. Swing traders use technical .