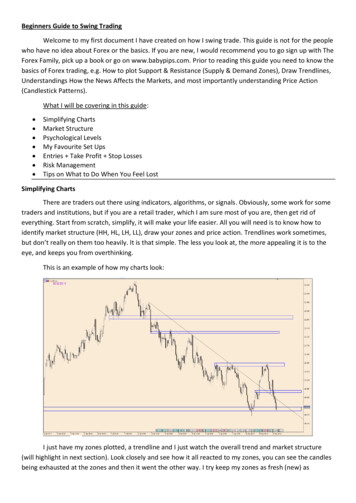
Transcription
How to Swing Trade Likea MillionaireA Beginner’s Guide to Strategies,Tools, Trade Management, RiskManagement and Learning TheMarket. Carter FarrStock Trader at MVP-INVESTORShttps://mvp-investor.com
1Disclaimer:MVP-INVESTOR, including its employees,shareholders and affiliates, is NOT an investmentadvisory service or a registered investment advisor orbroker-dealer. Our team has been stock trading formany years and has created this book to helpbeginner swing traders get into the markets witheducation. Stock trading has risk.The company, theauthors, publisher has no responsibility for the tradingand investing results. Reader should not rely on theinformation in the book to stock trade because it takespractice and time to understand the stock market.These indicators and the products, techniques andstrategies should be for educational purposes only.
2Welcome Swing TraderDoes this describe you?I work a full-time job and I don’t have time to activelycheck the stock market but I want to invest money? Iwant to make an extra 200 per week with the stockmarket? I understand how swing trading works but Ican't seem to make money consistently?The most important feature we teach our swingtraders is the ability to read and understand the stockmarket.People Who Benefit from Swing Trading People who have full-time jobs People who don't have time to actively tradeand watch the stock market Anyone who wants to make money in the stockmarket People who want their money to work for theminstead of them working for money
3Swing Trading CourseIntroduction4Understanding Swing TradingWhy Traders Fail?56Technical AnalysisCandlestick Charts811Finding The Right Stocks23Strategies28Market Environments32Trade ManagementAveraging Down3942Risk ManagementRisk Rules4345Tools and PlatformsWhat Broker and Scanner?4647Account Types52Carters Rules to Be Successful55Final Words57Swing Trading Terminology60
4IntroductionSwing trading attempts to capture gains in a stock byholding it overnight or holding for several weeks.Swing traders use technical analysis to look for stockswith short-term price momentum. These traders mayutilize fundamental or intrinsic value of stocks inaddition to analyzing the price trends and patterns.The Swing Traders Who Fail: Don’t understand risk Uneducated Repeat failures Don’t understand that somes days are red butoverall the outcome is green Don’t “Gamble your money” Practice with fake money Before you trade realmoney“Don’t Wait Make it Happen”-Carter Farr
5Understanding Swing TradingAs Swing Traders we are going to focus on simplesetups and nothing confusing. We are going to put itin terms that anyone, any age will understand. We willlearn basic strategies like the Support Bounce andmany others.Are Team at MVP-Investors have traded for years,and we have came up with the best strategies that willsave money and help make a lot more profits.As swing traders we have one goal is to get in andout.Swing Trading accounts on average can profit about10% per week. With a 1,000 account you wouldprofit around 100.This type of trading is to identify the trend of themarket and then capture the gains of the market.Trends are easy to identify and we will talk moreabout them in Chapter 2.
6Why Traders Fail?With any type of investing and trading, it takespractice, a lot of hard work and a custom strategy thatfits your needs (Chapter 3). Here the three mainreasons I have found that swing traders fail.Don’t Understand RiskBalancing risk is the most important part of any longor short-term investments. When you invest you haveto ask, “how much upside and downside risk shouldbe accepted”.The ideal situation would be asymmetric risk rewardmeaning you risk .06 to make a 1. An investorwould invest 16 times before you lose money.What you don’t want to invest in is an investmentwhere the profit is less than the maximum loss.
7UneducatedOther than practice the most important thing swingtraders can do is learn. Many swing traders fail or giveup because they don't understand why they are losingmoney. Those types of traders may catch somestocks over the long term, but soon the stock marketalways beats uneducated traders.Repeat FailuresThe second worst thing, other than gambling, a tradercan do is repeat failures. This would include swingtrading downward trend markets, unsure strategy andmore. Any time a swing trader loses money they havefailed. What a smart trader would do is look back attheir trades and understand what they did right andmost importantly, what they did wrong.
8Technical AnalysisTechnical Analysis, in contrast to fundamentalanalysis , does not focus on the fundamental metricsof a company, but instead, focuses solely on the priceof the stock. Technical analysis requires a complexunderstanding of chart patterns and technicalindicators . This is the type of trading most daytraders and swing traders will practice.Now to swing trade successfully you have to look atstock charts. There are three main types of charts thatyou will learn to understand. Pick one that you feelmore comfortable with and become a expert with thatchart.
9Line ChartsLine charts are the most simple type of chart. Thesecharts simply plot a line. This can give a goodunderstanding of price action over long periods oftime, but for shorter time periods it doesn’t providenecessary insight that traders require. Line charts areperfect for long term traders that want to find thetrends of the stock.
10Bar ChartsLike Line Carts, bar charts provide very littleinformation that active trades will want. They show theopen price and the close price for any given period,but that’s it. If the chart is a daily chart you will seethat each bar represents a single day in time.
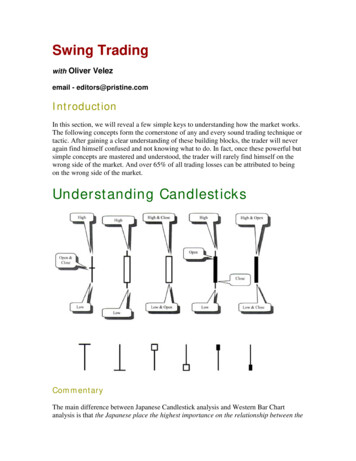
11Candlestick ChartsCandlestick charts are what most active day traderswill use to help them establish a basis for taking atrade. A candle stick includes 4 pieces of information.The open price, the close price, the high of the periodprice, an the low of the period price. When these 4pieces of information come together, candlesticks cantake shapesthatcommunicatemarketsentiment. Forinstance, acandle that opened at 10.00, had a high of 10.50,closed at 9.90, and had a low of 9.90, will appear veryweak or bearish. The stock spiked up but was unableto hold those levels and sold off. A simple line chart or
12bar chart would have not been able to communicatethe same meaning to us.Within the candlestick charts there are key pieces ofinformation that you should understand:Doji CandlesticksA doji candlestick has a long upper wick or lowerwick. The wick refers to the high or low of day. Thebody of a doji issmaller than thecandle wick, meaningthe open and closeprice were fairly closetogether. This candles are considered candles ofindecision.
13Hammer CandleA hammer candle occurs atthe bottom of a long down trend and looks like ahammer. It has a long lower wick (like a doji), thatforms the handle. The small body on the top is thehammer that swings down. This is considered a stockhammering out it’s base. That’s because the candlewick shows that even though the pricedropped it surged back up quickly.Inverted Hammer CandleAn inverted hammer is an upside hammer that occursat the top of a bullish run. Like the regular Hammer
14Formation, this candle shows the stock squeezed upbut was unable to hold those high prices and sold off.Indicating a reversal may be in store.Once you choose what kind of chart you like next youwill need to learn how to read those charts.Reading ChartsReading stock charts could be the top swing tradinglesson to understand. Stock charts may lookconfusing and make you feel overwhelmed but it iseasier than you think. Stock charts are used toidentify the right time to buy the stock. Charts showyou if a stock is trending up or down and help youidentify current base patterns and buy points. Withinthe charts we have two main pieces of information wetry to find, Support and Resistance Lines.
15SupportA support level is the pricedemand of a stock that isstrong enough so that itprevents the decline inprice past it. It is the levelat which buyers tend to enter the stock. To find thesupport lines draw a straight line to to all the dips inprice.ResistanceA resistance level isthe price level at whichselling of a stock isdeemed strong enoughto eliminate the increase in price. This is the level youwould want to start selling off. To find the resistance
16lines draw a straight line to the peaks.These lines is where traders learn when to jump inand out of the stock. Learning just these two lines willhelp you understand the stock and how much itsmoving. Also many swing traders use the resistanceline as a strategy (Chapter 4).Within the charts many traders use studies on theircharts. These study filters help swing traders get abetter understanding of what the stock will do or whatit has done in the past. The main studies are VWAP( Volume Weighted Average Price) , Volume, SMA(Simple Moving Average) and MACD ( MovingAverage Convergence Divergence.
17VWAPVolume Weighted AveragePrice, VWAP, is a tradingtool calculated by taking thenumber of shares bought times the share price anddividing by total shares.Many traders will trade just by judging the VWAP andbuy in when the price beats the VWAP and sell whenit falls under the VWAP.The disadvantages of the VWAP is that it is notsensitive to market environments meaning that its notthe best for high volatility environment. Also theVWAP is not the best for very large trades but youwon't have to worry about that.
18VolumeVolume is the numberof shares or contractstraded in a security oran entire marketduring a given period of time. For every buyer, thereis a seller, and each transaction contributes to thecount of total volume. If only three transactions occurin a day, the volume for the day is three. The Volumeis located near the bottom of the chart.When swing trading you need high volume each dayover 500k per day. The volume moves the prices thehigher the volume the more volatile the stock is trade.
19SMASimple MovingAverage (SMA) isan average pricecalculation on theclosing price of asecurity over aperiod of time and divided by the amount of periods.Moving averages are an important analytical toolused to identify current price trends and the potentialfor a change in an established trend. The simplestform of using a simple moving average in analysis isusing it to quickly identify if a security is in an uptrendor downtrend.
20MACDMoving AverageConvergence Divergence(MACD) indicator isanother oscillatingindicator. This measures the distance betweenmoving averages. If the moving averages are movingapart a stock is moving quickly, if they are comingclose together, a stock has changed directions and isreturning to balance. If they are close together, thestock isn’t moving in much of any direction.Using these study tools can help beginner traders feelmore comfortable and confident with your trades.Within the charts you have common patterns to lookfor like the Support Bounce, Bull Flags, Death Crossand the resistance breakout.
21Support BounceThis pattern is the most common pattern for beginnerswing traders. To find stocks that have the opportunityto bounce offthe supportthe have to bewithin 5% ofresistant lowsor highs.Once you find that stock you wait for confirmation ofthe reversal .Bull FlagsBull flag formations arefound in stocks withstrong uptrends. Theyare called bull flagsbecause the pattern
22resembles a flag on a pole. The pole is the result of avertical rise in a stock ( Gap ) and the flagresults froma period of consolidation.Death CrossPerhaps one of the scariest sounding terms on WallStreet is the “death cross” which is a name usedwhen major moving averages cross paths.
23Finding The Right StocksWithout finding hot stocks for swing trading you willme gambling your money away, Yes, you may getlucky once or twice but at the end the market willalways beat you.Stock Scanners are the most common and the mostsuccessful way in finding the hot stocks for the day,week or month. Most exchanges offer free scannersand if not you can find free ones online. What to addto your stock screener filter.Stock Screener Info Average Volume over 500k Relative Volume over 2 Price range from 5- 50 Look for Hot Sectors such as Tech, BasicMaterials, Healthcare, ect
24Swing trading is different than day trading because asswing traders we capture gains over a couple days ora couple weeks. So the stocks we look for move onaverage about 2-5% per day.When looking for stocks we hunt for stocks with uptrends and high average volume.Here are a couple tips when looking for stocks toswing trade:Watch The CalendarIt’s good to know if your names are reportingearnings, appearing at conferences, have executivesappearing on TV, unveiling new products, or can beimpacted by economic news.
25For example, if you’re long Apple, you better knowwhen it’s reporting earnings and when it’s showingnew products.As you can see in this chart, Apple gapped up big onearnings, and it had a wide-range bar on the iPhone 8release. Being aware of the calendar would have keptyou on alert for big moves:
26Be Careful of Penny StocksMany beginner traders are attracted to penny stocksdue to the price and the voliaty.Penny stocks move fast and at times can be hard todecide if the stock will go up or down.I only trade stocks with a price over 2 and under 20.It’s Okay to be Late to the PartyYou don't have time to actively check the stock, somost of the time youwill no find the stockin the dips or thelowest priceavailable. When astock makes a 20% move, you can still make someprofits. See the picture below: You could have bought
27at 60, 80 and even 100 and still could have turneda profit.Be Careful of Falling StocksOne of the biggest and fastest ways traders will blowup their accounts is by catching falling stocks.Meaning
Carters Rules to Be Successful 55 Final Words 57 Swing Trading Terminology 60. 4 I n t ro d u ct i o n Swing trading attempts to capture gains in a stock by holding it overnight or holding for several weeks. Swing traders use technical analysis to look for stocks with short-term price momentum. These traders may utilize fundamental or intrinsic value of stocks in addition to analyzing the .
