Transcription
Short Term Trading StrategiesIn this chapter, I will share with you some of my favourite winning strategies Ipersonally use. These strategies had been through extensive back-testing andprovided me with good returns in live trading all these years. I am sharing themwith you so that you can focus on trading well rather than engaging in an endlesssearch for a holy grail.Different strategies are suited for different time-frames. I believe there is no onesize fits all strategy.There are a few factors to consider when you are deciding your trading time frame1) Trading experience: The lesser experience you have in trading, the longertime frame you should choose. Trading intra-day chart (5 or 15mins) is thesame as a daily chart. However, instead of making a decision on 1 day, youhave to make a decision in every 15min.2) Time: The lesser time you have to devote to trading, the longer the timeframe you should trade. If you are working full time, it makes no sense totrade intraday as you need to be at your computer to watch your position.This is unless you are trading a market in a different time-zone like US.3) Money: The lesser money you can afford to lose, the longer should yourtime horizon be.Most people are better off investing in long term than trading, because of the 3factors mentioned above. However, for the few who aspire to trade full time, doingit part time first is the way to go. I strongly suggest to get a mentor if you aspire togo down this route and it is not an easy route. In a short while, I will show youanother way where you can with less experience, time and money still tradeprofitably using a time proven, back tested trading system.
Below is how I define my time-frames: Intra-day trade – position open and close within the same trading day Swing trade – position open and close within 5 trading days Position trade – position open and close for 2 weeks or longerSwing trade: Selling at peaks in downtrendSwing trade: Buying at dips in uptrendPosition trade: riding on big movesIllustration of position and swing tradingIntra-Day TradingI do not do intra-day trading because trading is not my full time job. It is not costeffective for me to sit down in front of the computer to trade for long hours. Whenyou trade in front of the computer, you are trading your time for money. However,I have done and is still doing is algo trading, which I programmed the computer totrade on my behalf. Instead of working in the market, I work on the system thatwork on the market. That is how I leverage and use technology to be moreproductive.
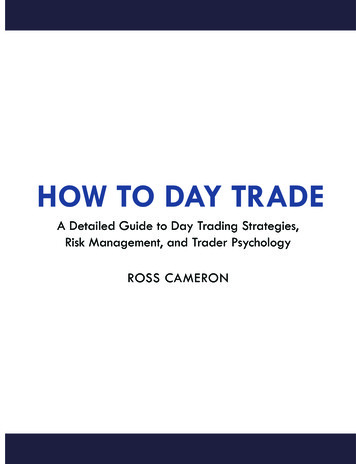
Swing Trading StrategyFor swing trading, the intention is to identify, follow and trade the trend. Swingtraders look to make profits within 5 trading days. Daily candles are frequentlyused for Technical Analysis, which determines the key entry and exit decisions inswing trading. For swing trades, traders generally buy the dips in an uptrend or sellthe peak in a downtrend.Remember the famous saying “The trend is your friend”? By trading the trend,you are riding the momentum of the market, which gives an edge to traders.It islike swimming alongside with the current rather than against. You should knowhow tough it is to swim against the current and eventually you will choose to giveup due to exhaustion. Remember that as a trader, we must always have an edgeover the market to be successful.This is just like a casino having an edge over thepunters.For new traders, you may not understand exactly what is up and down trend. Toqualify as uptrend, we are looking for higher highs and higher lows.Figure 19: Illustration of market in uptrendOn the other hand to qualify as downtrend, we are looking for lower highs andlower lows.
Illustration of market in downtrendThere are times where there are no higher highs or lower lows made. Under suchsituation, the market is moving sideways or otherwise known as consolidation.ResistanceSupportIllustration of market in consolidation
For trend trading, you have to identify 2 things:1) Current trend, which I call tide.Bullish TrendBearish TrendIllustration of tides
2) Dips in an uptrend and rally in a down trend, which I call wave.Dip in an uptrendRally in a downtrendIllustration of wavesI am using Simple Moving Average (SMA) to help read andidentify trends. Theparameters I frequently used are 20 and 40.A Moving Average (MA) is the averagevalue of a security’s price over a set period.
Bearish TrendBullish TrendIdentify market trends using moving averagesThe parameters used for Moving Averages often mean something to someindividuals or institutes. 20 SMA is the traders most dominant MA which can beused in all time frames.50 SMA is mostly use by banks and institutesand it is usedon daily time frame most of the time. Some traders use 50 SMA and 40 SMAinterchangeably and thus is up to individual preference. 200SMA is what manycalled the investor line and serves as a good support and resistance especially on15mins charts. 10 or 20 SMA – Traders’ Line 40 or 50 SMA – Banks and Institutions’ Line 200 SMA – Investors’ LineBased on my experience, it is not the number or parameter you are using on yourcharts. Rather, it is what the numbers means and how you use or perceive itinaccordance to your trading strategy. Some traders like to use 21SMA as 21 is aFibonacci number. To them, they may have a good understanding on Fibonaccinumbers and thus believe that the number 21 means something in the
equitymarket. To me, it does not really matters if the number is 20, 21 or 19. Onceagain, it is how I interpret the number, what it means to me and how I use it todefine my setups. Thus do not be too concern with exactly what number to use anddwell into endless research for the “HOLYNUMBER”.There are many ways to use a Moving Average (MA). Take for example, manytraders use MAs for crossover setups or to analyze a trend.Bearish Crossover - SellBullish Crossover - BuyBullish Crossover - BuyCrossover set-upsBut for me, I don’t really use it as a signal to buy or sell.Instead I will read thegradient of the MA to analysis the strength of a trend. If the 200SMA is sloping up,it is telling me that the long term investors are bullish about that particular stock.With 20SMA sloping up, it is telling me that the short-term traders are bullishabout the stock. If 20SMA is sloping up, 50SMA is flat while 200SMA is slopingdown, it is telling me that the short-term traders are bullish; the banks are neutralwhile the investors are bearish about the stock. The chart must be able to tell us astory and the story told will help traders like us to make a better decision.Other than the slope, you can also inspect the sequence of the MAs. A bearishtrendis considered established when 200, 50 and 20 MAs are aligned respectively asshown in the chart below. The opposite is true for bullish trend.
200SMA50SMA20SMAAlignment of Moving Averages to determine market trendIf the sequence of the MAs is 50, 20 and 200 respectively, a trend is yet to beestablished and you may wish to stay at the sideline while waiting for anopportunity. Do not be too eager to enter a trade when the signal to enter is notshown.Studying the space between the MAs is another option. If the MAs are far apart, itacts as an “insulator”, which also means to say that the current trend is very strong.Under such condition, when the price drop into the MAs, it will likely bounce offand resume its prior trend.SMAs are far apart depicting strongtrend. Price bounces off 40SMA andcontinue trending up.
Determine strong market strength using Moving AveragesIn contrast if the MAs are narrow, it may signify that the trend is weak and achange in trend may occur. As such, you have to be cautious when entering a tradeunder such condition.Determine weak market strength using Moving AveragesPersonally, I felt it is not good enough by just identifying the tide as we may endup buying the top of an uptrend or selling at the bottom of a downtrend.As such,we should always aim to buy a dip or pullback in an uptrend and to sell a rally in adowntrend.I am using CCI(5) to effectively identify a dip (in an uptrend) or rally (in adowntrend). Basically, CCI measures the current price level relative to an averageprice level over a given period of time, which in my case is 5 days. CCI isrelatively high when prices are far above their average. CCI is relatively low whenprices are far below their average. In this manner, CCI can be used to identifyoverbought and oversold levels.The reason why I used CCI as compared to momentum indicators (which isfrequently used by many other traders) is that the latter took only 2 points tocompute the value. Momentum and rate of change (ROC) are simple technicalanalysis indicators displaying the difference between today’s closing price and theclose N days ago. With that, it is evident to me that CCI provide more stories aboutthe market, as it takes into account the values for every past N day. This will makea big difference in your studies, especially when you are looking at shorter term.
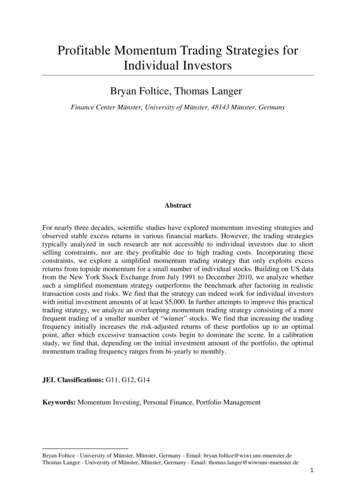
The reason why I used 5 as my parameter in CCI is because the equity market hasa certain pattern which repeats itself. Generally the uptrend market has around 5-7candles up followed by 3 candles down and vice versa for downtrend. If the tide isup and there are 3 candles going up and 5-7 candles down, it may signal a changeor reserve in trend.Also not to forget, there are 5 trading days in a week. Traderslike to open their position being of the week and close their trades before end ofthe week. As such, using 5 as my CCI parameter resonates with me better ascompared to other numbers. You can of course have another set of numbers thatsuits your strategies.CCI will generally oscillate between overbought ( 100) and oversold (-100) andwe study CCI closely to observe how price has pullback.Below is the chart and description on my setup for BullishSwingTrade.Example of bullish swing trade1) 20MA and 40MAmust be sloping up (with 20MA above 40MA). Having aspace between the MAs further indicates the strength of the trend.
2) Wait for price to pullback to 20SMA. Take note that during very bullish orbearish situations, price may not pullback to 20SMA but only pullback to10SMA. Thus we need to be flexible at times as trading is an art, not justscience. If price pullback to 10SMA and CCI is at -100, it is still a possiblesetup.3) Look out for meaningful pullbacks to buy on a dip, which means wemustwait for CCI be at -100.4) Next look for buy zone, which is the region between 20 and 40MA. Whenprice is inside this zone, it means getting ready to enter a trade. It isimportant we do not anticipate.5) Buy when price trades 1 bid above previous day’s high. The high ofprevious candle is the most bullish point for previous day. If today high canconquer previous day’s high, it means today is more bullish thanprevious.(At this time, your CCI not necessary be at -100, butit shouldvisited -100 before)6) Stop loss at 1 bid below previous day low or today’s low, whichever islower.For any strategies, traders must always lookout for a Payoff Ratio of more than 1before entering a trade. That means to say the amount of potential profit made willgenerally be more than what you would potentially lose if the trade went sour.More on Payoff Ratio will be shared in a later chapter.For this swing trading strategy, we always buy at the point where the price made apullback after a bull run and we believe that thetrend will continue thereafter.Before takingthe trade, we identify the previous high as our profit target and theprevious day or today’s low as our risk (stop-loss). With that, we calculate thePayoff Ratio. The general rule of thumb is to havethe Payoff Ratio to be 2, or atleast 1. Having a Payoff Ratio of 2 simply means that if the trade is a winning one,we will make 100 (for example) and if it happens to be a losing trade, we willlose 50.
In general, ensure that what you will likely to win is going to be more than whatyou likely to lose if the trade happens to be a losing one. Couple this with astrategy with Probability of Winof at least 0.5; you will definitely be profitable in along run if you do the Math. More on Probability of Win will be discussed later.Sometimes, the price can be so bullish that the CCI did not pullback to theoversold region, but to the neutral region (at 0). You can still enter such tradesunder such circumstances. It is optional and you can still make the trade dependingon your comfort level and/or experience. I know we are always looking for idealsetup conditions to be sure that the trade will make you money.But to be honest,you do not always see ideal or textbook situations in the stock markets. Even if thesetup is ideal, it does not mean this trade will definitely be a winning one.Whatever your decision is, you must never fail to ask yourself what is the PayoffRatio before making a trade.For this strategy, the opposite applies for bearish trades.Example of bearish swing tradeSummary for Swing trading Setup
1.2.3.4.5.6.7.Bullish SetupSloping up Moving Average20 MA above 40MACCI goes to -100Low touch 20 MA and goesbelow the 20 MAClose above 40 MABuy 1 bid above prior day highSell to close 1 bid below prior daylow1.2.3.4.5.6.7.Bearish SetupSloping down Moving Average20 MA Below 40MACCI goes to 100High touch 20 MA or goes above20 MAClose below 40 MASell 1 bid below prior day lowBuy to close 1 bid above priorday highKey Chart Patterns to NoteI will like to share with you some keychart patterns which will be most useful toyou when using my swing strategy.1) Measured PullbackThe pullback must be regular and controlled with small candles.Example of measured pullbacksWhen you observe a big tank as pullback, it is best to give this potentialentry a miss. Such volatile price action will likely indicate a change in atrend.
Example of a big tank as pullback2) Strong Trend With Higher Highs or Lower LowsThis swing strategy adopts “The Trend Is Your Friend” methodology. Henceit is important that the trend identified is strong before making an entrydecision. In a bullish trend, ensure that the price hit higher highs or lowerlows for bearish trend.Bullish trend displaying higher highsA strong bullish trend making higher highs
Bearish trend displaying lower lowsA strong bearish trend making lower lowsThe chart below depicts some examples where the trend is unclear andentering trades like this will get you nowhere. I will advise you to stay awayfrom making a trade until a clear trend is developed. Do not be too eager toenter a trade and keep looking for “creative” opportunities to make a trade,which is a common mistake most ammeter traders make. Remember abullish trend has higher highs and higher lows while a bearish trend haslower lows and lower highs.Price in consolidation
3) Parabolic MovementPrice should progress gradually and steadily as shown in the charts below tobe qualified as a good potential entry.Price trending gradually and steadilyBeware when you see price moving in a parabolic manner. Such drasticmovement will most likely result in large “aftershocks” with high volatility.Some may view this profitable, but it is definitely not my cup of tea.
Price moving in parabolic mannerExit Strategy for Swing TradeOnce I made an entry, my first profit target will be at the previous high (for bullishtrades). I will take progressive profits when price hit my first target.Previous high1st profit targetProfit-taking when price hit previous high
For this strategy, I will enter all positions (according to my risk management rules)once the buy signal is given. More on Position Sizing will be shared in a laterchapter. For exiting, I will do so by scaling out. Meaning if the price reaches theprevious high or 1 bid below previous high, I will take 30% off the table.Next I will study candlestick patterns and will exit another 30% if a doji (whichrepresent a possible trend reverse), bearish engulfing, or any bearish reversalcandlestick pattern appears. Lastly, I will exit all position if the price closes belowthe low of a doji, which may signify a change in trend direction. The reverseapplies for bearish trades.Exit when candle close below dojiExit when price close above doji
Exits using candlestick patternsBelow are some reliablecandlestick patterns which I will use to scale out or close atrade.DojiGraveyard DojiDragonfly DojiBearish EngulfingBearish EngulfingBullish Piercing PatternDark Cloud CoverEvening StarMorning StarExamples of candlestick patternsMany times in the equity market, price closes above previous swing high or belowprevious swing low. This is commonly named as “Breakout”.
Price closed and broke above previous highPrice closed and broke below previous lowExamples of breakoutsMany traders who are scanning for stocks will generally think that this is a goodchance to trade a breakout strategy. This means they are looking for price that hitshigher than the previous swing high, and believe that price will continue higher. Abullish trade entry will be made the next day once market opens. Nevertheless,such price movement frequently calls for a false breakout and price starts toreverse. As such, it is a good time for me to exit for profits (when price is at or nearprevious swing high) as I had already entered much earlieraccording to my swingstrategy and I am already in profit. In general, this swing trade strategy I am usingdoes not trade the breakout but to trade retracement. Nevertheless, I do not mean
that breakout strategy does not work. You can make a neat profit if price goes yourway after a breakout. But my experience is that the Probability of Win for breakoutstrategy is very low. Many traders chose to give up after suffering a couple oflosses. I rather adopt a strategy with higher Probability of Win.Take profit when price hit previous highFalse Bullish BreakoutFalse Bearish BreakoutTake profit when price hit previous low
Examples of false breakoutEvery time when price gaps up significantly, it is a good idea to lock in profits aswell. How significant is it depends on the stock’s history as it is in relative to itspast data. As a trader, it is important that we also study the pattern and movementof the stock we are trading. Understand its behaviour so that we will be taken bysurprise.Example if today is the 4th day of my trade and stock price gaps up say by 2%, Iwill take partial profits. If price gaps up and reverse to previous day high, I willalso scale out of position.The key idea is to scale out of position progressively.Exit long partial position as price gapsup significantly upon market open.Notice price is going nowhere.Thus it’s a good idea to put your money elsewhere.Profit-take after a gap up
Exit partial short position when price gapdown significantly upon market open.Profit-take after a gap downMy time frame for swing trades is 5 days. This means that I will exit all positionswithin 5 days regardless of the price.This is what I call, Time Stop. According toexperience, if price do not reach my profit targets within 5 trading days, it mostlikely will not be going anywhere. Under such condition, I will drop this stock(regardless if I am in profit or loss) and use the capital for other opportunities. Donot waste your time and money on a stock that does not make money for you. Exitgracefully as suggested by Time Stop, and carry on your trading journey ratherthan keep on hoping.Below are more examples of my swing trade setups.
Examples of swing trade setupsImportance of Stop LossStop loss is a very important element in trading. Although important, it isfrequently ignored(on purpose) by many traders. The reason why many ignored theneed for a stop loss is because they refuse to admit that their trades wentwrong.They rather hope that the price will get back to their favour and thus turninga loser into a winner. You may be lucky once or twice, but in a long run you willsuffer for being so “optimistic”.You cannot be successful in trading by hoping or turning a swing trade into a longterm investment.In my honest opinion, you cannot gain success in trading unlessyou are able to embrace the important of setting a stop loss in every trade youmade. Many traders learnt this the hard way; do you want to be one of them?Now, I will share with you how I set my stop loss every time I make a swing trade. 1st stop loss - initial stop loss
o Upon entering a trade, stop loss is immediately set at previous daycandle low for bullish tradeor previous day candle high for bearishtrade.Determining stop-loss upon entry 2nd stop loss – breakeven stopo If price move up (for bullish trade) or down (for bearish trade)forabout 5% in your favour, shift stop loss to breakeven, i.e. at entryprice. 3rd stop loss – trailing stopo When price move more than 5% in your favour, set your stop-loss toprevious candle low for bullish trade or previous candle high forbearish trade. This will act as an insurance to protect your profits. 4th stop loss – time stopo Close all positions after 5 trading days (excluding entry day), even ifthe price have yet to hit our target or stop loss. Also, a lot of peopleare doing contra and they have to buy and sell within 5 days, so as toprofit from the contra gain.Can you see how structured my stop loss is and how it fused into my swing tradingstrategy seamlessly? For whatever strategies you are using, always have a stop loss
plan in place, BEFORE making a trade! More often than not, traders decided tocut loss only when the amount loss is too much for them to bear. Do get yourtrading psychology right before making any trades.Position Trading StrategyFor my position trading strategy, I will be in a trade for 2 weeks or longer. I will betrading the weekly charts for position trading and this strategy is good for traderswho are not able to monitor the market daily. I use 2 different strategies forposition trading, which I will share now.Cross-over StrategyFor this strategy, I will use 10EMA and 50EMA to trade the cross-over. Suchcross-over trades are pretty reliable on weekly charts and they are easy toimplement.Enter a bullish trade once 10EMA cross above 50EMA.Enter a bearish trade once 10EMA cross below 50EMA.Bearish crossover - SELLBullish crossover - BUYBullish crossover - BUY
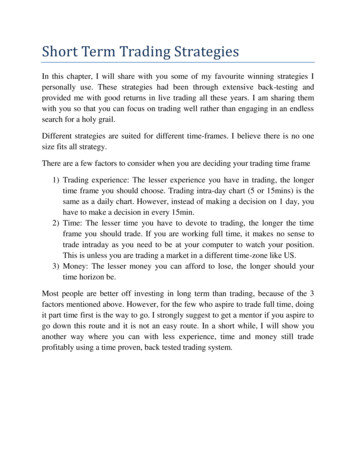
Bearish crossover - SELLBullish cross over - BUYExamples of cross-over strategyK39 StrategyK39 is also commonly known as Stochastic 39. As the name suggest, we will beusing Slow Stochastic indicator with K parameter set as 39. We do not need thesignal line for this strategy.The setup will be as follows:1) Look for K39 line to be above 50 for bullish trade or below 50 for bearishtrade.2) Price must trade above previous candle high for bullish trade or belowprevious candle low for bearish trade.3) Check On Balance Volume (OBV) line for convergence (direction inconjunction with price) to confirm entry.On Balance Volume (OBV) measures buying and selling pressure as a cumulativeindicator that adds volume on up days and subtracts volume on down days. It is a
simple indicator that uses volume and price to measure buying pressure and sellingpressure. Generally, if price is going up, OBV logically should be going up anddown if price is going down.Examples of K39 strategy with reference to OBVFrom the chart above, we can get ready to enter a bearish trade when Stochastic 39cross below 50 mark and OBV cross below signal line (red). Execute the tradewhen price trades below the previous candle low. Same explanation applies to thechart below.
Examples of K39 strategywith reference to OBVWhich Strategy to UseI always have many questions by traders asking me which are the best strategies touse.Which time frame is the best? Are there sure win strategies that can makeabundance of income without much hard work?There are no sure win strategies or what many call holy grails. No matter howgood the strategy is, there are bound to be losing trades or if not, losing streaks. Isaw too many traders giving up a sound strategy after encountering 2 to 3 losses.When a new strategy is adopted, they change strategy again after some losses. Thiswill go on over and over again until either the trading account is empty, or they justgot too disappointed.To me, a strategy is good when Probability of Win is more than 0.5 and PayoffRatio is more than 1. There will be losing trades along the way, but it is no brainerthat your trading account will grow consistently in a long run. The next questionthat arises is how a trader knows if the strategy used has a good Probability of Winand Payoff Ratio. This is where extensive back-testing is required and traders needto be diligent in doing this. If you want to be successful in trading, you have to put
in the effort and hard work. There is no such thing as easy money and be aware ofempty promises!Learning Points Trading is like an art, not science. Do not be too caught up in looking for theideal setup The trend is your friend Follow your trading plans and not anticipating trades When it comes to trading, know you time frame There are 4 different types of stop loss namely, initial, breakeven, trailingand time stop Always know your stop loss BEFORE making a trade Move your stop to breakeven when you start to make money Do not give up too soon as success is just round the corner
Exercise1) What is your ideal Payoff Ratio requirement to enter a trade?2) What should your minimum Probability of Win be for the strategy you areadopting?3) What is/are your Stop-Loss plan(s)?
Swing Trading Strategy For swing trading, the intention is to identify, follow and trade the trend. Swing traders look to make profits within 5 trading days. Daily candles are frequently used for Technical Analysis, which determines the key entry and exit decisions in swing trading. For swing trades, traders generally buy the dips in an uptrend .