Transcription
“ WinningTradingStrategies “How To Finally Attain the ResultsYou Want In Trading and BuildYour Wealth and Income withProven Strategies that WorkBy TradersGPS
In this chapter, I will share with you some of my favourite winningstrategies I personally use. As discussed earlier, it is important to adopt astrategy that has a winning probability of more than 0.5 (50%) and a payoffratio of at least 1 to be profitable in the long run. These strategies I amgoing to share had been through extensive back-testing and provided mewith good returns in live trading all these years. I am sharing them with youso that you can focus on trading well rather than engaging in an endlesssearch for the holy grail.Different strategies are suited for different time-frames. I believe there isno one size fits all strategy. Below is how I define my time-frames: Intra-day Trade – Position opened and closed within the sametrading day Swing Trade – Position opened and closed within 5 trading days Position Trade – Position opened and closed for 2 weeks or longerSwing trade: Selling at peaks in downtrendSwing trade: Buying at dips in uptrendPosition trade: riding on big movesillustration of position and swing trading
The Swing Trading StrategyFor swing trading, the intention is to identify, follow and trade the trend.Swing traders look to make profits within 5 trading days. Daily candles arefrequently used for Technical Analysis, which determines the key entry andexit decisions in swing trading. For swing trades, traders generally buy thedips in an uptrend or sell the peaks in a downtrend.Remember the famous quote “The trend is your friend”? By trading thetrend, you are riding the momentum of the market, which gives an edge totraders. It is like swimming alongside with the sea current rather thanagainst it. You should know how tough it is to swim against the current andeventually you will choose to give up due to exhaustion. Remember thatas a trader, we must always have an edge over the market to be successful.This is just like a casino having an edge over the punters.For new traders, you may not understand exactly what is an up or downtrend. To qualify an uptrend, we are looking for higher highs and higherlows.!illustration of a market in an uptrend
On the other hand, to qualify as a downtrend, we are looking for lowerhighs and lower lows.!illustration of a market in a downtrendThere are times where there are no higher highs or lower lows made.Under such situations, the market is moving sideways or otherwise knownas “consolidation”.Resistance!Supportillustration of a market in consolidation
For trend trading, you have to identify 2 things:1) The Current trend, which I term as the tide.BullishTrendBearishTrendillustration of tides
2) Dips in an uptrend and rallies in a down-trend, which I term n of waves
I am using the Simple Moving Averages (SMAs) to help read and identifytrends. The parameters I frequently use are the 20 and 40 SMAs. AMoving Average (MA) is simply the average value of a security’s price overa set period.BearishTrendBullishTrend!Identify market trends using moving averagesThe parameters used for Moving Averages often mean something to someindividuals or institutions. 20 SMA is the trader’s most dominant MA whichcan be used in all time frames. 50 SMA is mostly employed by banks andinstitutions and is used on the daily time frame most of the time. Sometraders use the 50 SMA and 40 SMA interchangeably and thus it is up tothe individual’s preference. The 200 SMA is what many call the investor
line and serves as a good support and resistance especially on the 15minscharts. 10 or 20 SMA – Traders’ Line 40 or 50 SMA – Banks and Institutions’ Line 200 SMA – Investors’ LineBased on my experience, it is not so much about the number or parameteryou are using on your charts. Rather, it is what the numbers mean and howyou use or perceive it in accordance to your overall trading strategy. Sometraders like to use the 21 SMA as 21 is a Fibonacci number. To them, theymay have a good understanding of Fibonacci numbers and thus believethat the number 21 means something in the equity market. To me, it doesnot really matter if the number is 20, 21 or 19. Once again, it is how Iinterpret the number, what it means to me and how I use it to define mysetups. Thus, do not be too overly concerned with exactly which numberto use and dwell into the endless research for the “HOLY NUMBER”.There are many ways to use a Moving Average (MA). Take for example,many traders use MAs for crossover setups or to analyse a trend.
BearishCrossover- ‐SellBullishCrossover- ‐Buy!BullishCrossover- ‐BuyCrossover set-upsHowever for me, I don’t really use it as a signal to buy or sell. Instead I willread the gradient of the MA to analyse the strength of a trend. If the 200SMA is sloping up, it is telling me that the long term investors are bullishabout that particular stock. With the 20 SMA sloping up, it is telling methat the short-term traders are bullish about the stock. If the 20 SMA issloping up, 50 SMA is flat while the 200 SMA is sloping down, it is tellingme that the short-term traders are bullish; the banks are neutral while theinvestors are bearish about the stock. The chart must be able to tell us astory and the story told will help traders like us make a better decision.Other than the slope, you can also inspect the sequence of the MAs. Abearish trend is considered established when the 200, 50 and 20 MAs arealigned respectively as shown in the chart below. The opposite is true for abullish trend.
200SMA50SMA20SMA!Alignment of Moving Averages to determine market trendIf the sequence of the MAs are 50, 20 and 200 respectively, a trend is yetto be established and you may wish to stay on the sidelines while waitingfor an opportunity. Do not be too eager to enter a trade when the signalto enter is not shown.Studying the space between the MAs is another option. If the MAs are farapart, it acts as an “insulator”, which also means to say that the currenttrend is very strong. Under such conditions, when the price drop into theMAs, it will likely bounce off and resume its prior trend.
�the40SMAandcon@nuetrendingup.!Determine strong market strength using Moving AveragesIn contrast, if the MAs are narrow, it may signify that the trend is weak anda change of trend may occur. As such, you have to be cautious whenentering a trade under such conditions.!Determine weak market strength using Moving AveragesPersonally, I felt that it was not good enough by just identifying the tide aswe may end up buying the top of an uptrend or selling at the bottom of adowntrend. As such, we should always aim to buy a dip or pullback in anuptrend and to sell a rally in a downtrend.
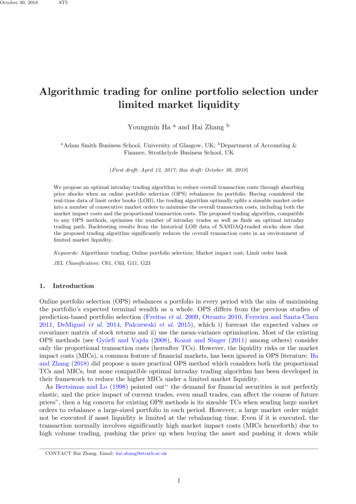
I am using CCI(5) to effectively identify a dip (in an uptrend) or rally (in adowntrend). Basically, CCI (Commodity Channel Index) measures thecurrent price level relative to an average price level over a given period oftime, which in my case is 5 days. CCI is relatively high when prices are farabove their average. CCI is relatively low when prices are far below theiraverage. In this manner, CCI can be used to identify overbought andoversold levels.The reason why I use CCI as compared to other momentum indicators(which is frequently used by many other traders) is that the latter took only2 points to compute the value. Momentum and rate of change (ROC) aresimple technical analysis indicators displaying the difference betweentoday’s closing price and the close N days ago. With that, it is evident tome that the CCI provide a clearer picture about the market, as it takes intoaccount the values for every past N day. This will make a big difference inyour studies, especially when looking at the shorter term.The reason why I used 5 as my parameter in CCI is because the equitymarket has a certain pattern which repeats itself. Generally the uptrendmarket has around 5-7 candles up followed by 3 candles down and viceversa for downtrend. If the tide is up and there are 3 candles going up and5-7 candles down, it may signal a change or reversal in trend. Also not toforget, there are 5 trading days in a week. Traders like to open theirposition beginning of the week and close their trades before the end ofthe week. As such, using 5 as my CCI parameter resonates with me betteras compared to other numbers. You can of course have another set ofnumbers that suit your strategies.CCI will generally oscillate between overbought ( 100) and oversold(-100) and we study CCI closely to observe the price pull-back.
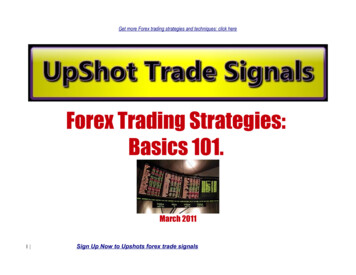
Below is the chart and description on my setup for a Bullish Swing Trade.!Example of bullish swing trade1) 20MA and 40MA must be sloping up (with 20MA above 40MA).Having a space between the MAs further indicates the strength of thetrend.2) Wait for price to pullback to 20 SMA. Take note that during verybullish or bearish situations, price may not pullback to 20 SMA butonly pullback to the 10SMA. Thus we need to be flexible at times astrading is an art, not just science. If price pullback to the 10 SMA andCCI is at -100, there is still a possibility of a setup.3) Look out for meaningful pullbacks to buy on a dip, which means wemust wait for CCI be at -100.
4) Next look for the buy zone, which is the region between the 20 SMAand 40 SMA. When price is inside this zone, get ready to enter atrade. It is important that we do not anticipate.5) Buy when price trades 1 bid above the previous day’s high. The highof the previous candle is the most bullish point for the previous day. Iftoday’s high can conquer the previous day’s high, it means that todayis more bullish than the previous day. (At this time, your CCI may notnecessary be at -100, but it should have visited the -100 readingbefore)6) Stop loss at 1 bid below the previous day’s low or today’s low,whichever is lower.For any strategy, traders must always be looking out for a Payoff Ratio ofmore than 1 before entering a trade. That means to say that the amount ofpotential profit made will generally be more than what you wouldpotentially lose if the trade went sour. More on the Payoff Ratio will beshared in a later chapter.For this particular swing trading strategy, we always buy at the point whereprices have made a pullback after a bull run and we believe that the trendwill continue thereafter. Before taking the trade, we identify the previoushigh as our profit target and the previous day’s or today’s low as our risk(stop-loss). With that, we calculate the Payoff Ratio. The general rule ofthumb is to have the Payoff Ratio to be 2, or at least 1. Having a PayoffRatio of 2 simply means that if the trade is a winning one, we will make 100 (for example) and if it happens to be a losing trade, we will lose 50.In general, ensure that what you will gain is going to be more than whatyou will lose if the trade happens to be a losing one. Coupling this
concept with a strategy that has a win rate of at least 0.5 (50%); and youwill be profitable in the long run as it is just pure mathematics.Sometimes, prices can be so bullish that the CCI did not pullback to theoversold region, but to the neutral region (at 0). You can still enter suchtrades under such circumstances. It is optional and you can still make thetrade depending on your comfort level and/or experience. I know that weare always looking for the ideal setup condition to be sure that the tradewill make money. But to be honest, you do not always see ideal ortextbook situations in the stock market. Even if the setup is ideal, it doesnot mean the trade will definitely be a winning one. Whatever yourdecision is, you must never fail to ask yourself what is the Payoff Ratiobefore making a trade.For this strategy, the opposite applies for bearish trades.!Example of a bearish swing trade
Summary Table for a Swing Trading SetupBullish Setup1. Sloping up Moving Average2. 20 MA above 40MA3. CCI goes to -1004. Low touch 20 MA and goesbelow the 20 MA5. Close above 40 MA6. Buy 1 bid above prior dayhigh7. Sell to close 1 bid below priorday lowBearish Setup1. Sloping down MovingAverage2. 20 MA Below 40MA3. CCI goes to 1004. High touch 20 MA or goesabove 20 MA5. Close below 40 MA6. Sell 1 bid below prior day low7. Buy to close 1 bid above priorday highKey Chart Patterns to NoteI will like to share with you some key chart patterns which will be mostuseful to you when using my swing strategy.1) Measured PullbackThe pullback must be regular and controlled with small candles.
!Example of measured pullbacksWhen you observe a big tank / impulsive movement as pullback, it isbest to give this potential entry a miss. Such volatile price action willlikely indicate a change in a trend.!Example of a big tank / impulsive movement as pullback2) Strong Trend With Higher Highs or Lower LowsThis swing strategy adopts “The Trend Is Your Friend” methodology.Hence it is important that the trend identified is strong before
making an entry decision. In a bullish trend, ensure that prices arehitting higher highs. In a bearish trend, lower highs and lower lows.Bullishtrenddisplayinghigherhighs!A strong bullish trend making higher highsBearishtrenddisplayinglowerlows!A strong bearish trend making lower lows
The chart below depicts some examples where the trend is unclearand entering trades like this will get you nowhere. I will advise you tostay away from making a trade until a clear trend has developed. Donot be too eager to enter a trade and keep looking for “creative”opportunities to make a trade, which is a common mistake mostamateur traders make. Remember a bullish trend has higher highsand higher lows while a bearish trend has lower lows and lowerhighs.!Prices in consolidation3) Parabolic MovementPrices should progress gradually and steadily as shown in the chartsbelow to be qualified as a good potential entry.
!!Prices trending gradually and steadilyBeware when you see price moving in a parabolic manner. Suchdrastic movements will most likely result in large “aftershocks” withhigh volatility. Some may view this profitable, but it is definitely notmy cup of tea.
!Prices moving in parabolic mannerExit Strategy for Swing TradesOnce I have made an entry, my first profit target will be the previous high(for bullish trades). I will take progressive profits when price has hit my firsttarget.Previoushigh1stprofittarget!
Profit-taking when price has hit the previous highFor this strategy, I will enter all positions (according to my riskmanagement rules) once the buy signal is given. More on Position Sizingwill be shared in a later chapter. For exiting, I will do so by scaling out.Meaning if the price has reached the previous high or 1 bid below theprevious high, I will take 30% off the table.Next I will study candlestick patterns and exit another 30% if a doji (whichrepresent a possible trend reversal), bearish engulfing, or any other bearishreversal candlestick patterns appear. Finally, I will exit all positions if pricecloses below the low of a doji, which may signify a change in trenddirection. The reverse applies for bearish trades.Exitwhencandleclosebelowdoji!
Exitwhenpricecloseabovedoji!Exits using candlestick patternsBelow are some important candlestick patterns which I will use to scale outor close a trade.!DojiGraveyard DojiBearish EngulfingBearish EngulfingDragonfly DojiBullish Piercing Pattern
Dark Cloud CoverEvening StarMorning StarExamples of candlestick patternsMany times in the equity market, price closes above the previous swinghigh or below the previous swing low. This is commonly named as gh!
Priceclosedandbrokebelowpreviouslow!Examples of breakoutsMany traders who are scanning for stocks will generally think that this is agood chance to trade a breakout strategy. This means that they arelooking for price that trades higher than the previous swing high, andbelieve that prices will continue higher. A bullish trade entry will be madethe next day once the market opens. Nevertheless, such price movementfrequently calls for a false breakout and price usually starts to reverse. Assuch, it is a good time for me to exit for profits (when price is at or nearprevious swing high) as I had already entered much earlier according to myswing strategy and I am already in profit. In general, this swing tradestrategy I am using does not trade the breakout but instead to traderetracements. Nevertheless, I do not mean that breakout strategies do notwork. You can make a neat profit if prices go your way after a breakout. Butfrom my experience the win-rate for breakout strategies are very low. Manytraders chose to give up after suffering a couple of losses. I would ratheradopt a strategy with higher win rates.
reviouslow!Examples of false breakoutsEvery time when price gaps up significantly, it is a good idea to lock inprofits as well. How significant it is depends on the stock’s history as it isrelative to its past data. As a trader, it is important that we also study the
pattern and movement of the stock that we are trading. Understand it’sbehaviour so that we will not be taken by surprise.For example if today is the 4th day of my trade and stock prices gap up sayby 2%, I will take partial profits. If price gaps up and reverses to theprevious day high, I will also scale out of position.The key idea is to scale out of your position it-taking after a gap up
lyuponmarketopen.!Profit-taking after a gap downMy time frame for swing trades is 5 days. This means that I may exit allpositions within 5 days regardless of the price. This is what I call a TimeStop. According to experience, if prices do not reach my profit targetswithin 5 trading days, it most likely that it will not be going anywhere.Under such conditions, I will drop this stock (regardless if I am in profit orloss) and use the capital for other opportunities. Do not waste your timeand money on a stock that does not make money for you. Exit gracefullyas suggested by the Time Stop, and carry on your trading journey ratherthan hoping.Below are more examples of my swing trade setups:-
!!
!Examples of swing trade setupsThe Importance of Stop LossesStop losses are paramount in trading. Although important, it is frequentlyignored (on purpose) by many traders. The reason why many have ignoredthe need for a stop loss is because they refuse to admit that their tradeswent wrong. They would rather hope that prices will recover and thusturning a loser into a winner. You may be lucky once or twice, but in thelong run you will suffer for being so “optimistic”.You cannot be successful in trading by hoping or turning a swing trade intoa long term investment. In my honest opinion, you cannot gain success intrading unless you are able to embrace the importance of setting a stoploss in every trade you make. Many traders have learnt this the hard way;do you want to be one of them?Now, I will share with you how I set my stop loss every time I make a swingtrade.
1st stop loss - initial stop loss- Upon entering a trade, a stop loss is immediately set at theprevious day’s candle low for bullish trades or the previous day’scandle high for a bearish trade.TriggeStop loss!63Determining stop-loss upon entry 2nd stop loss – breakeven stop- If prices have moved up (for bullish trade) or down (for bearishtrade) for about 5% in your favour, shift your stop loss tobreakeven, i.e. at entry price. 3rd stop loss – trailing stop- When price has moved more than 5% in your favour, set yourstop-loss to previous candle low for bullish trade or previouscandle high for bearish trade. This will act as an insurance toprotect your profits.
4th stop loss – time stop- Close all positions after 5 trading days (excluding entry day),even if prices have yet to hit our target or stop loss.Can you see how structured my stop losses are and how it has fused intomy swing trading strategy seamlessly? For whatever strategies you areusing, always have a stop loss plan in place, BEFORE making a trade!More often than not, traders choose to cut loss only when the loss amountis too much for them to bear. Do get your trading psychology right beforemaking any trades.
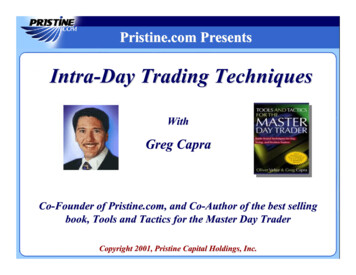
Position Trading Strategy (The Cross-over)For my position trading strategy, I will be in a trade for 2 weeks or longer. Iwill be trading the weekly charts for position trading and this strategy isgood for traders who are not able to monitor the market daily.For this strategy, I will use the 10 EMA and 50 EMA to trade the cross-over.EMAs are exponential moving averages and give more weight to recentprices. Such cross-over trades are pretty reliable on weekly charts and theyare easy to implement.Enter a bullish trade once 10EMA cross above 50EMA on the weekly chart.Enter a bearish trade once 10EMA cross below 50EMA on the weeklychart.Bearishcrossover- ‐SELL!Bullishcrossover- ‐BUYBullishcrossover- ‐BUY
Bearishcrossover- ‐SELL!Bullishcrossover- ‐BUYExamples of the cross-over strategyWhich Strategy to UseI always have many questions by traders asking me which are the beststrategies to use. Which time frame is the best? Are there sure winstrategies that can create an abundance of income without much hardwork?There are no sure win strategies or what many call the holy grails. Nomatter how good the strategy is, there are bound to be losing trades or ifnot, losing streaks. I have seen too many traders giving up a soundstrategy after encountering 2 to 3 losses. When a new strategy is adopted,they change their strategy again after some losses. This will go on overand over again until either the trading account is empty, or they just gaveup due to disappointment.To me, a strategy is good when the probability of winning is more than 0.5(50%) and the Payoff Ratio is more than 1. There will be losing trades along
the way, but it is a no brainer that your trading account will growconsistently in the long run. The next question that arises is how a traderwill know if the strategy used has a good probability of winning and PayoffRatio. This is where extensive back-testing is required and traders need tobe diligent in doing this. If you want to be successful in trading, you haveto put in the effort and hard work. There is no such thing as easy moneyand be aware of empty promises!Key Learning Points Trading is an art, not a science. Do not be too caught up in lookingfor the ideal setup The trend is your friend Follow your trading plans and not anticipating trades When it comes to trading, know you time frame There are 4 different types of stop losses; namely: initial, breakeven,trailing and time stop Always know your stop losses BEFORE taking trades Move your stops to breakeven when you start to make money Do not give up too soon as success is just around the corner
Exercises1) What is your ideal Payoff Ratio requirement to enter a trade?2) What should your minimum “Probability of Win Rate” be for thestrategy you are adopting?3) What is/are your Stop-Loss plan(s)?
The Swing Trading Strategy For swing trading, the intention is to identify, follow and trade the trend. Swing traders look to make profits within 5 trading days. Daily candles are frequently used for Technical Analysis, which determines the key entry and exit decisions in swing trading. For