Transcription
COVER STORYJean Van Rensselar / Contributing EditorVIBRATIONANALYSIS:The other half ofthe equationKEY CONCEPTS The premise behind vibration analysis is that specific mechanical defects producecharacteristic vibrations at different frequencies. Vibration analysis is an excellent complement to oil analysis in some applications. The need for integrated monitoring depends on the applicability of the procedures and theimportance of the equipment.38 AUGUST 2011T R I B O LO GY & LU B R I CAT I O N T EC H N O LO GYW W W. ST L E .O RG
This proven condition monitoring method is an excellentcomplement to oil analysis in many applications.It’s intuitive—if something is obviously wobbling and vibrating that’s not supposed to, it’s not good. This applies to 300 washing machines and 25 million oil rigs.Every aspect of highly engineered equipment is perfectlybalanced and meant to stay that way for a long time. Theslightest new vibration is an early warning that something isout of sync and is likely to get worse. While factory workers have known this for two centuries, until the advent ofsophisticated vibration analysis, by the time you could seeor hear something vibrating it was too late.Today, most enlightened organizations have a proactivemaintenance program in place—monitoring the conditionof the equipment well before failure. Oil analysis is one oftwo major analysis methods, vibration analysis is the other.In addition to wasting energy and, in the extreme, wearing on the nerves of everyone who has to listen to it for40-plus hours a week, unusual machine vibration usuallyindicates impending failure (most vibrations in rotatingmachinery are caused by either imbalances in the rotatingparts, poorly meshing gear teeth or uneven friction).W W W. ST L E .O RGT R I B O LO GY & LU B R I CAT I O N T EC H N O LO GYAUGUST 2011 39
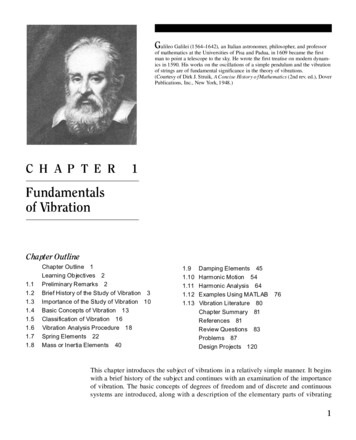
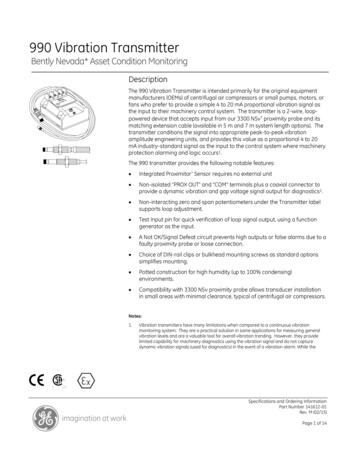
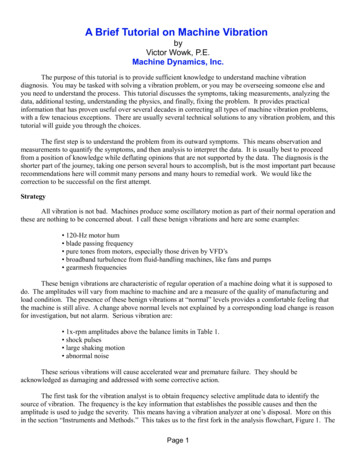
As oil analysts know, most carefully monitored mathe condition of complex machinery such as multistagechines don’t suddenly fail. Well before failure there aregearboxes, turbine/generators and AC and DC motors.anomalies or ominous trends in oil analysis reports.On the other hand, there are a number of machines thatFor vibration analysts, those warnings are an increasecan’t be adequately analyzed with vibration monitoringin the level of vibration at a particular location.alone, these include diesel engines, piston type hydrauIn the same way that oil analysis picks up the preslic pumps and reciprocating air compressors.ence of particles too small to see with the naked eye,Bill Marscher is president and technical director ofvibration analysis picks up increases in vibration levelsMechanical Solutions, Inc., in Whippany, N.J., and alsothat are too slight for the ear to detect or the hand toa past president of STLE and an STLE Fellow. He says,feel. By monitoring, measuringand analyzing those vibrations,users can often pinpoint the exact cause of the problem and correct it before real damage occurs.Vibration analysis and oilanalysis are rarely performed together, but experts say there aredefinite benefits to doing so insome applications—like gearboxes, reciprocating combustionengines and hydraulic systemswhere they create a very accurateand complete picture of equipment health.Like oil analysis, vibrationanalysis allows users to evaluateequipment condition and (it ishoped) avoid failure. The sooner the problem is detected andfixed, the less expensive it is toThe idea behind vibration analysis is that each piece ofrepair.equipment has its own unique vibration signature.VIBRATION ANALYSISThe idea behind vibration analysis is that each piece of equipment has its own uniquevibration signature. Once that signature is established,any variation is cause for concern. Mechanical defectsproduce characteristic vibrations at different frequencies. Specific vibrations relate to specific machine faultconditions. For example, when bearings and components reach the end of their lifecycles, they begin tovibrate more dramatically and distinctly. By using signal-processing technology to analyze the time and frequency spectrums, monitoring equipment can identifythe defect and natural frequencies of targeted structuralcomponents.Rotating structures are prime candidates for vibration analysis with their constant but arbitrary velocityin elements such as rotor shafts and propeller blades(wind turbines and helicopters). Most rotating machine failures are rooted in imbalances. The center ofmass is not in sync with the center of rotation, which isespecially rough on the bearings that are critical to thesmooth operation and longevity of equipment.Vibration analysis is also excellent for diagnosing40“Because they want to get very early warning of impending reliability problems—and vibration analysistypically does this best—the refinery/petrochemical,power generation and water/wastewater industries often rely more on vibration analysis than they do on oilanalysis.”There are two types of vibration. Free vibration occurs when movement in a mechanical system is initiated by an outside force. The mechanical system vibratesfreely for a time but then invariably stops. Forced vibration occurs when an irregular force impacts a mechanical system—most often creating an imbalance.The frequency of the vibration and the frequency of theapplied force are the same, but the magnitude dependson the structure of the mechanical system.One of the advantages of vibration analysis is theability to stave off damage by predicting when a specifictype of vibration will occur before the fact and lettingusers know how to prevent it from happening. For veryexpensive pieces of equipment, the cost savings of thisanalysis methodology are significant.Call for papers: STLE is now accepting abstracts for its 2012 annual meeting in St. Louis. Deadline: Oct. 1. Details at www.stle.org.
TEST OPTIONSVibration analysis used to be as primitive as dialing aninstrument to identify frequencies where vibration wasprominent. All the user had to do was compare peakfrequencies with operating speed. The final step wasconsulting the manufacturer’s chart for possible causes.While this method left a lot of room for error and interpretation, it created a close link between the user andthe equipment—allowing experienced users to senseexactly what was amiss without looking at the chart.The current generation of vibration analysis equip-Choosing machinery to monitor:The Criticality IndexThe Criticality Index determines the logical extent ofcondition monitoring required for a piece of equipment.It takes into account such factors as: The importance of the machine’s function. Whether or not there is another piece ofequipment that can take over the function ifthat piece of machinery fails. The overall impact of downtime. The projected repair cost.This index assigns all machines to one of thefollowing three categories:1. Critical Machinery: These are machines that areso important that the rest of the operating environmentcan’t function without them, i.e., power plant turbines.Equipment in this category requires complete online and(where possible) inline condition monitoring, regardlessof cost. The specifics of monitoring are often included ininsurance policies and warranties. These pieces ofequipment are prime candidates for predictive maintenance.2. Essential Machinery: This equipment is keyto the operating environment, but its failure does notcripple operations. Sometimes equipment that falls inthis category would be considered critical if not forthe fact that a backup piece of equipment is readilyavailable. While testing is not as important as it is withcritical machinery, it is recommended to circumventcostly repairs and inconvenience.3. General Purpose Machinery: The balance ofoperations equipment is in this category. These machinesare usually monitored informally and periodically.42 AUGUST 2011ment and software predict developing problems withremarkably accuracy. In fact, this equipment can display a full spectrum of vibration across three axes atonce. But as with oil analysis, the plethora of cuttingedge software-based capabilities and features still require a basic understanding of vibration analysis toreap the full benefits.The core tool for analyzing vibrations is the FFT(Fast Fournier Transformation) spectrum analyzer,which was developed in the mid-1970s. This tool samples the input signal, computes the magnitude of itssine and cosine parameters and then displays the spectrum of these measured frequency components. Theprimary advantage over analog spectrum analyzers isspeed—up to several hundred times faster.In the early 1980s, FFT spectrum analyzers becameavailable in portable, handheld versions. Paired withsoftware for condition monitoring data collecting andanalysis, these were very powerful tools. Not surprisingly, the number of companies instituting vibrationanalysis to diagnose areas like imbalances, misalignments and bearing defects grew exponentially. TheseFFT analyzers continue to evolve, detecting peaks athigher and higher frequencies.As vibration analysis becomes more sophisticatedand training thus becomes more complex, organizations too small to justify the cost of in-house equipment and staff training opt to outsource vibration monitoring, analysis and reporting.Some vibration analysis companies, like Marscher’s,perform on-site detailed vibration analysis of high-valuerotating machinery—a very valuable service for manycustomers. One of Marscher’s customers in Trinidadhad a steam turbine that was making an alarming noisewith associated shaking about every 10 minutes. Tosimply shut down and disassemble the turbine to determine the root cause would have taken several weeks ata cost of 250,000 per day, Marscher figures. Detailedvibration analysis was able to determine exactly whatthe internal problem was and provide the basis for aconfident recommendation that continued operationuntil the plant’s scheduled turnaround would not result in machinery failure. Because of this, the plant wasable to continue operation during its high-productionperiod and save about 8 million, Marscher explains.DATA COLLECTIONAND INTERPRETATIONA complete vibration analysis requires a full-spectrum vibration profile on horizontal, vertical and axialaxes—on both ends of the motor and the full piece ofequipment. Some problems only show up on one axis.If maintenance workers take a reading on only one axis(as they often do) they’ll miss a pending failure on another axis.T R I B O LO GY & LU B R I CAT I O N T EC H N O LO GYW W W. ST L E .O RG
Since not all equipment operates at the same speed,looking at the vibration signature in relation to multiples of the rotating speed will simplify analysis. Rotor imbalance, for instance, usually shows up at rotating speed; while mechanical problems—such as a bentshaft, a bad coupling or an oversized bearing housing—tend to appear at 2x rpm.1Vibration frequencies at higher multiples of the rotating speed correspond with the number of components in a specific rotating part, such as the number ofballs in a bearing.Vibration needs to be examined when the naturalfrequency of the entire assembly suddenly becomesclose to the vibrating frequency of one part. This ismost likely to occur when a new part with slightlydifferent dimensions than the part it’s replacing is installed. Other causes of a frequency change are earlystructural damage or failure.Variable-frequency drives make interpreting datamore difficult, since inverter-driven induction motorstend to operate significantly below the manufacturer’srecommended speed. Frequency variation also makeselectrical problems more difficult to diagnose.Since concrete is prone to deterioration (especiallywhen it’s exposed to outdoor extremes), a defectivefoundation should always be one of the first considerations. Axis-specific problems caused by a problemrelated to the machinery’s base are indicated by a highvertical reading. This may signify loose base-bolts, aloose structure or a separating sole plate. High horizontal readings are commonly associated with imbalancein the rotating elements.High axial readings generally indicate misalignment.The cause may be external, like coupling misalignment,or internal, like a bent shaft. Looseness may be causedby a worn coupling, an oversized bearing housing or—with a sleeve bearing motor—excess bearing-to-shaftclearance.2Experts suggest keeping a file on critical equipment,especially complex machinery. The file should includeinformation on bearing brands and sizes, fan bladesand rotor bars and a count of gear teeth.Pairing vibration analysis with oil analysis is becoming more common in some industries and applications.Where there is expensive and/or complex machinery,vibration analysis combined with oil analysis is a must.TEST SYNERGYVibration analysis and oil analysis are widely acknowledged as the best methods for monitoring equipment.The two techniques feature complementary strengths.Basically, vibration analysis monitors and controls bal12Vibration analysis picks up increases invibration levels that are too slight for theear to detect or the hand to feel.ance, alignment and looseness, while oil analysis monitors lubricant quality and contamination, wear metalsand alloys, rate of wear and also qualifies the type andsize of wear particles generated through the use of analytical ferrography. Oil analysis does not control lubricant quality or contamination. Sometimes one technique will indicate a vague problem that the other canpinpoint.Vibration analysis is an excellent technology fordetecting certain types of issues in certain types ofequipment. It’s best at detecting failures in high-speedbearing systems and often better than oil analysis atspecifying the point of failure. While oil analysis cannot detect resonance, vibration analysis can.In other applications, oil analysis alone will produceadequate and accurate results. Oil analysis is generallybetter at uncovering failures in gearboxes, reciprocating equipment and hydraulic systems. It’s also better atdetermining which wear mechanism is causing the failure. Vibration analysis has limited success in detectingoil lubricated bearing wear, whereas oil analysis doesthis spectacularly.Oil analysis excels at providing clear and timelyinformation on specific types of wear and equipmentconditions. It’s the best indicator of gear problems andPlant Services, full article at: l?page full.IbidW W W. ST L E .O RGT R I B O LO GY & LU B R I CAT I O N T EC H N O LO GYAUGUST 2011 43
more effective than vibration analysis for motors biggerthan 1,000 HP—one reason why it’s the technology ofchoice for fleet industries. In many cases, oil analysis isthe leading indicator of existing and ongoing machinewear. Because vibration analysis doesn’t monitor lowspeed machinery well, oil analysis is the better choicein those applications.Mark Minges, chief operating officer for POLARISLaboratories in Indianapolis, says, “Oil analysis provides an earlier means of detection and can identifywear and contamination issues, fluid degradation orconfirm that the wrong lubricant is being used—i.e.,a hydraulic fluid has been used in a system requiringgear oil.”“In a gearbox, oil analysis can tell you a gear is wear-Rotating structures areprime candidates forvibration analysis.3ing, but vibration analysis can pinpoint which gear ina gearset where multiple gearsets are lubricated by acommon reservoir,” Minges adds. “Vibration analysiscan detect where a problem is occurring (a defect witha specific bearing or gear) and can identify mechanical problems such as improper alignment or situationswhere the equipment is not properly secured or bolteddown.”When both technologies are used in conjunctionand pinpoint the same problem, the diagnosis and follow-up recommendations are nearly always accurate.Often one technology will pinpoint or predict the specific problem area while the other will pinpoint or predict the type of failure.Although the correlation between oil analysis andvibration analysis is generally strong,sometimes one test indicates a problem andthe other does not (or they contradict eachother). The negative correlation betweensliding wear and vibration rate is an example. Another example is a fractured geartooth, which vibration analysis can easilydetect, but because of the large fragmentsize, oil analysis usually cannot.Marscher says that imbalance and misalignment account for roughly 80% of machinery shaking problems and associatedbearing, seal and coupling failures. “Vibration analysis is ideal for identifying imbalance and most situations of misalignment,”he says. “Oil analysis also can pick up theseproblems if they lead to excessive force atthe bearings which is often—but not always—the case. Even when oil analysispicks these issues up, however, it typicallywill not do so as quickly as appropriatetypes of vibration monitoring can.“Also, vibration can be evaluated interms of its ‘frequency content,’ which provides direct clues concerning what the specific reason for the problem is, Marscheradds. “For example, if the vibration frequency is 1x running speed, it is very likelythat the vibration is due to imbalance. Vibration analysis generally picks up rubbingimpact problems better than other forms ofcondition monitoring unless the rub and/orimpact is in the bearing, in which case oilanalysis would also be a good indicator.”However, Minges adds that, “Rubbingwear can be detected at very early stagesthrough wear debris analysis such as analytical ferrography.”Bryan Johnson, full article at: nalysis-power-generation.44 AUGUST 2011T R I B O LO GY & LU B R I CAT I O N T EC H N O LO GYW W W. ST L E .O RG
JOINT OIL &VIBRATION ANALYSISThe Palo Verde Nuclear Generating Station in Wintersburg, Ariz., pioneered the integration of the two condition monitoring technologies. Facility personnel combined both analyses into a single division and broughtits oil analysis on-site. After conducting a results assessment, the researchers concluded that oil analysiswas responsible for 40% of the defects found, vibrationanalysis was responsible for 33%, and both techniquesconverged on the remaining 27% of the defects found.The predictive maintenance department documented approximately 3.7 million in savings in one year.Over a three-year period, they figured that for everydollar spent on these condition monitoring techniques,they saved at least 6.50 in maintenance costs.3The School of Engineering at Australia’s James CookUniversity conducted a research project to investigatethe correlation between vibration analysis and wear debris analysis. The school’s researchers built an experimental worm gearbox driven by an electric motor. Thechoice of a worm gear for this study was designed tomimic real-world conditions—both rolling and/or sliding wear processes are common in industrial rotatingequipment. This would allow the replication of bothtypes of mechanical friction in one experimental testrig. They then conducted a series of studies on the device, utilizing different machine defect conditions under controlled operating conditions. Wear debris analysis data was then compared with vibration analysis datain order to quantify the effectiveness of both vibrationanalysis and wear debris analysis in predicting and diagnosing equipment conditions.They employed proven wear debris analysis technologies—a high-quality particle analyzer, a confocal laserscanning microscope (CLSM) and an electron probemicroanalyzer. Three tests were conducted under thefollowing conditions:Test 1: Normal operationTest 2: Lack of proper lubricationTest 3: Contaminant particles in the lubricating oilOil samples and vibration data were collected regularly. Wear debris analysis included the study of particle concentration and size distributions, along withthe examination of particle morphology and types todetermine possible wear mechanisms, wear rates andwear sources. Vibration analysis consisted of analyzingboth the time and frequency vibration signals from thetest rig to determine the onset and severity of activewear, and to help diagnose the root cause.445Researchers collected an oil sample each week fromeach of the three tests during 18 weeks. Each oil samplewas scrutinized and compared. A particle analyzer wasused to determine oil sample particle concentrationsin order to assess gearbox condition trends. Both weardebris and vibration analysis techniques were used toassess the gearbox condition and diagnose problemsduring the three tests.Following are the results:Test 1: The results from wear debris analysis indicated a normal condition with a slightly high number ofwear particles due to roughening gear surfaces near theend of the test.Test 2: Both methods discovered the lack of lubrication problem between the gear surfaces, although thewear particle analysis gave a more conclusive result.The presence of severe sliding particles from metal-tometal sliding was a good indicator of inadequate lubrication.Test 3: Wear debris analysis found a large number ofwear particles with a relatively smooth surface. Becauseiron powder was involved in the wear process and itsform was modified, the wear process may be called athree-body rubbing wear process. In contrast to normalthree-body wear processes, which include hard contaminants such as sand, the three-body wear process inthis study did not generate cutting particles associatedwith cutting wear. It did, however, generate significantwear debris. The iron particles accelerated the wearprocess. Vibration analysis confirmed the wear processdue to the increase in the peak at the shaft runningspeed, and the presence of a mound of energy near thebearing frequency.5Where there is expensive and/orcomplex machinery, vibration analysiscombined with oil analysis is a must.Researchers concluded that vibration analysis provided quick and reliable information on bearing condition, and wear debris analysis provided solid information on the wear rate and gear mechanism. Integrationof these two condition monitoring techniques in allthree worm gearbox tests provided a nearly completepicture of the operating condition.Marscher says, “Combined vibration plus oil anal-Study particulars at: louPeng/IntegratingVibration.htm.Ibid46 AUGUST 2011T R I B O LO GY & LU B R I CAT I O N T EC H N O LO GYW W W. ST L E .O RG
ysis is ideal for applications where sliding is inherentin the system. For example, reciprocating piston ringsor where bearing stiffness is extremely high—machinetools are a good example.”SPECIFIC APPLICATIONSSome applications are better candidates for integratedcondition monitoring than others. Three that are ofparticular interest to tribologists are gearboxes, reciprocating combustion engines and hydraulic systems.Gearboxes. The most common gearbox failure modesare gear tooth fractures and wear. Vibration analysishas trouble picking up these failures because they involve a cacophony of signals. Oil analysis, on the otherhand, can easily detect wear (abrasive and adhesive)and contact fatigue. Then there is the broken geartooth problem mentioned above—vibration analysiscan detect it, oil analysis often cannot because the debris falls to the bottom and never gets included in asample until it’s oxidized and dissolved metals leachinto the oil.Reciprocating combustion engines. While vibration analysis is the method of choice for monitoring grease-lubricated electric motors, oil analysis has always beenthe first choice for reciprocating combustion engines.For mobile plants, oil analysis is the primary conditionmonitoring tool for the entire drivetrain, but for fixedequipment, vibration analysis is useful for monitoringthe condition of other parts of the machine train—pumps and generators in particular.Hydraulic systems. While hydraulic systems vary enormously, oil analysis is the most prevalent technologyfor monitoring them. But where speed and load can befixed throughout the sampling procedures, vibrationanalysis is useful for some pumps and motors.Oil analysis detects early stage rolling element bearing failures better than vibration analysis, althoughboth tests will detect faults. This is a classic case where,when the two technologies are used together, the results are nearly always accurate. Also, experts agreethat both oil analysis and vibration analysis are neededto accurately detect and analyze root cause failure.OTHER TESTS AND TECHNIQUESIn addition to vibration analysis and oil analysis, thereare other tests that are sometimes conducted in conjunction with each other to ascertain equipment condition. These tests include visual inspections, thermography, ultrasonics and performance analysis.VISUAL INSPECTIONThis is the most primitive test, but when conductedby an experienced operator it can be one of the most6Creating an integratedcondition monitoring programAfter selecting technologies and developing a strategy,the condition monitoring team must be organized toimplement these technologies effectively. An auditdocument provides a good framework if it spells outhow to: Evaluate the knowledge and experience of condition monitoring team members. Assess the condition monitoring training theseindividuals have received. Evaluate condition monitoring instruments andsoftware tools currently in use. Appraise the effectiveness of each of the condition monitoring technologies implemented.Once that framework is in place, it will be most successful if:1. The entire condition monitoring team performing all technologies has been brought into onecommon area—allowing free information transferand improvement in the accuracy and reliabilityof diagnostic decisions as well as root causeanalysis.2. All condition monitoring personnel report toa single plant program manager who directlyreports to plant management.3. All condition monitoring personnel are crosstrained in at least one other condition monitoring technology, giving them greater confidenceand a more complete perspective.4. All condition monitoring personnel work fulltime in their field (they may occasionally assistin performing certain corrective actions but arenot expected to do this on a regular basis).5. All condition monitoring personnel receive formal training in their areas of expertise at leastone week per year in order to keep them up-todate and to further advance their knowledge.Source: James E. Berry, P.E., Technical Associates of Charlotte6Ibid, also referenced at: ry/ezine/vibes.html.W W W. ST L E .O RGT R I B O LO GY & LU B R I CAT I O N T EC H N O LO GYAUGUST 2011 47
effective. Issues such as leaking,cracking and rust often are readilyapparent. A side benefit is that thisis without a doubt the least expensive form of condition monitoring.THERMOGRAPHYAlthough slight surface temperature variations are easy to spot, another more comprehensive optionis non-destructive thermography.The basic premise is that heat indicates failing components, particularly electrical contacts and terminals. Thermography also workswell for detecting the level of deposit build-up in storage tanksand analyzing the condition ofcouplings, rollers and high-speedbearings. “Using thermography inconjunction with oil and vibrationanalysis provides the best diagnostic evaluation,” Minges says.‘While both vibration analysis and oil analysis havetheir merits, they are most valuable when used inconjunction with one another.’ULTRASONICSDigital meters measure high frequency signals from bearings anddisplay the result in dBuVs (decibels per microvolt).Using trend analysis, these values will flag potentialbearing defects caused by contact conditions such asrubbing and friction. The dBuV value is also used topredict proper intervals for relubrication. Ultrasoundpairs particularly well with vibration analysis.PERFORMANCE ANALYSISThis involves comparing actual operating statisticswith the manufacturer’s original parameters, which areusually posted on the machine’s nameplate.There are other intriguing technologies currently inlimited use such as motor current analysis and stresswave analysis. On the horizon are embedded wear debris detection sensors and embedded vibration detection sensors that monitor conditions around the clockand continuously supply data, and analysis feedback.If used correctly, this technology has the potential tonearly eliminate failure and downtime caused by gradually occurring conditions.IN THE ENDMany considerations are involved in choosing whichcondition monitoring method(s) to use, with cost vs.benefit being primary for most organizations. Whilemost condition monitoring providers have traditionallyoffered one technology, this is changing. Today morecompanies are offering a full spectrum of tests creating48 AUGUST 2011an economy of scale and thus lowering costs to customers.So how do users decide if a piece of equipmentshould be tested by more than one method? There arethree factors: (1.) the applicability of the test to thattype of equipment, (2.) the importance of the equipment to operations and (3.) the equipment’s replacement cost.When it comes to in-house testing, aside from cost,the main roadblock to employing both oil analysisand vibration analysis simultaneously is that the twomethods are typically performed by two disparate divisions—with vibration analysis performed by thecondition/vibration monitoring team and oil analysisperformed by the lubrication team. This means thattechnicians in the two areas tend to be isolated fromeach other. Ideally, both types of analysts should worktogether in a unified program, with each having a foundational knowledge of the other technology.Minges concludes, “While both vibration analysisand oil analysis have their merits, they are most valuable when used in conjunction with one another.”
VIBRATION ANALYSIS, The idea behind vibration analy- sis is that each piece of equipment has its own unique vibration signature. Once that signature is established, any variation is cause for concern. Mechanical defects produce characteristic vibrations at different frequen- cies. Specific vibrations relate to specific machine fault conditions.