Transcription
Indicator LabFibonacci Tools 2019 Charles Schwab & Co., Inc. (“Schwab”).All rights reserved. Member SIPC. [0517-7CPH]
Important informationThe information provided here is for general informational purposes only and should not be considered an individualizedrecommendation or personalized investment advice. The investment strategies mentioned here may not be suitable foreveryone. Each investor needs to review an investment strategy for his or her own particular situation before making anyinvestment decision.Short selling is an advanced trading strategy involving potentially unlimited risks, and must be done in a margin account.Margin trading increases your level of market risk. For more information please refer to your account agreement and theMargin Risk Disclosure Statement.All expressions of opinion are subject to change without notice in reaction to shifting market conditions.Schwab does not recommend the use of technical analysis as a sole means of investment research. Past performance isno guarantee of future results. 2019 Charles Schwab & Co., Inc. (“Schwab”). All rights reserved. Member SIPC. [0517-7CPH]
Today we’ll discuss010203Fibonacci numbersand ratiosFibonacci toolsin StreetSmart Edge Using Fibonacci toolsfor trading Short selling is an advanced trading strategy involving potentially unlimited risks, and must be done in amargin account. Margin trading increases your level of market risk. For more information please refer toyour account agreement and the Margin Risk Disclosure Statement. All expressions of opinion are subject to change without notice in reaction to shifting market conditions.
01Fibonacci numbersand ratios
Fibonacci numbersThe Fibonacci series waspopularized by Leonardo dePisa (nickname Fibonacci),a 13th Century Italianmathematician.The Fibonacci series startswith the numbers 0 and 1. The rest of the sequenceis formed by adding theprevious two numbers toget the next one. 0, 1, 1, 2, 3, 5, 8, 13, 21,34, 55, 89, 144, 233, 377
Fibonacci ratiosOne of the mostfascinating aspects ofthe Fibonacci series isthe ratio betweenconsecutive numbers. The ratios between each twoconsecutive numbers are 1, 0.50, 0.666,0.60, 0.625, 0.615, 0.619, 0.618, 0.618,0.618 (and its inverse 1.618) And the ratio between alternatenumbers is 2.616 (and its inverse .382) 1.618 is known as the Golden Ratio orthe Golden Mean, and is foundthroughout nature, music and art The most common ratios used in tradingare .382, .50 and .618
Fibonacci retracementsIt is a common observation that markets andstocks on the move often retrace a portion oftheir most recent move before starting a newadvance/decline.Traders often use Fibonacci ratios to estimatewhere a retracement might stop.
Retracement ratiosStrongly trending stocks may retrace 38.2%, 50% or even61.8% of their previous move and still recover.However, many traders believe that, if the retracement isgreater than 61.8%, the trend is likely over and the entiremove may be reversed.
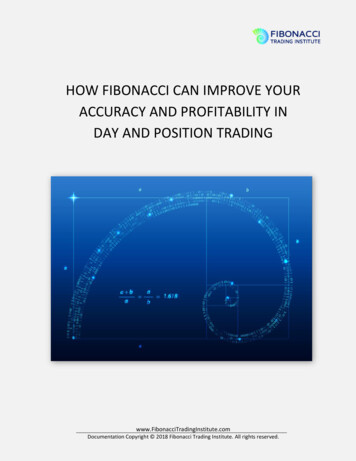
Retracement levelsUptrend move:17.60 to 27 9.4 ptsStrong, fast movestend to reverse at the23.6% or 38.2%levels.More moderate,slower moves tend toreverse at the 50% or61.8% levels.Retracement:27 to 22.30 4.7 pts
02Fibonacci tools in StreetSmart Edge
Fibonacci tools in StreetSmart Edge Fibonacci tools areaccessed through thechart’s “Draw” menu.There are three tools thatutilize Fibonacci ratios: arc retrace fan
Fibonacci retracement trendlinesThe trendline tool addshorizontal retracementlevels to the chart.To use it, identifywhere the initial movestarts and ends.To identify where to startthe move, look for an“isolated” high or low. An isolated low is a low witha higher low on each side An isolated high is a high witha lower high on each side
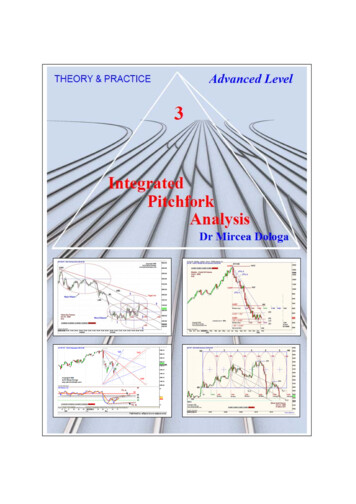
Drawing Fibonacci retracement trendlinesIsolatedhighthe stockthen retracedalmostexactly 38.2of theprevious upmoveIsolatedlow
Fibonacci fan linesFibonacci fan lines areconstructed by drawingan invisible vertical linebetween the two extremepoints of the move.The tool then extends the fanlines from the first extremepoint so that they intersectthe “invisible” vertical line atthe Fibonacci levels.These fan lines canpotentially act as supportand resistance.
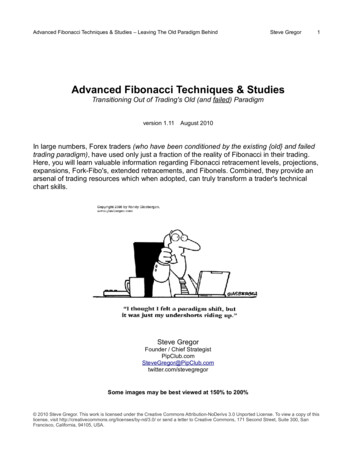
Drawing Fibonacci fan linesFan lines createtrendlines intersectingthe invisible vertical line.(Peak) high in MarchInvisible vertical lineintersected by fan lines(Trough) low in JanuaryFan lines can act asareas of support
Fibonacci arcsThe interpretation of thearcs generally involvesanticipating support andresistance as pricesapproach the arcs. Fibonacci arcs are displayed bydrawing a trend line between twoextreme points (peak and trough) Then the arcs are drawn, centeredon the second extreme point andintersecting the trendline at theFibonacci levels of 38.2%, 50.0%and 61.8%
Drawing Fibonacci arcsSupportSupport
Combining fan lines and arcsArcs are oftenused inconjunction withFan Lines.Anticipate supportand resistance levelswhere the Arcs andFan Lines intersect.Support
03Using Fibonaccitools for trading
Tips for using Fibonacci toolsLook for other signs of reversal at Fibonaccisupport and resistance levels. Candlestick signals Confluence Extreme readings on other indicators, especially oscillators
Candlestick signalsDojiReal body is a lineopen and close pricesare equal. Shadows vary Inlength. Signals a potentialtrend reversal. Spinning TopSmall real body. Long upper and lowershadows. Signals a potentialtrend reversal. HammerSmall real body ator near day's high. Long lower shadow. Signals a potentialbottom In a downtrend. A "Shooting Star" is aninverted hammer, apossible uptrend top. Engulfing Pattern Real body "wrapsaround" prior day'sreal body.Signals a potentialtrend reversal-bullishwhen white wrapsaround red; bearishwhen red wrapsaround white.
Fibonacci and candlesticksStock forms a hammer, asit tests the 61.8% Fibonacciretracement level.
Fibonacci confluenceTwo moves ending atthe same swing high inearly April.When the retracementlevels from both moves linedup, they offered goodsupport for the stock as itpulled back in mid April.
Fibonacci and RSIWhen the stock is aroundthe 61.8% retracement levelin early June, the stock isalso extremely oversold, asshown by the RSI indicatorbeing below 30.
? Quiz
Question 1 – True or False?Fibonacci techniques can onlybe used on daily charts.
Question 2 – Multiple ChoiceWhich is not a Fibonacci retracement level?ABCD61.8%50%75%38.2%
Question – Multiple ChoiceWhich is not a Fibonacci retracement level?A61.8%BC50%75% is not aFibonacciretracement level.is falseD38.2%
Talk to a SpecialistGet priority access to trading support1.800.435.9050Sharpen your skills in the Schwab Learning Centerschwab.com/learningcenterView more of our Live webinar offeringsschwab.com/liveonline
Fibonacci numbers and ratios 02 Fibonacci tools in StreetSmart Edge 03 Using Fibonacci tools for trading Short selling is an advanced trading strategy involving potentially unlimited risks, and must be done in a margin account. Margin trading increases your level of market risk. For more information please refer to