Transcription
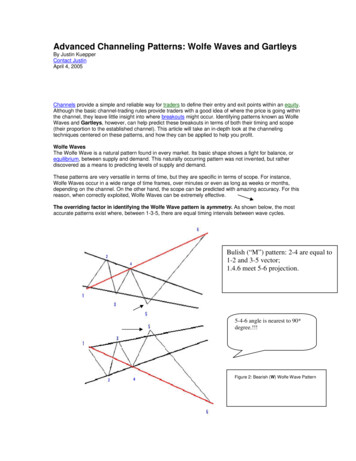
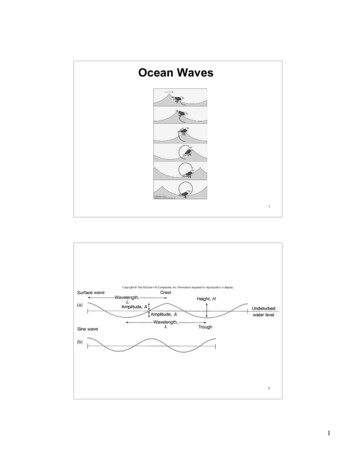
Standing WavesPhysics Lab IObjectiveIn this series of experiments, the resonance conditions for standing waves on a string willbe tested experimentally.Equipment ListPASCO SF-9324 Variable Frequency Mechanical Wave Driver, PASCO PI-9587B DigitalFrequency Generator, Table Rod, Elastic String, Table Clamp with Pulley, Set of 50 gand 100 g Masses with Mass Holder, Meter Stick.Theoretical BackgroundConsider an elastic string. One end of the string is tied to a rod. The other end is undertension by a hanging mass and pulley arrangement. The string is held taut by the appliedforce of the hanging mass. Suppose the string is plucked at or near the taut end. Thestring begins to vibrate. As the string vibrates, a wave travels along the string towardthe fixed end. Upon arriving at the fixed end, the wave is reflected back toward the tautend of the string with the same amount of energy given by the pluck, ideally.Suppose you were to repeatedly pluck the string. The time between each pluck is1 second and you stop plucking after 10 seconds. The frequency of your pluck is thendefined as 1 pluck per every second. Frequency is a measure of the number of repeatingcycles or oscillations completed within a definite time frame. Frequency has units ofHertz abbreviated Hz.As you continue to pluck the string you notice that the set of waves travelling backand forth between the taut and fixed ends of the string constructively and destructivelyinteract with each other as they propagate along the string. The wave patterns moveleft to right and right to left from end to end as a result of constructive and destructiveinteractions for the given frequency (1 pluck per second). At certain frequencies howeverthe interaction between the waves from either end is not present and the resulting wavepattern is a standing wave. Standing waves occur when there is no left or right motion
2Standing Wavesof the wave patterns. Frequencies producing standing waves are resonant frequencies.Figure 1 shows the first and second set of standing wave patterns for a string held taut.Figure 1: Standing Waves on a StringAs shown on Figure 1, the stationary string positions in the standing wave patternare known as nodes, while the positions with maximum amplitude in the pattern areknown as antinodes. The first standing wave pattern is referred to as the fundamentalor first harmonic of the string. In this pattern, there are no nodes between the twoends of the string (the fixed ends are nodes for the pattern, though they are generallydisregarded since they are present in all the patterns). The next standing pattern, withone node between the two ends, is known as the second harmonic. Standing waves withmore nodes between the ends are higher harmonics (i.e. third harmonic, forth harmonic,etc.).It is possible to determine the resonant frequencies for standing waves on a string byconsidering some properties of the standing wave and the string. First notice that thedistance between two nodes represents half a wavelength, λ, of the standing wave, asshown as in Figure 1. The wavelength can be related to the length bounded by the twoends. This is the length of the string undergoing propagation, L. For the fundamental,one half of the full wavelength is contained within the bounds. For the second harmonic,one full wavelength is contained within bounds. The third harmonic would have twonodes, which would mean there would be one and a half wavelengths between the stringends. The progression of wavelengths can be expressed by the following mathematicalequation:2Ln 1, 2, 3 . . .(1)λn nIn this equation, λn is the wavelength of the standing wave, L is the length of the stringbounded by the left and right ends, and n is the standing wave pattern, or harmonic,number. For the fundamental, n would be one; For the second harmonic, n would betwo, etc. The resonant frequency can be found by using the relationship between thewavelength and the frequency for waves as shown in the following equation:v λf.(2)v:F06
Standing Waves3In this equation, v is the (phase) velocity of the waves on the string, λ is the wavelengthof the standing wave, and f is the resonant frequency for the standing wave. For waveson a string the velocity of the waves is given by the following equation:sv Tm, µ .µ (3)In this equation, v is the velocity of the waves on the string, T is the tension in the string,and µ is the mass density of the string given by the total mass of the string m dividedby the total length of the string . Note: includes the length of the string bounded bythe left and right ends and the length of the string stretched by the hanging mass.These relationships will be tested experimentally in this series of experiments.ProcedureFigure 2: Experimental ArrangementWave Velocity DeterminationIn this section, the propagation speed for waves on the stretched string used in this seriesof experiments will be determined.1. Place 200 g on the mass holder which is draped over the table. Record the massof the hanging weight on your data sheet as M ; Be sure to include the mass of thehanger.2. Measure the length of the stretched string from the end of the wave driver to thecenter of the pulley. Record this length on your data sheet as L.3. With the power turned off, turn the amplitude on the frequency generator down toits minimum setting. With the amplitude at its minimum setting, turn the poweron and set the range to 100.00 Hz. Do this by pressing the down arrow (5) onthe function generator.v:F06
4Standing Waves4. Turn the frequency adjustment down until the frequency display reads about 5 Hz.5. With the frequency adjustment set to 5 Hz, turn the amplitude adjustment to halfway between the minimum and maximum value.6. Increase the frequency until the fundamental standing wave mode is excited on thestring. Continue increasing the frequency until this mode reaches its maximumamplitude value. Note, the amplitude referred to here is measured qualitatively.You should see the height of wave pattern increase as the frequency increases.The maximum frequency value corresponding to the maximum height of the stringshould be recorded. It is important that the amplitude adjust knob on the frequencygenerator remains fixed.Frequency as a Function of WavelengthIn this portion of the lab, the frequency the higher harmonic modes will be measuredexperimentally.1. With the string vibrating in the fundamental standing wave mode, continue increasing the drive frequency to find the higher harmonics. With each of the harmonicsat maximum amplitude, record the frequency displayed on the frequency generatoron your data sheet as fexp .2. Estimate and record the uncertainty in the length of the string and the uncertaintyin the frequency.Data AnalysisWave Velocity Determination1. Use the mode number (n 1) and the string length L to calculate the wavelengthof the standing wave λ.2Ln 1, 2, 3 . . .(4)λn n2. Use the wavelength λ and the measured resonant frequency of the standing wavef to calculate the wave speed v.v λf.(5)3. Use the mass of the hanging weight M to calculate the tension T in the string,then use this tension and the wave velocity v to calculate the mass density µ of thestring.sT.(6)T M g, v µv:F06
Standing Waves5Frequency as a Function of Wavelength1. For each standing wave mode n, use the length of the string L to calculate thewavelength of the standing wave λ.λn 2Ln 1, 2, 3 . . .n(7)2. For each wavelength, use the wave velocity calculated previously to calculate andrecord the theoretical value of each standing wave frequency ftheo .v λf.(8)3. Calculate the percent difference between experimental value and theoretical valueof the resonant frequency.4. From the theory for resonance on string, it can be shown that each of the harmonics is an integer multiple of the fundamental. Test this relationship by takingeach experimentally measured frequency and divide by the fundamental frequencymeasured previously.fexpfn nf1 nexp .(9)f15. Graph the experimental frequency fexp as a function of the inverse of the wavelength 1/λ, also known as the wave number k. Draw the line that comes closest tothese data point, and determine the slope and y-intercept of this line.6. Calculate the percent uncertainty in the length and the frequency using the following equation:% uncertainty 100 measurement uncertainty.smallest measured value(10)7. From the percent uncertainty in the length and frequency, determine the largestpercent uncertainty in the experiment.Selected Questions1. If additional mass had been added to the hanger, the string would have stretchedmore and the total length of the string would have increased. What effect wouldthis have on the following: the mass density µ, the wave velocity v, the standingwave wavelength λ, and the standing wave resonant frequency f ?2. Instead of using v λfq to determine the wave velocity a method involving thealternate formula, v T /µ, could have been used: measure and record the totalmass and length of the string, calculate µ, measure and record the hanging mass,calculate the tension, calculate the wave velocity. Why is this a less than ideal wayto determine the wave velocity for this experiment? (Hint: Consider the previousquestion.)v:F06
Standing Waves 5 Frequency as a Function of Wavelength 1. For each standing wave mode n, use the length of the string L to calculate the wavelength of the standing wave ‚. ‚n 2L n n 1;2;3::: (7) 2. For each wavelength, use the wave velocity calculated previously to calculate and