Transcription
IJSRD - International Journal for Scientific Research & Development Vol. 4, Issue 04, 2016 ISSN (online): 2321-0613Productivity Improvement by Root Cause Analysis in ManufacturingIndustryPankaj Basu1 Avinash Nath Tiwari2Research Scholar 2Assistant Professor1Department of Production Engineering 2Department of Mechanical Engineering1,2Jagannath University, Jaipur, Rajasthan, India1Abstract— Now a days PC meter box cover is used in aevery house, shops, industries etc. Because of this meter boxcover manufacturing industries facing greater competition inthe market. PC meter box cover is manufactured byinjection moulding process. Various defects found duringmanufacturing of PC meter box cover. Different defects aresilver mark, short, flash, brittleness, voids anddiscolouration. These defects leads to quality problems. Themain objective of this study to find major problems and alsofind out remedies by which these defects can be reduced.Key words: PC (Polycarbonate) Meter Box Cover, Cause &Effect Diagram, Pareto Chart, Attribute Defects in InjectionMoulding, Root Cause AnalysisI. INTRODUCTIONNow a days injection moulding process is reached at greatextent. Many new firms are opened in recent time. Due tothis competition level is increased day by day and also thefocus is more on the quality area. Injection moulding is amanufacturing process by which the moulded parts can beobtained. In this process hot molten metal is poured intocold cavity of a desired shape under high pressure. Injectionmoulding process requires the injection moulding machine,raw plastic material and mould to complete the process.Common defects that come from meter box cover part aresilver mark, short, flash, brittleness, voids anddiscolouration. These defects generally come from severalsources including different plastic resins, selection ofmoulding machine & the setting of different processparameters. A study is carried out of two plastic productsmanufacturing company. These companies are involved inproduction of meter box cover over the years. The materialused to produce the meter box cover in Ist industry isreprocess material of polycarbonate and on the other hand inIInd industry 75% is reprocess material and 25% is virginmaterial of polycarbonate. The dryer is used before themoulding for 2 to 3 hours. MAGNA MIG275 injectionmoulding was used for the manufacture of PC meter boxcover. The data was collected from both the industries forperiod of two months from actual production line and bythis different type of defects are found during themanufacturing of meter box cover and remedies weresuggested.II. LITERATURE REVIEWWilson et al. (1993) have defined the root cause analysis asan analytic tool that can be used to perform acomprehensive, system-based review of critical incidents. Itincludes the identification of the root and contributoryfactors, determination of risk reduction strategies, anddevelopment of action plans along with measurementstrategies to evaluate the effectiveness of the plans.Dew and Sproull state that identifying andeliminating root causes of any problem is of utmostimportance. Root cause analysis is the process of identifyingcausal factors using a structured approach with techniquesdesigned to provide a focus for identifying and resolvingproblems. Tools that assist groups and individuals inidentifying the root causes of problems will continue toexist.According to Duggett several root cause analysistools have emerged from the literature as generic standardsfor identifying root causes. Some of them are the why whyanalysis, multi vari analysis. Cause-and-effect diagram(CED), the interrelationship diagram (ID), and the currentreality tree (CRT). He has added that why why analysis isthe most simplistic root cause analysis tool where as currentreality tree is used for possible failures of a system and it iscommonly used in the design stages of a project and workswell to identify causal relationship. There is no shortage ofinformation available about these tools.Geno has presented some insight into thecomparison of common root cause analysis tools andmethods. He indicates that there are some comparativedifferences between tools and method of RCA. He hasadded that tools are included along with methods becausetools are often touted and used as a full-blown root causeanalysis.Kiran M has identify the major breakdownscausing the production loss to the company. Root causeanalysis was conducted for the improvement in theproduction. Root causes of breakdowns were identifiedusing cause and effect diagram. Counter measures andparallel improvement opportunities for major breakdownscausing production stoppage was also suggested.Vikas Tayal made an attempt to apply DMAICapproach in the plastic shop. On injection moulding processthe DMAIC approach is successfully implemented. DMAIChas been considered as a revolutionary approach to productand process quality improvement, improved overallmanagement performance and also inherent discipline within the DMAIC approach provides structure and a visibleroad map for work force to systematically create newknowledge.Krunali R. Charpe suggested that the temperaturesand pressure parameters of an injection moulding machineplays a vital role in product configuration. In this way wecan say that problems caused by these parameters has aneffect on the life of rotating screw for injection mouldingmachine and the problem occurred in the rotating screw ofmachine which is wearing of threads due to effect oftemperature of mold materials and using 30% glass filledmaterials. Directly affects the quality of the componentsmanufactured by injection moulding machine.All rights reserved by www.ijsrd.com36
Productivity Improvement by Root Cause Analysis in Manufacturing Industry(IJSRD/Vol. 4/Issue 04/2016/010)Brown has used the root cause technique to analyzethe assembly of commercial aircraft. He has concluded thatit is the most effective tool to eliminate the causes in mostvital assemblies like aircraft, where utmost safety andreliability is needed.Arcaro has presented various tools for identifyingroot causes. He describes that RCA techniques areconstrained within domain and give a detailed tutorial bysupporting theoretical knowledge with practical experiences.He states that all RCA techniques may not be applicable forall processes.Cox and Spencer have advocated that RCA toolseffectively give solution to handle constraints and arrive atan appropriate decision. Like Cox and Spencer, Dettmer hasalso used root cause analysis on management of constraints.He presents one of the earliest studies on the debate ofapplying root cause analysis to processes. A propermanagement decision is necessary to succeed the RCA toolsand methods in a particular environment.Lepore and Cohen move ahead that when change isneeded, then think root cause analyzing, identifying andeliminating. The foundations of their studies are pioneeringone as they question an accepted practice for root causeanalysis and the result of the example studies areencouraging. However, the studies are far from beingpractical one as they include too many parameters andassumptions.Vikash Dwivedi focuses on the qualityimprovement of one of the major defect in plastic injectionmoulding of components. One of the main defect which isthe causes of rejection is “Black specks”(small darkparticles on the surface of the opaque parts), on theappearance of the product. The objective of this study is toidentify the problem of black specks, which reduces quality,due to defects in manufactured parts, and to suggestmeasures for the improvement in the injection mouldingoperation using six-sigma DMAIC methodology.D. Mathivanan suggested a simple and efficientway to study the influence of injection moulding variableson sink marks using Taguchi approach. Application ofTaguchi approach also helps in arriving at optical parametersettings. The sink depth through the validation trials basedon the optical parameters and the predicted sink depth usingTaguchi’s approach for the same settings are found to be ingood agreement. The result shows the ability of thisapproach to predict sink depth for various combination ofprocessing variables with in the design space.S.R. Vijayakumar suggested that, it is essential fora company to improve the production rate and quality of theproducts. In order to achieve this, the overall effectivenesswas improved with low machine breakdown, less idling andminor stop time, less quality defects, reduced accidents inplants, increased the productivity rate, optimised processparameters, worker involvement, improved profits throughcost saving method, increased customer satisfaction andincreasing ing the manufacturing process, process mappingand current situation of the company, it is found out that themajor problem in the process are defect that appeared on themoulded parts. All in all, the objective of this research is toreduce the moulded defect parts from the black dot type inplastic injection moulding process, and use selectedinjection moulding machines as a pilot. To achieve thisobjective, an effective cross-functional project team is thenformed to support and brainstorm to identify the potentialcause of the black dot issue.III. METHODOLOGYThe manufacturing industries have gone through significantchanges in the last decade. New firms in markets haveincreased competition dramatically. Most of them focus onproduct quality, production time and cost of product.Because of these, a company should introduce a qualitysystem to improve and increase both quality andproductivity continuously. Root cause analysis (RCA) ismethod of problem solving that tries the root cause of faultsor problems that cause operating events. RCA practice triesto solve problems by attempting to identify and correct theroot cause of events, as opposed to simply addressing theirsymptoms. By focusing correction on root causes, problemrecurrence can be prevented. Root cause analysis forreducing the breakdowns in the company’s manufacturingunit is conducted. The objective of study is to find out themajor breakdowns in the company which ccauses aproduction loss and to suggest counter measures tominimize the effect. Even after producing 24 x 7, thecompany is not able meet its demand in the market. So firmhas to reduce the unwanted stoppages of production so as tomaintain the steady production level and to meet thedemands in the market. Production may be stopped due tomany reasons like breakdown of machine, maintenancework, labour issue, insufficient material supply, problems inthe method of production etc. Excluding all other factorslike material, method, man, etc. It is necessary to reducethe breakdown of machine or equipment’s in the companyfor the efficient nonstop production to meet the demands.Breakdowns are the most common cause of efficiency lossin manufacturing. Eliminating unplanned down time iscritical to improving overall equipment efficiency. It is notonly important to know how much down time your processis experiencing but also to be able to attribute the lost timeto the specific source or reason for the loss.The root cause analysis is a four step process involving thefollowing:1) Data collection2) Cause charting3) Root cause identification4) RecommendationAll rights reserved by www.ijsrd.com37
Productivity Improvement by Root Cause Analysis in Manufacturing Industry(IJSRD/Vol. 4/Issue 04/2016/010)Fig. 1:IV. DATA COLLECTION AND ANALYSISA. Data CollectionDefects data collected consist of mainly defects that occurin a manufacturing of PC meter box cover . But our area ofinterest is the defects causing production loss. The defectscausing stoppages of production process were identifiedfrom the data.Defects data collected are:1) Silver mark2) Short3) Flash4) Brittleness5) Voids6) Discoloured1) Data Collection of Industry A(Out of 500pics.)SDEFECTSFirst Monthno.FREQUENCYSilver ion 3(Out of 600pics.)Second MonthFREQUENCY45382722147Table 1: Data Collection of Industry A2) Data Collection of Industry B(Out of 1800(Out of 2200pics.)pics.)SDEFECTSFirst MonthSecond Monthno.FREQUENCYFREQUENCY1.Silver 5Voids1219Discolouration814Table 2: Data Collection of Industry ba)Data of Industry AFirstSecondMonthMonthTotal Production1500018000Total no. of defective parts29104590Percentage of Defective Parts1925(%)Table 3: Production Data of PC Meter Box Cover of TwoMonthsFirstSecondS no.Defects%%MonthMonth1.Silver tion9032105Table 4: Type of Defects Identified In PC Meter Box CoverDuring the Two Monthsb)Data of Industry BFirstSecondMonthMonthTotal Production5400066000Total no. of defective parts55808610Percentage of Defective Parts1013(%)Table 5: Production Data of PC Meter Box Cover of TwoMonthsFirstSecondS no.Defects%%MonthMonth1.Silver mark1950 352730312.Short1560 28231027All rights reserved by www.ijsrd.com38
Productivity Improvement by Root Cause Analysis in Manufacturing Industry(IJSRD/Vol. 4/Issue 50125.Voids360657076.Discolouration24044205Table 6: Type of Defects Identified In PC Meter Box CoverDuring the Two MonthsB. Data analysisPareto chart was plotted based on the above data. Bothpareto charts A and B industry reveals that silver mark andshort were the major defects. It is found that these defectswere mainly responsible for the rejection and hence studywas focused on these defects. Pareto chart, where individualvalues are represented in descending order by bars, and thecumulative total is represented by the line. The left verticalaxis is the frequency of occurrence, and right vertical axis isthe cumulative percentage of the total number ofoccurrences. The purpose of the Pareto chart is to highlightthe most important among a (typically large) set of factors.Fig. 1: Cumulative rejection percentage based on the type of defect of industry A during First monthFig. 2: Cumulative rejection percentage based on the type of defect of industry A during Second monthFig. 3: Cumulative rejection percentage based on the type of defect of industry B during First monthFig. 4: Cumulative rejection percentage based on the type of defect of industry B during Second monthAll rights reserved by www.ijsrd.com39
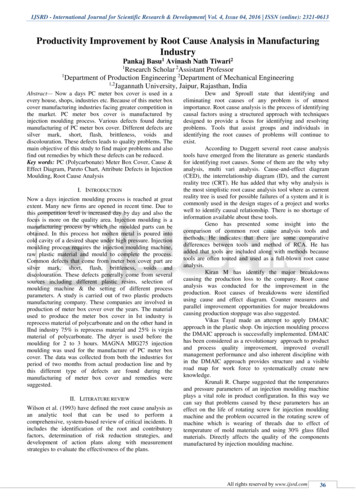
Productivity Improvement by Root Cause Analysis in Manufacturing Industry(IJSRD/Vol. 4/Issue 04/2016/010)C. Identifying Causes of Defects1) Root Cause Identification of Silver MarkSilver mark are a phenomenon in which shining line shapedpatterns appear on the surface of the molded product. Thesecan be considered external appearance quality defects inexterior parts of consumer electrical products, automobiles,motorcycles, etc. The cause of silver streaks is the air orgases contained in the molding material appearing on thesurface of the molded production.COLD SLAG WELLSMALLPROBLEM WITHDRYING EQUIPMENTINADEQUATEHOPPER CAPACITYLESS GATE SIZEENHANCING THEFUCTION OFF AIRVENTSSILVER MARKPAY ATTENSIONTRAININGMELT TOO HOTIMPURITIESSKILLATTITUDERESIDENCE TIMETOO HIGHFig. 5:in short shot and was identified as the root cause . Aging2) Root Cause Identification of Shortmachines and improper maintenance also can lead toMachines are one of the factors that can contribute a lot todefects. Experience of operator, condition of the mould tool,short shot moulding defect. Improper parameter setting likequality of material, contamination with foreign particles,low injection pressure, low injection velocity and shot sizepresence of moisture, insufficient pre heating etc. may alsoare some of the major machine parameters which will resultcauses defects.Fig. 6: CalculationFor 15000 pieces , the frequency of following defects willD. For Industry Abe in Ist month :1) Given1) Silver mark 32*30In first month production of meter box cover pieces per day 960 defects per month 500 960/15000 x 100For one month 500*30 6.4% defects from first month production 15000 pieces per month2) Short 28*30Ferquency of following defects in Ist month per 500 pieces 840 defects per monthis found by observations: 840/15000 x 100 5.6% from first month productionAll rights reserved by www.ijsrd.com40
Productivity Improvement by Root Cause Analysis in Manufacturing Industry(IJSRD/Vol. 4/Issue 04/2016/010)3) Flash 15*30 450 defects per month 450/15000 x 100 3% from first month production4) Brittleness 13*30 390 defects per month 390/15000 x 100 2.6% from first month production5) Voids 6*30 180 defects per month 180/15000 x 100 1.2% from first month production6) Discolouration 3*30 90 defects per month 90/15000 x 100 0.6% from first month productionTotalno.ofdefectsinIstmonth 960 840 450 390 180 90 2910Percentage of overall defective pieces in Ist month Total no. of defective pieces / total production * 100 2910 / 15000 * 100 19.4%Percentage of individual defects Total no. of individualdefects / total no. of defects * 1001) Silver mark 960 / 2910 *100 33%2) Short 840 / 2910 * 100 29%3) Flash 450 / 2910 * 100 15%4) Brittleness 390 / 2910 *100 13%5) Voids 180 / 2910 *100 6%6) Discolouration 90 / 2910 *100 3%In second month production of meter box cover pieces perday 600For second month 600*30 18000 pieces per monthFerquency of following defects in IInd month per 600 piecesis found by observations:For 18000 pieces , the frequency of following defects willbe in IIst month :1) Silver mark 45*30 1350 defects per month 1350/18000 x 100 7.5% from second month production2) Short 38*30 1140 defects per month 1140/18000 x 100 6.3% from second month production3) Flash 27*30 810 defects per month 810/18000 x 100 4.5% from second month production4) Brittleness 22*30 660 defects per month 660/18000 x 100 3.6% from second month production5) Voids 14*30 420 defects per month 420/18000 x 100 2.33% from second month production6) Discolouration 7*30 210 defects per month 210/18000 x 100 1.17% from second month productionTotalno.ofdefectsinIIstmonth 1350 1140 810 660 420 210 4590Percentage of overall defective pieces in IIst month Total no. of defective pieces / total production * 100 4590 / 18000 * 100 25.5%Percentage of individual defects Total no. of individualdefects / total no. of defects * 1001) Silver mark 1350 / 4590 *100 29%2) Short 1140 / 4590 *100 25%3) Flash 810 / 4590 *100 18%4) Brittleness 660 / 4590 *100 14%5) Voids 420 / 4590 *100 9%6) Discolouration 210 / 4590 *100 5%a)ThereforeAverage percentage defects of Ist and IInd month ( Ist month IInd month) / 2 ( 19.4 25.5 ) / 2 22.45%2) For Industry Bsame as industry Aa)ThereforeAverage percentage defects of Ist and IInd month ( Ist month IInd month) / 2 ( 10.33 13.06 ) / 2 11.70%V. RESULT AND DISSCUSIONThe main motto of this study is to identify major defectscausing the production loss to the company. The variousdefects found out in PC meter box cover were shorts, flash,silver mark, brittleness,voids and discolouration. By appyingthe RCA approach on PC meter box cover the followingresult were obtained:The rejection due to silver mark and shortmoulding are 6.4% and 5.6% from Ist month production ofindustry A and 7.5% and 6.3% from IInd month productionof industry A. By applying the RCA approach, precentage ofdefects were reduced. The rejection due to silver mark andshort moulding are 3.6% and 5.6% from Ist monthproduction of industry B and 4.1% and 3.5% from IIndmonth production of industry B and also the averagepercentage defects of total production from Ist and IIndmonth of industry A is 22.45% and on the other hand byapplying RCA approach the average percentage defects oftotal production from Ist and IInd month of industry B isreduces upto 11.70%.The methods by which silver mark and shortmoulding can be reduced are:A. Silver Mark Apply back pressure to genrate a kneading effectby which the silver mark deffect reduces.Slow down the injection speed.Change the gate location and thus reduces thesilver mark deffect.All rights reserved by www.ijsrd.com41
Productivity Improvement by Root Cause Analysis in Manufacturing Industry(IJSRD/Vol. 4/Issue 04/2016/010)B. Short Moulding Increase the injection speed by which the materialentering into the mold cavity increases whichminimize the short moulding deffect.Increases the shot size becauses the less shot sizemay result in short moulding.Increases the material temperature becauses if thetemperature is too low, there might be chances ofplastic granules stuck at the nozzle and makehindrance to the flow of molten plastic resin.VI. MAINTENANCEThe periodic maintenance should be performed by skilledworker. The procedure is as followed. This is generallycarried out in every 10,00,000 cycles. Vents should be checked for depth, land and width. All plates are removed and their faces cleaned. All moving parts must be proper lubricated. Corrosion and vent burns must be checked. Any excessive wear must be repair or replaced. Alignment of parts are properly checked. Leaks and flow capacity tested properly.VII. CONCLUSIONFrom the result of the application of RCA approach ininjection moulding thus reduces the production loss to thecompany. Root cause of defects were identified using causeand effect diagram. Counter measures and parallelimprovement opportunities for major defects causingproduction stoppage was also suggested.REFERENCES[1] kazmer D., 1997. The foundation of intelligent processcontrol for injection moulding. Journal of InjectionMolding Technology, Vol. 1, NO.1, pp. 44-56.[2] T.A. Osswald. Polymer Processing Hanser Publishers,1998.[3] Shi L. and Gupta M. 1999. An approximate predictionof sink mark depth in rib-reinforced plastic parts byempirical equations. Journal of injection moldingtechnology, Vol.3, No.1, pp 1-10.[4] Y.H Lin, W.J. Deng, C.H. Huang (2000). Injectionmolding process for tensile and wear properties ofpolypropylene components via Taguchi and de method.Polymer-Plastics Technology and Engineering.[5] Swanson L., "Linking maintenance strategies toperformance". International Journal of ProductionEconomics 70(3), (2001), 237-244.[6] Iyer N. and Ramani K. 2002. A study of localizedshrinkage in injection molding with high thermalconductivity molds. Journal of injection moldingtechnology, Vol. 1, No.1, pp. 44-56.[7] Mahesh, F and Rai Singh, P., "DMAIC Concepts andapplications", Journal of Management System, Vol.105, No.4, 2005, pp. 6-9. 6, No.4, 2004[8] Montgomery, T., "Design for six sigma", Qualityprogress Magazine, Vol.2, No.1, 2004, pp 82-86.[9] F.T.S. Chan, H.C.W. Lau, R.W.L. Ip, H.K. Chan, S.Kong "Implementation of total productive maintenance:A case study" Int. J. production Economics 95 (2005)71-94.[10] Erzurumlu T. and Ozcelik B. 2006. Minimization ofwarpage and sink index in injection-moldedthermoplastic parts using Taguchi optimization method.Materials and design, Vol.27, pp. 853-861.[11] Sanders, D and Hilolo, Q., "Six Sigma on BusinessProcesses: Common Organizational Issue", Journal ofQuality Engineering, Vol. 12, No.2, 2007, pp. 5-8.[12] Dale H. Besterfield, Carol Beserfield, Glen H.Besterfield & Mary Besterfield, "Total QualityManagement", Person Education (2008).[13] Mahapatra S.S. and Chaturvedi V.2009, Modelling andanalysis of abrasive wear performance of compositesusing Taguchi approach. International journal ofEngineering, Science and Technology, vol.1, No.1,(2009), pp. 123-135.[14] Surhone, L., Timpledon, M., & Marseken, S. (2010)."Pareto analysis: Statistics, decision making, ParetoPrinciple, fault tree analysis, failure mode and effectanalysis. Pareto distribution", Wikipedia BetascriptPublishing.[15] Abhishek Jayswai, Xiang Li, Anand Zanwar, Helen H.Lou, Yinlun Huang, "Sustainability root cause analysismethodology and its application" Computers andchemical Engineering 35 (2011) 2786-2798.[16] Melesse Worknesh Wakijira, Ajit Pal Singh "Totalproductive Maintenance:A casestudy inmanufacturing" Global Journal of Researchers inengineering industrial engineering, 2012, Volume 12.[17] Amit Kumar Gupta, R.K. Garg "OEE Improvement byTPM Implementation: A case study", InternationalJournal of ITI, Engineering and Applied SciencesResearch, 2012, Volume 1.[18] Islam H. Afefy "Implementation of Total ProductiveMaintenance and Overall Equipment EffectivenessEvaluation", International Journal of Mechanical &Mechatronics Engineering, 2013, Vol:13. AutodeskInc., Simulation Moldflow Insight, 2014.[19] Y.-H. Lin, H.-L. Chen, S.-C. Chen, Y.-C. Lin, Effect ofasymmetric cooling system on in-mold roller injectionmolded part warpage, Int. Commun. Heat mass transfer61(2015) 111-117.All rights reserved by www.ijsrd.com42
tools are often touted and used as a full-blown root cause analysis. Kiran M has identify the major breakdowns causing the production loss to the company. Root cause analysis was conducted for the improvement in the production. Root causes of breakdowns were identified using cause and effect diagram. Counter measures and