Transcription
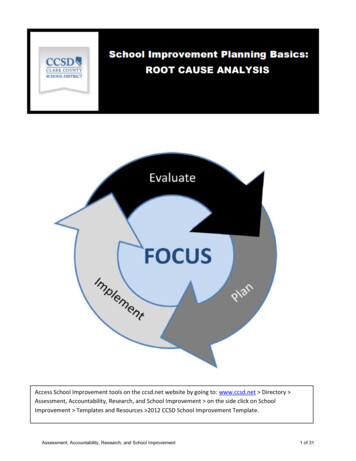
ROOT CAUSE ANALYSISAccess School Improvement tools on the ccsd.net website by going to: www.ccsd.net Directory Assessment, Accountability, Research, and School Improvement on the side click on SchoolImprovement Templates and Resources 2012 CCSD School Improvement Template.Assessment, Accountability, Research, and School Improvement1 of 31
ContentsLearning Outcomes . 3School Improvement Planning Process Map . 4Data Trends/ Checklist . 5Developing Trend Statements (Example and Blank Template) .6-7Quality Criteria .8-9Root Cause Analysis: Background .10-13Levels of Root Cause. 14Root Cause: Identification Circle Map – Example. 15When is a Cause a Root Cause? . 16Criteria for Narrowing Explanations . 17Root Cause Analysis. 18Why Because Activity . 19Validate Root Causes .20-21Terminology .22-24Root Cause Analysis: Toolbox .25-31Assessment, Accountability, Research, and School Improvement2 of 31
Learning Outcomes Identify concerns from performance trends Create Circle Map from site data (listing all possible explanations) Categorize/Sort causes based on the four levels of Root Cause Analysis Questions/Clarify – Is this really a cause? Narrow explanations ―Why Because‖ Process Validation of Root Causes Inquiry and SIP TemplateAssessment, Accountability, Research, and School Improvement3 of 31
School Improvement Planning Process MapAssessment, Accountability, Research, and School Improvement4 of 31
Data Trends/Checklist Review written trends: Content area from School Performance Framework (SPF) and data support from Green &Whites, 3 Year Trend Report, or site-based data Identify measures/metrics Which students (grade and disaggregated group) Direction of trend (increasing, decreasing, or stable) Amount of increase, decrease, etc. Time period (at least 3 years) Performance indicator: Academic Growth & Academic Achievement Completed Data Trends: Use Quality Criteria to evaluate performance trends (pg. 8) Indicate that your team is ready for a facilitator to provide feedback about your positiveand negative performance trends Data Trends in Progress: Finalize Data Analysis Use Performance Data Inventory (pg. 6-7) to write positive/negative trend statements Identify 2-4 priority concernsAssessment, Accountability, Research, and School Improvement5 of 31
Assessment, Accountability, Research, and School Improvement6 of 31
Assessment, Accountability, Research, and School Improvement7 of 31
QUALITY CRITERIAPlan ElementCriteria(definition)Performance Trends Description oftrends for everyperformanceindicator, identifiedbased on analysis ofthree years of data. Priority Concerns(performancechallenges) Specific statementsabout the school’sperformancechallenges (notstatements aboutbudgeting, staffing,curriculum,instruction, etc.),with at least onepriority identifiedfor eachperformanceindicator where theschool did not meetfederal, state and/orlocal expectations. Makes explicit to which performance indicator/sub-indicator the trendapplies, and the direction of the trend (i.e., strengths and challenges).Specifies performance indicator areas where the school failed to meetdistrict (academic achievement, academic growth, academic growthgaps, post-secondary/workforce readiness), state/federal (AYPtargets), or school performance expectations.Includes analysis of data at a more detailed level than that presented inthe SPF report, for example, patterns over time:o for cohorts of students (3rd grade in one year, 4th grade in thenext year, 5th grade in the third year);o within a grade level (per content area, disaggregated group);o within a disaggregated group of students; and/oro within a content strand (e.g. number sense in mathematics).Includes analysis of relevant local performance data.To the degree that data are available, includes analysis of theperformance of all students in the school (e.g., pre-K-2), and includesperformance in subjects not tested by the state.Identifies at least one priority concern (performance challenge) forevery indicator (achievement, growth, growth gaps, postsecondary/workforce readiness) for which minimum expectationswere not at least met.Specifies priority disaggregated groups. Required for Title I AYPtargets or safe-harbor targets; recommended for all others.Identifies priority performance challenges based on analysis ofperformance trends.Specifies needs at a more detailed level than that presented in the SPFreport, for example:o for cohorts of students (3rd grade in one year, 4th grade in thenext year, 5th grade in the third year);o within a grade level over time (e.g. consistently not meetingexpectations in 4th grade mathematics for three years);o within a disaggregated group of students; and/oro within a content strand (e.g. number sense in mathematics).Priority concerns describe the strategic focus for the schoolconsidering every sub-indicator for which the school did not meetexpectations. Priority concerns do not need to be identified for everysub-indicator (e.g., math achievement, ELL student growth in reading)for which the school did not meet expectations.Assessment, Accountability, Research, and School Improvement8 of 31
Plan ElementCriteria(definition)Root Causes Statementsdescribing thedeepest underlyingcause, or causes, ofperformancechallenges, that, ifdissolved, wouldresult inelimination, orsubstantialreduction, of theperformancechallenge(s). Identifies one root cause for each priority performance concern (thesame root cause could apply to multiple priority performancechallenges, and should be listed next to each priority performancechallenge to which it applies).Specifies ―causes‖ the school can control (e.g., the school does notprovide additional support/interventions for students performing at theunsatisfactory level) rather than describing characteristics of students(e.g., race, poverty, student motivation).Reflects analysis of multiple types of data (in addition to performancedata and including local data sources) in the identification of rootcauses.For schools with performance that does not meet expectations on alarge number, or all of the performance indicators/sub-indicators,explicitly considers broad, systemic root causes.Priority Concern Examples For the past three years, English language learners (making up 60% of the student population)have had median growth percentiles below 30 in both content areas.The percent of fifth grade students scoring proficient or better in mathematics has declined from45% three years ago, to 38% two years ago, to 33% in the most recent school year.For the past three years, the median growth percentiles in grades 4 through 6 in reading havebeen 39 or below, which is less than the minimum District expectation of 46.Apply Quality Criteria Use the Quality Criteria for Performance Trends and Priority Concerns (Page 8-9).Consider: How are the trends and priority concerns similar and/or different from that reflected inquality criteria? How could these sections be improved upon?Assessment, Accountability, Research, and School Improvement9 of 31
Root Cause Analysis: BackgroundExcerpted from:Preuss, P.G. (2003). School Leader’s Guide to Root Cause Analysis: Using Data to dissolveProblems. Larchmont, NY: Eye on Education.What is “Root Cause”?Rather than assume knowledge of what a ―root cause‖ is, let’s first look at several definitions:From the Savannah River Project (a nuclear power station): Root Cause is “the most basiccause that can reasonably be identified, that we have control to fix, and for which effectiverecommendations for prevention can be implemented.”From Medical Risk Management Associates: Root Causes are “the underlying cause of adverseout comes.”From the Joint Commission on Accreditation of Healthcare Organizations: Root Causes are“the basic or casual factors that under lie variation in performance, including the occurrence orpossible occurrence of a sentinel (major) event.”From Business Solutions—The Positive Way: Root Causes are the “basic cause or causes” ofthe problem or symptoms.From “Total Quality Schools,” by Joseph C. Fields: A Root Cause is “the most basic reason theproblem occurs.”Other organizations differentiate between ―contributory‖ or ―proximate‖ causes and root causes. Often,the most immediate or obvious cause is mistakenly identified as the root cause when, instead, it issimply the most proximate contributory cause, which itself has much deeper roots.Example: Often, blame is first centered on an individual. Although an individual may haveindeed committed an error that resulted in a problem, a deeper cause may be found in areas suchas: training of the individual, scheduling of the individual, assignment of duties, clarification ofduties, supervision, work environment, or anyone of a host of other issues. Most people involvedin root cause analysis understand that the vast majority of root causes are system-based ratherthan individual-based.For purposes of this guide, the following definition suffices:Root Cause—the deepest underlying cause, or causes, of positive or negative symptomswithin any process that, if dissolved, would result in elimination, or substantial reduction,of the symptom.Assessment, Accountability, Research, and School Improvement10 of 31
Let’s look at this definition again, this time highlighting and commenting on its various essentialcomponents:Root Cause—the deepest underlying cause, or causes, of positive or negative symptomswithin any process that, if dissolved, would result in elimination, or substantial reduction,of the symptom.Deepest—this means that we really have to dig deep to find most roots. They usually are not the mostimmediate, obvious, or proximate causes. Often, they are three, four, or five layers down into thesystem.Example: A high school has a high number of local (general) diploma graduates. However, thestate is requiring that 100 percent of graduates have academic diplomas within a few years.Taking a detailed look at the local diploma recipients, it is found that fully two-thirds either hadexceeded academic diploma requirements or were close to them. Upon further investigation, it isfound that guidance counselors, and even the high school principal, communicate to parents andstudents that the academic diploma is not necessary for college acceptance or future success.Emphasis is placed on SAT scores instead. In discussions with the counselors and principal, it isfound that the system has never placed emphasis on academic diplomas, and, in fact, the school’spersonnel felt they were doing their duty in accordance with what they believed the schoolsystem and the community wanted. The district (system) had not communicated this change ingoals to its staff.A few people take issue with the use of the term ―root cause‖ and prefer instead the concept of ―causalanalysis.‖ Their reasoning is that the concept of ―root cause‖ came out of an industrial mechanicalenvironment that is not suited to education and that there are usually multiple causes rather than a singleroot. Obviously, I have chosen to stick with the concept of ―root cause.‖ I really do not care where it wasfirst used because I believe the metaphor works in any context. I especially like the concept of ―root‖because it implies that we must dig deeply to find cause. To me, the term ―causal analysis‖ facilitates theeasy, knee-jerk response of ―I know the cause—here it is,‖ rather than demanding the deep search that istypically required.Cause or causes—School systems are social systems. They are far more complex than eithermechanical or biological systems. For this reason, it is often impossible to isolate a single root cause,and often it is possible to identify several causes that in combination bring about a symptom. The goodnews is that often, by dissolving any one of the multiple root causes, the symptoms can be reduced oreven eliminated.Models and examples: I often think of the fire triangle. It takes three elements to make a fire: asource of combustion, oxygen, and a source of fuel. Take any one of the three away and a firecannot start or continue to burn.Assessment, Accountability, Research, and School Improvement11 of 31
Often, an air crash is the result of the convergence of separate events that in and of themselveswould not have caused an accident but when placed in combination result in a disaster. It hasbeen found, in some instances, that a student can ―survive‖ any one deficient process within aschool but that when faced with two, three, or more, the student quickly falls behind.Positive or negative—Our successes, as well as our failures, have root causes. By studying the roots forour successes, we may find strategies that can be applied to improving all of our processes.Example: A school district successfully implements the IBM program ―Writing to Read.‖ Inlooking back at its experience, the district identifies the following strategies as contributory tothe program’s success: direct faculty involvement and agreement in adopting the program; ―bythe book‖ training, staffing, and assignment of resources in support of the program;benchmarking and adaptation of a model from another successful school; thorough parentinformation; and continuous administrative involvement and encouragement. Can thesestrategies be applied to future programs? You bet!Symptoms—In dealing with problems, symptoms are found at the surface. They are the ―red flag‖ thatdraws attention to the issue. A symptom is usually a noticeable gap between expectations and reality.Example: A school district has a very high failure rate in ninth grade. Expectations are that moststudents will successfully transition from middle school to high school. The reality is that over50 percent of all freshmen fail at least one course during the year. The failure rate is the ―redflag‖ as well as a symptom of deeper underlying causes. In order to eliminate the symptom, thedeeper underlying root causes have to be dissolved.Process—All work is process. A simple process has a minimum of three elements: a) input, b) addedvalue, and c) output.Example: Writing (and mailing) a letter is a process. It has certain elements of input, such asblank paper, a blank envelope, a pen, a stamp, a source for the address as well as concepts to beplaced in the letter as content. Then there is the value added process of actually composing andwriting the letter followed by the physical mailing of the previously isolated elements as a singleproduct. The output is both the physically completed letter and the communication it contains.Once we can identify the input, value added, and the output, we can identify the process. Schoolsare composed of hundreds of processes—two of the large umbrella processes are teaching andlearning.Dissolve—We have to concentrate on dissolving the root rather than ―fixing‖ the symptom with a patch.Once the root is dissolved, the symptom will go away of its own accord. Patches just add complexityand cost to the system. Some people think that much of what we do in school is patching.Assessment, Accountability, Research, and School Improvement12 of 31
Example: A school district was faced with a very high number of out-of-school suspensions. Itssolution to the problem was to implement an in-school suspension program. This resulted inspace, staff and energy being assigned to what essentially was a patch on the system. They neverlooked at causes for the suspensions in order to substantially reduce or eliminate them. Perhapsthis is more than you ever wanted to know about the definition of ―root cause.‖ Hopefully,however, it provides an adequate foundation upon which to move forward and will make some ofwhat follows easier to understand.One more time:Root Cause—the deepest underlying cause, or causes, of positive or negative symptoms within anyprocess that, if dissolved, would result in elimination, or substantial reduction, of the symptom.Assessment, Accountability, Research, and School Improvement13 of 31
Levels of Root CauseRoot Causes can be found at any one of the following levels:Incident or procedural level:Example: A fight in the cafeteria, fifth period on Wednesday. the studentthe testthe teacherthe incidentProgrammatic level:Example: There are always fights in the cafeteria, every day, at every period. instructionalprocessesmaterialssettingtime alignmentgroupingschedulingtraining and staffdevelopment ic level:Example: There are fights everywhere in school. get ation of staffculturefacilities rycapacityExternal level:Example: The whole community is fighting. familycommunitygangswealth/povertyAssessment, Accountability, Research, and School Improvement healthpartnerships and supporting agenciesthe mediayouth culture14 of 31
Root Cause: Identification - ExampleSample High School SortSystem Level:System/External Level:Students feared for their safetyState said school lacked a caringenvironmentDiscord between school and BOE,parentsDiscipline issuesFailure in dropout record keepingNinth graders were added with noadvanced planningAssessment, Accountability, Research, and School Improvement15 of 31
When is a Cause a Root Cause?In complex social systems, such as schools, it may be difficult, if not impossible, to identify a single,specific, root cause. Often, there are clusters of causal factors that each contribute to the problem.Sometimes, dissolution of any one of the casual factors is sufficient to substantially reduce or totallyeliminate the problem. The following concepts provide some direction in identifying root causes orclusters of causal factors.Ammerman has identified three criteria to determine if each identified cause is a root cause or if it is acontributing cause. They are:1. Would the problem have occurred if the cause had not been present? If no, then it is a rootcause. If yes, then it is a contributing cause.2. Will the problem reoccur as the result of the same cause if the cause is corrected or dissolved?If no, then it is a root cause. If yes, then it is a contributing cause.3. Will correction or dissolution of the cause lead to similar events? If no, then it is a root cause.If yes, then it is a contributing cause.Other indicators that you have found the root cause are: You run into a dead end asking what caused the proposed root cause. Everyone agrees that this is a root cause. The cause is logical, makes sense, and provides clarity to the problem. The cause is something that you can influence and control. If the cause is dissolved, there is realistic hope that the problem can be reduced or prevented inthe future.School improvement teams and others using root cause analysis often wonder when to stop seekingcause and make the decision that sufficient data and effort have been used to arrive at a reasonable root.This is often a judgment call that will improve with experience. Often, the lack of data and the pressuresof time frustrate the effort and force it to halt at a level below the surface symptom, but perhaps not asdeep as must it ultimately go. In my view, this is the reality of life in a less-than-perfect world. Using theabove guides and common sense, however, teams can usually arrive at a proximate area of cause orcauses that if dissolved, or reduced, will remedy or reduce the symptom. Teams, however, should notallow timidity or fear to block deeper discovery of issues that may be related to culture or deeperorganizational elements.Assessment, Accountability, Research, and School Improvement16 of 31
CRITERIA FOR NARROWING EXPLANATIONSAfter your planning team has generated explanations of the performance data, and before you beginplanning next steps, it’s a good idea to check your thinking again. Below are indicators and criticalquestions to help you get to the best possible explanations.Step 1: Eliminate explanations that are not within our controlFirst, your team needs to eliminate explanations that do not lie within the control of your school/districtand put these explanations aside. The following questions could help with this process. Over what do we believe we have control (e.g., students completing homework, parentssupporting their students, etc.)? What factors are beyond our influence? Would others agree? Are we thinking too broadly, too narrowly, or accurately?Step 2: Evaluate the quality of your explanations (reach consensus on which ones to keep)The following criteria can be applied by your team to evaluate the current list of explanations and towhittle your list down to the ―best‖ thinking available across the team. Use the questions below eachcriterion to help check the thinking of your team. Eliminate explanations that fail to meet these criteria.Criterion: The explanation derives logically from the data Can we articulate the connection(s) we see between the data and our explanation(s)?Does our explanation reflect a genuine situation, but one that is not related to this data?Can we tell the story of how our explanation could lead to the patterns we see in our data?Criterion: The explanation is specific enough to be testable Is the language specific enough to be clear to someone who was not part of our discussion?Are there any vague terms?Can we describe how we would we test the explanation?Criterion: The explanation is plausible Does any research support this thinking?If we base any planning steps on this explanation, do we anticipate meaningful results?Step 3: Clarify the language used in your explanationsConsider the following questions to clarify remaining explanations. Do our explanations make sense to someone else reading or hearing them for the first time?Is our explanation complex enough to help us to better understand a complex situation?What other questions do our explanations lead us to in order to make the picture more complete?Does this explanation identify an area of concern?Assessment, Accountability, Research, and School Improvement17 of 31
Root Cause AnalysisThe fourth part of the inquiry process focuses on root causes and solutions for the performance concernsand key strengths. This section begins with root causes analysis, which is the single most importantelement in the planning process as it correctly identifies the reasons behind the performance concernsand key strengths. A well-written plan that is not based on accurate reasons for identified concerns andkey strengths will not provide the staff with the necessary map to identify appropriate solutions andcreate action plans designed to increase achievement.Root Cause Analysis (RCA) is a method of problem solving designed to uncover the deepest root andmost basic reasons for identified concerns. RCA helps schools to correctly identify the true problemsrather than addressing symptoms. The most challenging aspect of RCA is the ability of the staff and itsadministration to be open and honest in a safe, collaborative environment. This climate will foster trueexamination of causes which may be uncomfortable, including issues of climate, organization, andinstructional quality. This is an important step in reaching the root of the problem impacting studentachievement and the achievement gap between subgroups.RCA, in combination with performance concern and key strength identification, is the most criticalcomponent in school improvement it is the foundation for the Master Plan Design. Although timeconstraints are a reality for school improvement teams, data analysis and the process of inquiry are wellworth the time. Rather than relying on assumptions, anecdotal information, and/or teacher perceptionsthat name symptoms of problems, the true root causes must be identified.The climate and culture in a school is critical to the staff’s ability to delve into deeper levels of analysislike RCA. A school where staff members are supported and encouraged to take responsibility forsuccess and failure empowers all key stakeholders to take risks and work as a team to create effectivesolutions to address student learning. Schools that have had a lack of student achievement for severalyears will more than likely need to address school culture issues through some form of team buildingbefore they can let go of the past and move forward with a fresh new approach.The first step in this process is to identify performance concerns based on analysis of multiple datasources. It is important that teams analyze multiple sources of data, data triangulation, to validateconcerns. Data triangulation is one methodology that can be used to determine the root cause of theproblem. At a minimum, planning teams should use at least three sources of data to identify eachconcern.Assessment, Accountability, Research, and School Improvement18 of 31
How to Identify Root Causes: Focus on closely related performance concerns.If an external review has been done in the school, then consider the findings of the review. Ifnot, consider the categories of factors that typically cause performance concerns.Brainstorm possible explanations (causes) for the performance concerns using the fishbone chart(see below).Categorize like causes together.Narrow the explanations to those that are actionable, which includes removing items outside ofthe school’s control.Deepen the thinking to ensure the causes are ―root‖ causes by using the ―Why Because‖ chartor the enhanced questions below.Verify root causes with multiple data sources to ensure improvement strategies and action stepsalign with the root cause of performance concerns. They should be the deepest and most basicreason, within the school’s control, evidence based, and focused on the adult actions of theleaders and teachers.Assessment, Accountability, Research, and School Improvement19 of 31
Questions to Help Validate Root Causes:1. What is the proof that this cause exists? Is it concrete? Is it measurable? Are there more thantwo data elements that provide evidence?2. What is the proof that this cause could lead to the stated effect? Am I merely assertingcausation? (Ex. If a program is identified as the reason students are not achieving, is thereevidence that it is not aligned to tested and taught curriculum? Have students spent the majorityof the allotted instructional time using this program?)3. What proof is there that this cause actually contributed to the problem? Given that it exists andcould lead to this problem, how do I know it was not actually something else?4. Is anything else needed, along with this cause, for the stated effect to occur? Is it self-sufficient?Is something else needed? (Ex. Are Special Education student schedules the only problem thatprevents them from grade level curriculum exposure, or is there another key factor, perhaps thelevel of experience of teacher to scaffold instruction to meet the needs of all learners?)5. Can anything else, besides this cause, lead to the stated effect? Are there alternativeexplanations that fit better? What other risks are there?Restructuring and Turnaround plans should include NCCAT-S results in the identification of root causesand may include verbiage from the ―Area of Need‖ and/or ―Area of Concern‖ columns from theNCCAT-S rubric to highlight specific causes.Assessment, Accountability, Research, and School Improvement20 of 31
Assessment, Accountability, Research, and School Improvement21 of 31
TerminologyTermAssessment Analysis:Back Room Data:Brainstorming:Contributory Causal Factor:Creative Root Cause Analysis:Culture:Data Set:Disaggregation:Fishbone:DefinitionA pathway for seeking root cause for student failureexamination of the assessment including: itemanalysis, content mapping, and alignment withstandards, curriculum, and instruction.Data as it is used to seek root cause is oftenexploratory, messy, complex and filled withunnecessary detail-as opposed to presentation data,which should be clear, concise, and focused on majorfindings.A tool used in root cause analysis to identify whatteam members think are potential areas of underlyingcauses. More generally, a structured process forgenerating ideas from all members of a group.An alternative to the term ―root cause‖ suggested byMedica
Root Cause Analysis: Background . Excerpted from: Preuss, P.G. (2003). School Leader’s Guide to Root Cause Analysis: Using Data to dissolve Problems. Larchmont, NY: Eye on Education. What is “Root Cause”? Rather than assume knowledge of what a ―root cau