Transcription
Shock and Vibration Test reportRevision -: October, 26th, 2003Shock and Vibration Summary TestReportProject number:Date creation: October 26th, 2003Date revision:Number of pages: 22DOCUMENT REFERENCEProject numberTYPEFORMATD00318Summary Test ReportLtPAGE1-REV
Shock and Vibration Test reportRevision -: October, 26th, 2003TABLE OF CONTENTS1SCOPE.42APPLICABLE DOCUMENTS .43Identification of Items Being Tested .4Test Items .44Shock tests:.5Shock Test Category.5Shock Grade .5Equipment Class .5Shock Test Type .5Equipment Mounting Locations .5Mounting Orientation aboard Ship.5Shock: FSP and Fixture Instrumentation.7Shot 3 result summary.9Summary of hardware observations after the tests: .135VIBRATION tests:.15Vibration Type .15Vibration Test Range.15Equipment Mounting Locations .15Vibration: Instrumentation of racks under test.15Vibration result summary.16Comments on vibration tests:.20Summary of hardware observations after the vibration tests: .20Appendix A: Installation and interface drawing of the .21DOCUMENT REFERENCEProject numberTYPEFORMATPAGED00318Calculation reportLt3-REV
Shock and Vibration Test reportRevision -: October, 26th, 20034SHOCK TESTS:Shock Test CategoryHeavyweightShock GradeClass II12-16 HzDeck Simulator Fixture (DSF)Equipment ClassGrade AShock Test TypeType AEquipment Mounting LocationsThe Base of the racks is mounted on a Deck Simulator Fixture during barge test. The DSF alsosimulates bulkhead interface.Mounting Orientation aboard ShipVertical orientation, front door facing forward for the first 3 shots. Racks are rotated 90degrees for the last shot.DOCUMENT REFERENCEProject numberTYPEFORMATPAGED00318Calculation reportLt5-REV
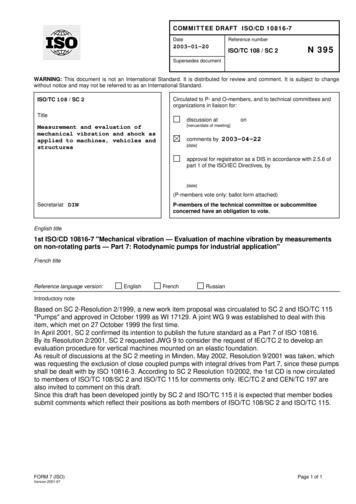
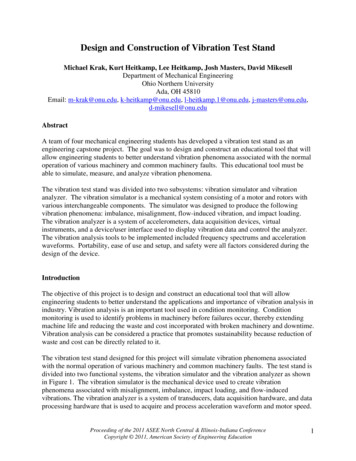
Shock and Vibration Test reportRevision -: October, 26th, 2003TEST SETUP FOR BARGE TESTRF / Timing Interface17 ea.(Coax)RF / Timing Interface18 ea.(Coax)RF / Timing Interface8 ea.(Coax)LAN Interface6 ea.(Ethernet)LAN Interface5 ea.(Ethernet)LAN Interface2 ea.(Ethernet)Control Interface6 ea.(Serial)Control Interface5 ea.(Serial)Power Interface1 ea.(SJO)Power Interface1 ea.(SJO)Electrical Power115 VAC /- 7%60 HZ /- 3%30 AmpsAN/SSQ-137(V)1Rack 1Electrical Power115 VAC /- 7%60 HZ /- 3%20 AmpsElectrical Power115 VAC /- 7%60 HZ /- 3%35 AmpsAN/SSQ-137(V)1Rack 2BARGEBarge - Shore Link(distance ?)Electrical Power115 VAC /- 7%60 HZ /- 3%20 AmpsAN/SSQ-137(V)1Rack 3AN/SSQ-137(V)1Rack 4LAN Interface1 ea.(Ethernet)Control Interface1 ea.(Audio)PC and PrinterShore Test EquipmentDOCUMENT REFERENCEProject numberTYPEFORMATPAGED00318Calculation reportLt6-REV
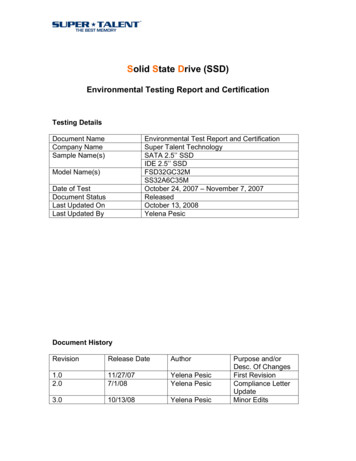
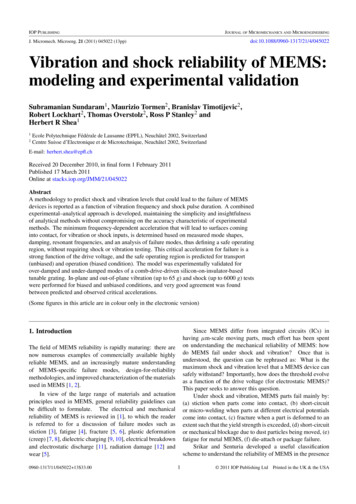
Shock and Vibration Test reportRevision -: October, 26th, 2003Shock: FSP and Fixture InstrumentationAccelerometers are installed on the DSF to verify proper test geometry and to monitor the shock inputparameters. Accelerometers are placed on the cabinet and test fixture to verify proper shock conditionsand to monitor shock at cabinet level. Accelerometer locations for the Class II equipment and DSF arelisted in Table below. In addition to the accelerometers listed below, clay cones have been installedbelow each rack to monitor vertical deflection during shock.GageOrientationCabinet PNLocationAcc-1verticalDSF center, middle of 4 racksAcc-2athwart shipDSF center, middle of 4 racksAcc-5verticalRack #1Front Top of rack (right side)Acc 6verticalRack #2Front Top of rack (right side)Acc 7athwart shipRack #2Front Top of rack (right side)Acc 8verticalRack #2Front Bottom of rack (left side)Acc 9athwart shipRack #2Front Bottom of rack (left side)Acc 10verticalRack #3Front Top of rack (side)Acc 11verticalRack #4Front Top of rack (side)Shock Test Accelerometer Location for Class II EquipmentDOCUMENT REFERENCEProject numberTYPEFORMATPAGED00318Calculation reportLt7-REV
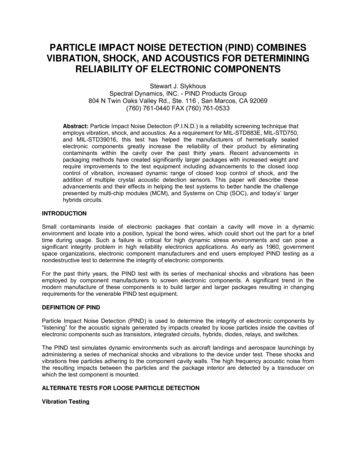
Shock and Vibration Test reportRevision -: October, 26th, 2003ACC5 VACC11 Vtest performed July 6 2003rack1rack4ACC10 VACC6 VACC7 SSACC1 Vertrack3rack2ACC2 SSACC8 VACC9 SSDOCUMENT REFERENCEProject numberTYPEFORMATPAGED00318Calculation reportLt8-REV
Shock and Vibration Test reportRevision -: October, 26th, 2003Shot 3 result summaryList of test conducted:Shot noTest fixture EquipmentfrequencyoperatingHz /- ientationofSSEEsystem @FSP1Class II-14ON24 ft30 ftathwartFore / aft2Class II-14ON24 ft25 ftathwartFore / aft3Class II-14ON24 ft20 ftathwartFore / aft4Class II-14ON24 ft20 ftathwartathwartTest results have been limited to the most severe and representative test (shot 3 with the 60lbs explosivecharge horizontally located at 20 ft from the barge). Other results are fully documented in the shock andvibration test report (DTI document reference 655).DOCUMENT REFERENCEProject numberTYPEFORMATPAGED00318Calculation reportLt9-REV
Shock and Vibration Test reportRevision -: October, 26th, 2003AccMax45.13Filtered at 250hz low pass60Acceleration/g1Shock acceleration measured during shot 3300-30-600200400600-35.4Min1000 1200 14Time (msec)Max10.24Filtered at 250hz low 4Min1000 1200 14Time (msec)Max12.18Filtered at 250hz low 0Min8001000 1200 14Time (msec)DOCUMENT REFERENCEProject numberTYPEFORMATPAGED00318Calculation reportLt10-REV
Shock and Vibration Test reportRevision -: October, 26th, 2003Max8.814Filtered at 250hz low 8001000 1200 14Time (msec)Max10.19Filtered at 250hz low Min1000 1200 140Time (msec)Max7.835Filtered at 250hz low 0-10.8Min8001000 1200 14Time (msec)DOCUMENT REFERENCEProject numberTYPEFORMATPAGED00318Calculation reportLt11-REV
Shock and Vibration Test reportRevision -: October, 26th, 2003Max5.216Filtered at 250hz low pass6Acceleration/g930-3-60200400600-3.64Min1000 1200 140Time (msec)Max18.01Filtered at 250hz low in1000 1200 14Time (msec)Max10.64Filtered at 250hz low -15.9Min8001000 1200 14Time (msec)DOCUMENT REFERENCEProject numberTYPEFORMATPAGED00318Calculation reportLt12-REV
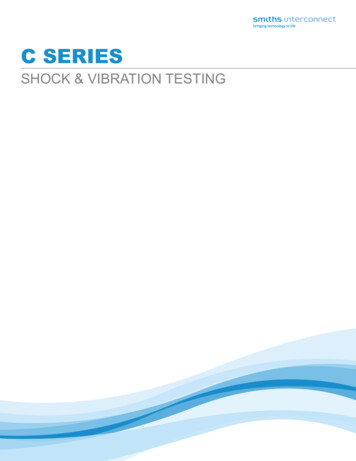
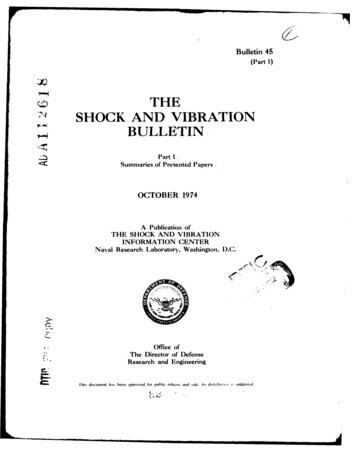
Shock and Vibration Test reportRevision -: October, 26th, 2003Summary of hardware observations after the tests:-No defect has been noted on racks (no loose hardware, scratch, dent )-The shock isolators did not bottom during the most severe shots (3 and 4).-Vertical deflection (sway space downward) was measured at 3.5” on clay cone.-The sway space measured and the level of G response inside the racks is in good accordance withthe calculation performed to select the shock mounts. This validates the theoretical model and L/Ddata used by 901D,LLC to perform barge test shock analysis.-During shot 2, accelerometers 7 and 11 were moved and relocated on the side of one of the servers.The first accelerometer was mounted on the rack side, the other one at its very proximity but on theserver side (the general device slide being in between the 2 sensors). An acceleration spike wasnoted on the sensor located on the server during the shot: this confirms a mechanical interferencebetween the 2 parts of the general device slide during the shock pulse, giving rise to a higher levelof Gs. In order to reduce the level of stress generated on the server (the hard disk could morespecifically be affected), a new slide with a tighter fit between the 2 members would be beneficial.25 StandoffMax11.90Filtered at 250hz low pass15Acceleration/g1050Accelerometer 7 onrack-5-10-15-200200400-15.2Min6008001000 1200 1400 1600 1800 2000Time (msec)25' StandoffMax11.69Filtered at 250hz low passAcceleration/g20Accelerometer11close to Acc 7 but onserver:Highfrequency spike dueto slide bottoming isnoted on first rebound(20g)100-10-20-300-20.3Min200400600800 1000 1200 1400 1600 1800 2000Time (msec)DOCUMENT REFERENCEProject numberTYPEFORMATPAGED00318Calculation reportLt13-REV
Shock and Vibration Test reportRevision -: October, 26th, 2003-The 17” flat Panel display of the 2U Keyboard/FPD unit (TAG) was tested in the open position andremained well maintained by the top mechanical bracket tying it to the rack. With the tip of thekeyboard being left free, no damage was noted during the test and the concept of holding the top ofthe display only has been validated.DOCUMENT REFERENCEProject numberTYPEFORMATPAGED00318Calculation reportLt14-REV
Shock and Vibration Test reportRevision -: October, 26th, 20035VIBRATION TESTS:Vibration TypeIn accordance with the MIL STD 167, type I. Test will include, for each axis:-Exploratory test, as detailed in paragraph 5.1.3.3.1 of the MIL STD 167-Variable frequency test, as detailed in paragraph 5.1.3.3.2 of the MIL STD 167- Endurance test: as described in paragraph 5.1.3.3.3 of the MIL STD 167.Amplitude and frequency range are as defined in table I of the MIL STD 167Vibration Test RangeAs defined in table I of MIL STD 167. Frequency range is limited to 33 Hz.Equipment Mounting LocationsA chassis simulating the ship interface (floor and bulkhead) is used to secure the racks on the shakerduring vibration tests. This chassis shall be such that no frequency resonance is found during thesurvey over all the frequency range.Vibration: Instrumentation of racks under testAccelerometers are installed on the test chassis bolted to the vibration machine table to verify propertest geometry and to monitor the vibration input parameters. Accelerometers are placed on the cabinetto verify proper vibration conditions and to monitor vibration level at cabinet level. Accelerometerlocations are listed in Table below.GageLocationAcc-1On vibration table (bottom)Acc-2On top of test fixture (chassis), close to the stabilizer plateAcc-5Front bottom left side of rack under testAcc 6Front Top right side of rack under testVibration Test Accelerometer LocationDOCUMENT REFERENCEProject numberTYPEFORMATPAGED00318Calculation reportLt15-REV
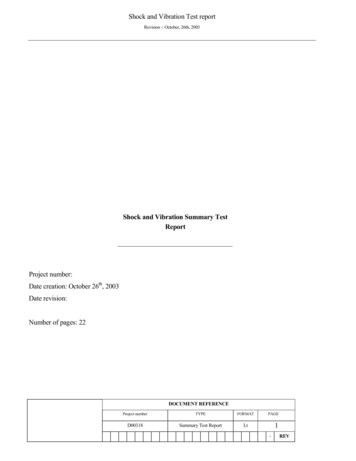
Shock and Vibration Test reportRevision -: October, 26th, 2003Vibration result summaryThe test results presented here have been limited to one rack and are representative to the other test datameasured for each rack. All other results are fully documented in the shock and vibration test report(DTI document reference 655V).For each direction, the acceleration measured on the rack and the acceleration measured on the testchassis and on the shacking table are plotted on the same graph.The Q factor is then calculated in each case and shows clearly the frequency resonance of the isolatedrack.DOCUMENT REFERENCEProject numberTYPEFORMATPAGED00318Calculation reportLt16-REV
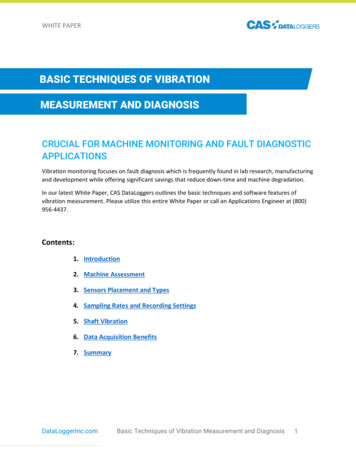
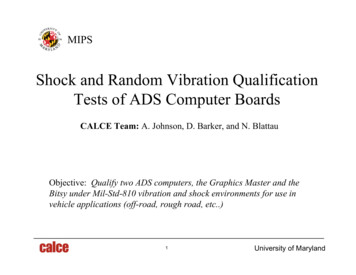
Shock and Vibration Test reportRevision -: October, 26th, 2003Direction:Vertical1.41.2Gs amplitude1.00.8Table Input Amplitude0.6Back Brace of FixtureTop Right Side of Cabinet0.4Bottom Left Side of Cabinet0.20.045678910 11 12 13 14 15 16 17 18 19 20 21 22 23 24 25 26 27 28 29 30 31 32 33frequency10.0Q of A4Q of A31.0Gs 728293031320.10.00.0frequencyDOCUMENT REFERENCEProject numberTYPEFORMATPAGED00318Calculation reportLt17-REV33
Shock and Vibration Test reportRevision -: October, 26th, 2003Direction:Side to side4.00003.5000Table Input AmplitudeBack Brace of FixtureTop Right Side of Cabinet3.0000Bottom Left Side of Cabinet2.0000Gs amplitude2.50001.50001.00000.50000.0000456789 10 11 12 13 14 15 16 17 18 19 20 21 22 23 24 25 26 27 28 29 30 31 32 33frequency10.09.08.0Gs amplitude7.0Q of A46.0Q of 222324252627282930313233frequencyDOCUMENT REFERENCEProject numberTYPEFORMATPAGED00318Calculation reportLt18-REV
Shock and Vibration Test reportRevision -: October, 26th, 2003Direction:Front to back2.50002.0000Table Input AmplitudeBack Brace of FixtureBottom Left Side of Cabinet1.50001.00000.50000.0000456789 10 11 12 13 14 15 16 17 18 19 20 21 22 23 24 25 26 27 28 29 30 31 32 33frequency5.04.54.0Q of A43.5Gs amplitudeGs amplitudeTop Right Side of CabinetQ of 02122232425262728293031frequencyDOCUMENT REFERENCEProject numberTYPEFORMATPAGED00318Calculation reportLt19-REV3233
Shock and Vibration Test reportRevision -: October, 26th, 2003Comments on vibration tests:The side to side test has shown an important coupling effect between the vibration table, the test fixture(chassis) and the rack under test. This condition has been generated by the test fixture having afrequency resonance in the side to side axis within the frequency range of the testThis coupling has generated a vibration input at the top of the test fixture well above the MIL STD 167requirement: 3.7g instead of 1 g.Æ In this configuration, the rack has been over-tested.Same phenomenon was also noted on the front to back direction, however significantly lower than inprevious axis (1.9g instead of 1g).In both cases, the high damping effect of the shock absorbers has dramatically reduced the level ofvibration applied to the rack. The vibration transmitted to the rack was always below 1g for these 2axes.The maximum amplitude transmitted to the rack was measured at the resonance in the verticaldirection around 1.2g @ 9 Hz.Summary of hardware observations after the vibration tests:-The vibration response measured inside the racks is in good accordance with the calculationperformed to select the shock mounts. This validates the theoretical model and L/D data used by901D,LLC to perform the vibration analysis.-During endurance, a rattling noise was discovered at the top of the rack. After further investigation,the noise has been suppressed by adding a rubber protection above the top cable retractor.-Some hardware used to tie the 2 members of the cable retractor was discovered loose after theendurance tests. A solution using a thread locker has been implemented and validated to solve theissue.-A 0.5 Hz drift of the frequency resonance has been noted after each dwell test. This drift isassociated with the warm-up of the isolators and is normal.DOCUMENT REFERENCEProject numberTYPEFORMATPAGED00318Calculation reportLt20-REV
Shock and Vibration Test reportRevision -: October, 26th, 2003DOCUMENT REFERENCEProject numberTYPEFORMATPAGED00318Calculation reportLt23-REV
Shock and Vibration Test report Revision -: October, 26th, 2003 DOCUMENT REFERENCE Project number TYPE FORMAT PAGE D00318Calculation report Lt15 - REV 5 VIBRATION TESTS: Vibration Type In accordance with the MIL STD 167, type I. Test will include, for each axis: - Exploratory test, as detailed in paragraph 5.1.3.3.1 of the MIL STD 167