Transcription
Does the presence of a medical school in the same university affect the rankings of theengineering school?Matteo Pasquali, mp@rice.eduDepartments of Chemical & Biomolecular Engineering and ChemistryThe Smalley Institute for Nanoscale Science & TechnologyThe Kennedy Institute for Information TechnologyRice University17 February 2009Revised 10 March 2009Revised 12 March 2009Revised on 7 November 2009ObjectiveOne argument supporting the potential merger of Rice with BCM is that the merger willincrease the Rice research rankings. Here we review the rankings of the top engineeringschools to determine whether or not there is a correlation between the ranking of anengineering school and the presence or absence of a medical school in the sameinstitution. Because of the important of biology in XXI century research, an initial examis presented of the correlation between the ranking of biological research departmentsand the presence of absence of a medical school in the same institution.FindingsEngineering schools co‐located with medical schools are less likely to be top ranked.Engineering schools in private universities without medical schools are, in average,ranked 10 positions higher than engineering schools in private universities with medicalschools. Engineering schools in universities without medical schools have averagedepartmental quality factor about 0.50 points (out of 5) higher than engineering schoolsin universities with medical schools.There seems to be little to no correlation between the presence of a medical school andthe rankings of basic biological research programs. Three of the top five and six of thetop fourteen biological sciences programs belong to universities without a medicalschool; their average quality and rankings are essentially indistinguishable.Conclusions and recommendationsThere seems to be no positive correlation between the mere presence or absence of amedical school and the ranking of other research programs; in fact, the correlationbetween the presence of a medical school and the ranking of engineering is negative.Although some private universities combine a top medical school with top engineeringand biology programs (e.g., Stanford and, to a lesser extent, University of Pennsylvania),others have relatively weak programs in engineering (e.g., Duke, Johns Hopkins,Vanderbilt, Washington University in St. Louis, Yale) or biological sciences(Northwestern, Vanderbilt). In considering the Rice‐BCM merger, reasons should be1
identified that led to Stanford’s success and the relative lower effectiveness of otherpeer private institutions. Any merger execution plan should foster an environment thatis likely to lead to a Stanford‐like outcome rather to other potential scenarios.Follow‐up analysisLikely reasons for the negative correlation between presence of a medical school andranking of the engineering school are competition for internal resources and differencesin culture. This hypothesis is checked by comparing the relative size of the engineeringand medical school to their relative rankings. The data show that size imbalance is animportant factor in the rankings of the engineering school (overall institutional rankingis also an important factor). The proposed Rice‐BCM merger will lead to one of themost imbalanced institutions (together with Johns Hopkins and Vanderbilt) in the peergroup of universities with top engineering schools and is therefore likely to lead to anerosion of the institutional focus on engineering and, in the long term, an erosion ofeffectiveness and rankings of the school of engineering.2
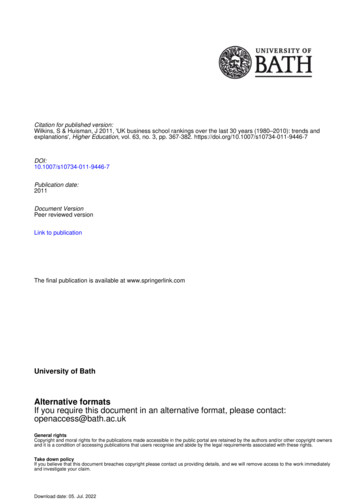
MethodsThe overall method of analysis is the comparative method (or natural experiment, seesupplementary information on page 5).Departmental quality rankings forBioengineering, Chemical, Civil, Electrical, and Mechanical Engineering were obtainedfrom US News 2008 edition (most recent rankings at the time of the study). Theserankings are compiled by asking US department chairs in each discipline to judge thequality of the scholarship of each US department, using a scale of 0 (poor) to 5(excellent). These rankings were favored over the US News overall engineering schoolrankings because of their higher accuracy. Students and prospective faculty consultwith their faculty advisors before deciding where to apply for graduate school,postdoctoral research, or faculty positions; therefore, rankings based on peer facultyassessment are the best indicator of a university ability to attract and retain topstudents, researchers, and faculty. In fact, the National Research Council used thiscriterion to rank‐order departments in the most recent published study [Research‐Doctorate Programs in the United States: Continuity and Change, National AcademiesPress, 1995; the new study is still unpublished].Universities that had at least one engineering department in the top‐25 departmentalrankings were included (even if the other departments were not top ranked); thisyielded a pool of 44 universities, 19 of which are private (including Cornell). 25 of these44 universities have a medical school. For numerical analysis, values of 1 and 0 wereassigned to universities that have or do not have a medical school, respectively.The quality of the engineering school was calculated in two ways: by averaging thequality of all five departments (schools which missed one or more departments werenot penalized), and by averaging the quality of Chemical, Civil, Electrical, andMechanical Engineering (i.e., excluding BioE). Preliminary work was done to includeComputer Science programs (which are often organizationally grouped with school ofArts and Sciences): the results change little when Computer Science is included in theanalysis (not reported in the analysis tables).The schools were ranked by overall quality of Chemical, Civil, Electrical, and MechanicalEngineering (BioE was excluded). The Pearson’s product moment correlationcoefficients were calculated to establish correlations between these variables: averagequality and presence of medical school; average quality (no BioE) and presence ofmedical school; rank in the list and presence of medical school. A Pearson’s coefficientof 1 indicates perfect correlation, ‐1 perfect anticorrelation, and 0 the lack of anycorrelation. The Pearson’s product moment correlation coefficient is equivalent to thepoint‐biserial correlation coefficient when one of the variables is dichotomous, and isequivalent to the Spearman’s rank correlation coefficient when one of the variables is arank‐ordering.The US News 2008 biological sciences rankings were used as primary data for theanalysis of the correlation between biological programs and medical schools.3
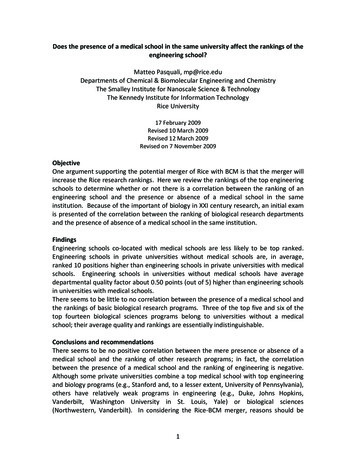
ResultsThe Pearson correlation coefficient shows a small to medium negative correlationbetween any of the quality indicators and the presence of a medical school:o Average quality and presence of medical school‐0.22o Average quality (no BioE) and presence of medical school ‐0.30o Rank in the list and presence of medical school‐0.31There are 19 private universities (including Cornell) in the list of top 44 engineeringschools. 12 have medical schools (including Cornell, whose medical school is about 220miles away from the main campus). When only these schools are considered, thenegative correlation becomes stronger:o Average quality and presence of medical school‐0.29o Average quality (no BioE) and presence of medical school ‐0.38o Rank in the list and presence of medical school‐0.36The average ranking and quality of the two groups are:Average RankingMedNoMedDiff.Cornell included27.33 17.29 10.05with Med SchoolCornell excluded28.91 17.29 11.62Cornell included28.91 16.38 12.53without Med SchoolAverage Quality(no BioE)MedNoDiff.MedAverage Quality(with 1‐0.55The table shows clearly that including Cornell in either peer group makes little to nodifference in the overall conclusions. In average, engineering schools without a medicalschool are ranked 10 to 12 positions above those with a medical school. Moreover, thepresence of medical schools has little effect on the quality metric when BioEngineeringDepartments are included. In average, the engineering schools without a medicalschool have a quality ranking of 0.5 points above those with a medical school. Thisspread is very substantial, because it constitutes approximately 28% of the range ofquality values (1.70 when BioE departments are considered, 1.93 when they are not).A simpler analysis is conducted of the top programs in the biological sciences.Top 5 programsTop 14 programsAverage Ranking (number ofschools in group)MedNo MedDiff.2.50 (2)2.67 (3)‐0.176.38 (8)6.50 (6)‐0.124Average QualityMed4.84.58No Med4.774.60Diff.0.03‐0.02
The table shows clearly that there is no difference in rankings (about one tenth of oneposition) and no statistical difference in the quality factors.Supplementary InformationHow can one study the effect of medical schools on other university programs“scientifically”? In the words of Jared Diamond (Collapse, Viking press, 2005):Science is often misrepresented as “the body of knowledge acquired byperforming replicated controlled experiments in the laboratory.” Actually,science is something much broader: the acquisition of reliable knowledgeabout the world. In some fields, such as chemistry and molecular biology,replicated controlled experiments in the laboratory are feasible and provideby far the most reliable means to acquire knowledge. [ ]I was immediately confronted with the problem of acquiring knowledgewithout being able to resort to replicated controlled experiments, whether inthe laboratory out doors. [ ] I had to use different methods. Similarmethodological problems arise in many other areas of population biology, aswell as in astronomy, epidemiology, geology, and paleontology.A frequent solution is to apply what is termed the “comparative method” orthe “natural experiment”—i.e., to compare natural situations differing withrespect to the variable of interest. [ ] There is a large scientific literature onthe obvious pitfalls of that comparative method, and how best to overcomethose pitfalls. Especially in historical sciences (like evolutionary biology andhistorical geology), where it’s impossible to manipulate the pastexperimentally, one has no choice except to renounce laboratoryexperiments in favor of natural ones.I used the comparative method to examine the effect of the presence or absence of amedical school on the quality of the engineering programs (as measured by the rankingsthat most reliably measure quality and affect recruitment of PhD students, postdocs,and faculty).5
Follow‐up analysis: effect of size of the medical school relative to the overall size ofthe institution and of the engineering schoolData on the total number of full‐time faculty in the university, in the medical school, andin the engineering school were collected from institutional websites (referencesavailable in excel format).Data on the quality and ranking of the medical schools was taken from the most recent(Spring 2009) US News report (attached). Of the top 50 medical schools, only privateinstitutions belonging to a university were considered (24 total). Of these, 11 haveengineering schools with at least one department ranked in the top 25, 7 haveengineering schools with no department ranked in the top 25, 5 have no engineeringschool, and one (Harvard) is difficult to classify (see Table for further information).The data shows clearly that in universities where the medical school is notoverwhelmingly large compared to the engineering school (size ratio of 3‐10), the twoschools have comparable quality and ranking. Interestingly, plotting ranking and qualityvs. the relative size of the medical to engineering school reveals that there seems to bean upper ceiling to the quality (or lower ceiling on ranking) of the engineering school asthe size ratio grows. In the best case scenario, if the relative size of the engineering andmedical faculty remains at the merger values, the quality of the engineering schoolwould not go up by more than about 0.2/5 points (it could go easily go down by a fullpoint, reaching the typical values for Yale, Darmouth, and other universities that are notconsidered in the present peer group). Achieving a Stanford‐like scenario would requiregrowing the engineering faculty (or shrinking the medical faculty) by a factor of five (i.e.,reducing the medical faculty from roughly 1600 to approximately 320, or enlarging theengineering faculty to about 500). Enlarging the engineering faculty would also requirea considerable growth in endowment to arrive at levels comparable to Stanford.Conversely, the data shows that Rice could increase the quality of the engineeringschool without adding a medical school, by following models close to Princeton, Cornell,and Carnegie‐Mellon—and, to a lesser extent, MIT and CalTech, which are morespecialized institutions.6
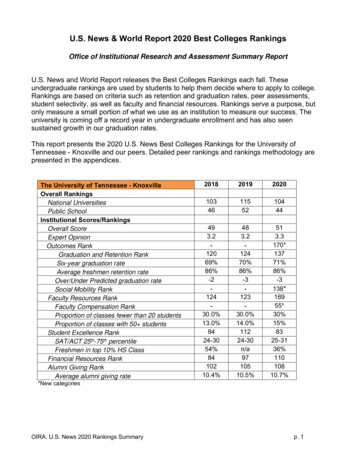
2008 US News 6272829303132333435363738394041424344MITUC BerkeleyStanfordCal TechUniversity of Illinois at Urbana‐ChampaignUniversity of MichiganGeorgia TechUT AustinPurdue UniversityCornellPrincetonCarnegie MellonUniversity of Wisconsin at MadisonUniversity of MinnesotaUC Santa BarbaraNorthwesternPennsylvania State University at University ParkVirginia TechUCLATexas A&MJohn HopkinsUniversity of Washington in SeattleUniversity of Maryland at College ParkUniversity of PennsylvaniaUniversity of California San DiegoRice UniversityUniversity of Southern CaliforniaUniversity of Florida at GainesvilleRensselaer Polytechnic InsittuteDuke UniversityOhio StateNorth Carolina StateUC DavisUniversity of Colorado at BoulderColumbia UniversityUniversity of DelawareUniversity of VirginiaLehigh UniversityCase Western Reserve UniversityWashington University in St. LouisVanderbilt UniversityBoston UniversityUniversity of PittsburghUniversity of Utahw/ BioENo BioEOverall Overall 93.353.353.43.263.353.13.633.33 83.022.902.72.962.882.83.232.85 NA2.842.652.82.782.60 NAEE MechE CivilE .24.74.54.7 4.24.24.03.14.14.03.6 NA4.33.93.92.83.83.83.83.33.53.83.63.13.63.5 NANA3.23.93.83.73.63.83.53.03.63.74.0 3.83.63.52.73.23.4 NA4.03.73.63.64.63.63.43.23.94.03.43.23.03.43.43.2 NA3.53.53.32.93.33.43.34.53.53.63.0 NA3.43.13.42.93.13.23.63.03.13.23.4 NA3.63.33.23.42.63.02.7 NA3.13.13.13.62.83.13.4 NA3.03.32.83.93.22.92.83.52.92.92.93.33.02.7 00550013100101006500NotesLarge, State‐supported, MidwestLarge, State‐supported, MidwestSeparate Med School, in NY City, 820 studentsLarge, State‐supported, MidwestLarge, State‐supported, MidwestLarge, State‐supportedLarge, State‐supportedMed School is at U Maryland in Baltimore
0313233343536373839404142434422.5w/ BioE No BioEOverall Overall CHBEMIT4.664.784.8UC Berkeley4.584.784.8Stanford4.484.684.5Cal Tech4.264.534.8University of Illinois at Urbana‐Champaign4.504.504.1University of Michigan4.204.304.0Georgia Tech4.344.283.9UT Austin4.024.184.3Purdue 034.034.4Carnegie Mellon3.764.003.9University of Wisconsin at Madison3.843.984.5University of Minnesota3.743.904.7UC Santa nia State University at University P3.463.583.4Virginia Tech3.553.552.9UCLA3.363.553.3Texas A&M3.423.533.1John Hopkins3.743.503.2University of Washington in Seattle3.643.483.4University of Maryland at College Park3.303.452.9University of Pennsylvania3.583.433.7University of California San Diego3.623.382.6Rice University3.483.383.3University of Southern California3.303.382.9University of Florida at Gainesville3.353.353.4Rensselaer Polytechnic Insittute3.263.353.1Duke3.633.33NAOhio State3.333.333.2North Carolina State3.243.333.4UC Davis3.263.333.4University of Colorado at Boulder3.303.303.5Columbia3.263.232.8University of Delaware3.103.104.1University of Virginia3.183.083.0Lehigh3.033.032.8Case Western Reserve University3.162.982.8Washington University in St. Louis3.022.902.7Vanderbilt University2.962.882.8Boston University3.232.85NAUniversity of Pittsburgh2.842.652.8University of Utah2.782.60NA3.593.60EE MechE CivilE 80STD Dev STD Dev STD Dev STD DevQuality correlations,without BioEQuality correlations, withBioERank correlationsPresence of medical schoolrelative to averageQuality relative to average( means higher quality),BioE is excludedQuality relative to average( means higher quality),BioE is includedRank relative to averageRankings from US News20080 if no medical school; 1 ifthere is a medical schoolRankings from US News2008Rankings from US News2008Rankings from US News2008Rankings from US News2008Average of CHBE, EE,MechE, CivilEAverage of CHBE, EE,MechE, CivilE, BioE2008 US News RankingsRankQuality ns
01010011101011011110.63MedSchool PrivateRankQualQual Med22.631.061.20 ‐0.6320.630.881.10 0.3719.630.660.95 ‐0.6313.630.260.47 0.3712.630.430.45 ‐0.6311.630.160.42 ‐0.637.630.080.10 0.372.630.14 ‐0.08 0.37‐0.37 ‐0.02 ‐0.14 0.37‐2.37 ‐0.12 ‐0.20 ‐0.63‐3.37 ‐0.30 ‐0.20 0.37‐5.37 ‐0.34 ‐0.23 ‐0.63‐6.370.03 ‐0.24 0.37‐11.37 ‐0.34 ‐0.35 0.37‐14.37 ‐0.57 ‐0.55 ‐0.63‐15.37 ‐0.44 ‐0.60 0.37‐16.37 ‐0.58 ‐0.68 0.37‐17.37 ‐0.64 ‐0.70 0.37‐18.37 ‐0.36 ‐0.73 0.373434.424.376.64 4.42STD Dev STD Dev STD DevSTD DevQuality correlations, without BioEQuality correlations, with BioERank correlationsPresence of medical school relative to averageQuality relative to average ( means higher quality),BioE is excludedQuality relative to average ( means higher quality),BioE is includedRank relative to average0 if no medical school; 1 if there is a medical 4NA3.93.53.34.0Rankings from US News 2008EE MechE .22.92.82.92.92.93.02.7NARankings from US News 2008Rankings from US News 2008Rankings from US News 2008MITStanfordCal TechCornellPrincetonCarnegie MellonNorthwesternJohn HopkinsUniversity of PennsylvaniaRice UniversityUniversity of Southern CaliforniaRensselaer Polytechnic InsittuteDukeColumbiaLehighCase Western Reserve UniversityWashington University in St. LouisVanderbilt UniversityBoston UniversityNo BioEOverall 62.882.83.232.85NA3.603.58Rankings from US News e of CHBE, EE, MechE, CivilEAverage of CHBE, EE, MechE, CivilE, BioE2008 US News RankingsRank Quality 36‐0.29‐0.38Correlations
HEALTHSchools of MedicineTHE TOP SCHOOLS RESEARCHRank/SchoolAssessment’08 NIHPeerscore by’08’08’08research’08’08’08 totalassessmentresidencyaverage average’08NIH research grants perfaculty/ out-of-state medicalOverallscoredirectors** undergrad MCAT acceptancegrantsfaculty member studenttuitionschoolscore (5.0 highest) (5.0 highest)GPAscorerate(in millions) (in thousands)ratioand fees enrollment1. Harvard University (MA)1002. Johns Hopkins University (MD)813. University of Pennsylvania793. Washington University in St. Louis795. University of California–San Francisco776. Duke University (NC)756. Stanford University (CA)756. University of Washington756. Yale University (CT)7510. Columbia University (NY)7311. University of California–Los Angeles (Geffen)7211. University of Michigan–Ann Arbor7213. University of Chicago (Pritzker)6913. University of Pittsburgh6915. University of California–San Diego6815. Vanderbilt University (TN)6817. Baylor College of Medicine (TX)6718. Cornell University (Weill) (NY)6619. Northwestern University (Feinberg) (IL)6320. University of North Carolina–Chapel Hill6120. U. of Texas Southwestern Medical Center–Dallas 6122. Emory University (GA)6022. Mount Sinai School of Medicine (NY)6024. University of Virginia5925. Case Western Reserve University (OH)5825. Mayo Medical School (MN)5827. Ohio State University5627. University of Wisconsin–Madison5629. University of Alabama–Birmingham5529. University of Colorado–Denver5531. New York University5431. University of Iowa (Carver)5431. University of Rochester (NY)5434. Brown University (Alpert) (RI)5335. Boston University5235. Dartmouth Medical School (NH)5235. Oregon Health and Science University5235. University of Minnesota Medical School5239. Georgetown University (DC)5139. University of Southern California (Keck)5141. University of Cincinnati5041. Yeshiva University (Einstein) (NY)5043. University of Maryland4943. Wake Forest University (NC)4945. Indiana University–Indianapolis4845. Tufts University (MA)4845. University of California–Irvine4848. University of California–Davis4648. University of Florida4648. University of 0.410.310.710.610.010.610.64.0% 1,228.76.8% 471.93.8% 516.211.1% 347.24.3% 457.34.2% 338.72.6% 236.2 *5.8% 566.15.9% 340.54.1% 342.93.7% 493.97.2% 347.53.8% 255.8 354.68.4%5.7% 284.85.8% 306.16.1% 229.64.2% 233.16.5% 252.65.7% 234.811.7% 191.77.3% 222.85.6% 209.214.0% 149.7 *8.6% 244.02.5% 202.99.1% 272.38.3% 139.212.3% 165.37.7% 162.47.2% 145.610.0% 133.06.4% 165.83.2% 113.64.9% 199.45.5% 69.24.8% 193.07.9% 146.33.8% 184.05.3% 144.29.5% 194.66.4% 170.67.2% 149.7 *3.6% 94.1 *14.0% 104.3 *7.9% 89.25.7% 106.04.3% 90.68.6% 79.923.8% 124.7 * 152.2 195.3 218.3 223.1 240.8 192.9 296.4 * 259.2 310.4 183.7 211.6 200.4 292.3 172.6 297.9 160.7 117.1 133.7 124.7 171.8 109.8 113.4 191.9 159.4 * 124.3 84.1 120.0 133.2 133.8 74.4 94.6 146.8 114.8 160.2 148.3 78.9 112.9 92.1 110.3 121.2 135.6 63.8 126.0 * 100.2 * 70.0 * 55.5 217.2 137.3 65.8 124.9 2.2 43,223 728 42,330 473 44,084 614 45,550 476 37,807 595 43,840 415 43,529 465 46,002 870 42,850 394 47,092 647 36,418 698 41,485 671 39,901 451 41,506 577 36,824 520 41,249 442 25,903 664 44,665 414 44,883 695 36,957 732 26,615 923 41,476 498 39,610 516 42,432 580 45,286 769 29,800 172 31,836 843 35,116 645 50,689 733 51,290 609 47,476 669 42,526 583 42,339 426 43,022 409 45,286 695 42,960 319 49,424 528 41,818 964 44,444 789 47,896 679 42,987 626 44,780 777 43,175 626 38,248 465 42,924 1,206 48,992 715 38,039 390 39,659 402 54,361 521N/A 445*The school reported only research grants that the National Institutes of Health made to the medical school. No grants to affiliated hospitals were reported. ** Assessment data collected bySynovate.Sources: U.S. News and the schools34USN&WR AMERICA’S BEST GRADUATE SCHOOLSMore at www.usnews.com/grad
THE TOP SCHOOLS PRIMARY CARERank/SchoolAssessmentPeerscore by’08’08% ’06–’08’08’08’08 totalassessmentresidencyaverage average’08graduates faculty/ out-of-state medicalOverallscoredirectors Selectivity undergrad MCAT acceptanceenteringstudenttuitionschoolscore (5.0 highest) (5.0 highest) rankGPAscorerateprimary care ratioand fees enrollment1. University of Washington1002. University of North Carolina–Chapel Hill863. Oregon Health and Science University824. University of Colorado–Denver805. University of California–San Francisco796. University of Vermont767. Mich. State U. Coll. of Osteopathic Medicine727. University of Massachusetts–Worcester727. University of Minnesota Medical School7210. University of California–Los Angeles (Geffen)707010. University of Iowa (Carver)12. University of Michigan–Ann Arbor6912. University of Pennsylvania6912. University of Wisconsin–Madison6915. Harvard University (MA)6815. University of Rochester (NY)686717. Baylor College of Medicine (TX)17. University of Nebraska College of Medicine6717. University of Pittsburgh6720. Michigan State University6521. Indiana University–Indianapolis6422. Dartmouth Medical School (NH)6322. University of Missouri6322. Wake Forest University (NC)6322. Yeshiva University (Einstein) (NY)6326. University of California–San Diego6226. Washington University in St. Louis6228. East Carolina University (Brody) (NC)6129. Brown University (Alpert) (RI)6029. University of New Mexico6029. University of Utah6029. University of Virginia6029. U. of N. Texas Health Sci. Ctr. (Col. of Oste Med.) 6029. U. of Texas Southwestern Medical Center–Dallas 6035. University of Alabama–Birmingham5935. University of California–Davis5937. Case Western Reserve University (OH)5837. Johns Hopkins University (MD)585837. Mayo Medical School (MN)40. Ohio State University5740. Tufts University (MA)5742. Emory University (GA)5642. University of Connecticut5642. University of Maryland5645. Duke University (NC)5545. Stony Brook University (NY)5545. University of Arkansas for Medical Sciences5545. University of Chicago (Pritzker)5545. Vanderbilt University (TN)5550. Medical University of South 92.93.22.94.13.64.03.53.83.43.03.33.73.43.53
in culture. This hypothesis is checked by comparing the relative size of the engineering and medical school to their relative rankings. The data show that size imbalance is an important factor in the rankings of the engineering school (overall institutional ranking is also an important factor).