Transcription
BIS RESEARCH PAPER NO. 110The relationship betweengraduates and economic growthacross countriesAUGUST 20131
The relationship between graduates and economic growth across countriesAuthors: Dawn Holland, Iana Liadze, Cinzia Rienzo and David Wilkinson,National Institute of Economic and Social ResearchAcknowledgements: We would like to thank Simon Kirby, Geoff Mason, MaryO’Mahony, Rebecca Riley, Ana Rincon-Aznar and members of the project steeringgroup for helpful comments. All errors are the responsibility of the authors.Correspondence: d.wilkinson@niesr.ac.uk2
The relationship between graduates and economic growth across countriesContentsContents. 3List of Figures. 5List of Tables. 6Executive Summary . 71Introduction . 92Graduates and growth: a review of the literature . 12342.1Theories of economic growth . 132.2Existing empirical evidence. 162.2.1Measurement and data issues in the literature . 172.2.2The stock of human capital . 182.2.3Human capital flows. 202.2.4Investment in human capital . 212.2.5Human capital measured by cognitive skills . 212.2.6The impact of higher education and skills . 22Data sources and descriptive statistics . 273.1Countries included, time period and sources of data . 273.2Measures of labour productivity . 283.3Measures of human capital . 33Growth accounting estimates . 373
The relationship between graduates and economic growth across countries564.1Measuring the wage and productivity premia of graduates . 374.2Growth accounting framework . 404.3Decomposing productivity growth . 434.4Sensitivity analysis for wage premia . 48Regression-based estimates. 535.1GDP Growth Models . 535.2Error Correction Models . 56Summary and conclusions . 59References. 62Annex . 674
The relationship between graduates and economic growth across countriesList of FiguresFigure 1. Distribution of the top 100 universities in the world . 10Figure 2. GDP (PPP) per capita by country, 1982-2005. 29Figure 3. GDP (PPP) per employment hour, by country 1982-2005 . 30Figure 4. Relative labour productivity levels, 1982, 1993 and 2005 . 33Figure 5. Tertiary education employment shares (percentage), by country 1982-2005. 34Figure 6. Correlation between output per employee hour and tertiary educationemployment share (1982-2005) . 36Figure 7. Average wage premia for high and medium levels of educationalattainment, 1982-2005 . 38Figure 8. Wage premia for high skilled workers 1982-2005, high and lowobservations. 39Figure 9. Average annual growth rates in GDP, hours worked and labourproductivity, 1982-2005 . 43Figure 10. Average contributions of growth in capital per hour worked, TFP and skillsto growth in output, 1982-2005. 45Figure 11. Contributions of higher, medium and low skills growth to output growth,1982-2005 . 46Figure 12. Models for wage premia of higher skills, UK . 50Figure 13. Contribution of graduate skills accumulation to GDP growth in the UKunder different assumptions, 1994-2005 . 525
The relationship between graduates and economic growth across countriesList of TablesTable 1. GDP (PPP) per capita and GDP per employment hour and annual averagechange, (index: USA 100 in 1982), by country, 1982-2005. 31Table 2. Tertiary education employment shares and annual average change bycountry, 1982-2005 . 35Table 3. Decomposition of average annual growth rates in output, 1982-2005. 47Table 4. Contribution of graduate skills accumulation to average productivity growthunder different assumptions, 1994-2005 . 51Table 5. Growth Regression Results: Ordinary Least Squares . 54Table 6. Error Correction Regression Results: Pooled Mean Group Estimates . 58Table A1. Cross-study comparison . 676
The relationship between graduates and economic growth across countriesExecutive SummaryHigher Education (HE) is recognised as a key economic sector in the UK, having animpact on economic growth and competitiveness. However, producing estimates ofthe impact of HE on growth and competitiveness is a major challenge. In mostcountries, there is a dilemma about the amount of public resources that should bedevoted to education, which has been amplified by the period of fiscal adjustmentfaced by many of the advanced economies. In this study we consider the evidenceon the impact of HE on economic growth and productivity, drawing conclusions onthe longer-term benefits of current investment in degree-level education.The objectives of this research are to: Explore the relationship between graduates and economic growth; Assess what should be the key variable (or variables) of interest; and Quantify the relationship.The empirical literature typically finds a positive relationship betweeneducation and GDP growth. However, a multitude of indicators are used,particularly to capture measures of education, which makes the studies hard tocompare. Most studies focus on GDP growth or the growth in GDP per capita, whilstmeasures of education fall into one of four types. Most commonly used are averageyears of schooling, but several studies consider school and university enrolmentrates; monetary investment in education; or internationally standardised test scores.Relatively few studies identify different levels of education, so the impact ofgraduates on growth is not often considered.A theoretical framework derived from a standard Cobb-Douglas production functionindicates that GDP per unit of labour input should be related to the share of labour ofa particular type (graduates or workers at different qualification levels) weighted bythe average human capital of the type of worker (captured by the relative wages ofdifferent types of labour input). Such data has recently been collated for many of the7
The relationship between graduates and economic growth across countriesadvanced economies through the EUKLEMS project. We exploit this data for 15countries for the period 1982 to 2005.Our key findings are: GDP per employment hour increased from 1982-2005 in all countries.The highest annual average percentage change was in Finland (2.7%); Japan(2.5%) and the UK (2.4%). These countries had the lowest level of GDP peremployment hour in 1982, whilst throughout the period considered theNetherlands and the US had the highest GDP per employment hour. The share of employment with tertiary education also increased from1982-2005 in all countries. The highest annual average percentage changewas in Australia (5.0%) followed by the UK (4.9%). Both of these countrieshad relatively low shares of employment with tertiary education in 1982 at6.0%, compared with 22.1% in the US and 18.7% in Finland. The largeincrease closed the gap, but the US and Finland still had higher employmentshares with tertiary education than Australia and the UK in 2005. Growth accounting analysis indicated that graduate skills accumulationcontributed to roughly 20% of GDP growth in the UK from 1982-2005.This approach limits the estimated impact to the productivity enhancementdirectly accrued to graduates and misses any externalities to HE which mayraise the productivity of the rest of the economy. Econometric analysisaddresses these issues. Our econometric analysis indicated that a 1% increase in the share ofthe workforce with a university degree raises the level of long runproductivity by 0.2-0.5%. The long-run adjustment is gradual, with about 515% of the correction absorbed per annum. With the UK share of theworkforce with a university education having increased by 57% between 1994and 2005, our estimates suggest this will have raised UK long-run productivityby 11-28%. This means that at least one-third of the 34% increase in labourproductivity between 1994 and 2005 can be attributed to the accumulation ofgraduate skills in the labour force.8
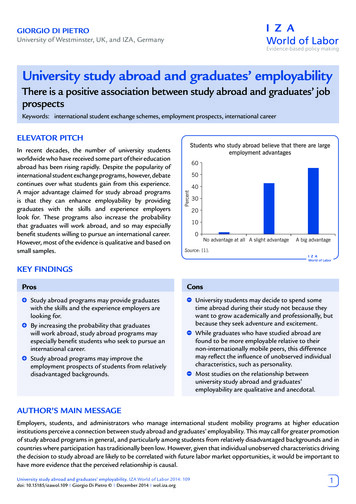
The relationship between graduates and economic growth across countries1. IntroductionThe role of Higher Education (HE) in improving economic growth andcompetitiveness is widely acknowledged. However, producing estimates of theimpact of HE on growth and competitiveness is a major challenge, and in mostcountries there is a dilemma over the amount of public resources that should bedevoted to education. This dilemma has become particularly acute during the difficultperiod of fiscal adjustment currently faced by many of the advanced economies. Theaim of this study is to consider the evidence on the impact of HE on economicgrowth and productivity, in order to draw conclusions on the longer-term benefits ofcurrent investment in university-based education. Within this, the objectives are to: Explore the relationship between graduates and economic growth; Assess what should be the key variables of interest; and, Quantify the relationship.Universities come in many guises. Some are centres for elite education, others forfrontier research, whilst the majority may be neither of these. The economic benefits,both to the individual and to the wider economy, of a university degree will clearlydepend on the quality and breadth of skills imparted. The set of countries covered bythis study contain 90 per cent of the 100 best universities in the world1 . Thissuggests that the returns to HE in this subset of countries may be higher, onaverage, than in many other countries. Barrell et al (2010) found a strong correlationbetween the number of such institutes per million of population and productivityperformance. Figure 1 plots the number of elite universities in each country in oursample per million of population. The US, the largest country in the sample, has 471We use the 2012-13 version of the Times Higher Education Supplement world university rankingswhich uses a combination of research, citations and teaching to rank the top 100 universities in theworld. See nkings.9
The relationship between graduates and economic growth across countrieselite universities, whilst the UK has 10 2 . The highest number per million of populationare found in the Netherlands and Australia, followed by Sweden and Belgium.Figure 1. Distribution of the top 100 universities in the world0.45per million anadaBelgiumAustriaAustralia0.00Source: Times Higher Education Supplement and NiGEM databaseUK universities have an outstanding research performance and reputation, which isreflected in international university rankings such as the QS ranking, the TimesHigher Education world rankings illustrated above, the Academic Rankings of WorldUniversities and the Shanghai ranking of the world’s top 10 universities. After theUnited States, the UK is the most preferred destination of international students. Inthe academic year 2010-11, nearly 300,000 foreign non-EU students, mainly fromChina and India, were willing to pay higher, international tuition fee rates to study inthe UK. In addition, 130,000 non-UK students from the EU were enrolled in a full orpart-time course at a UK higher education institution. In total, international studentsconstitute about 17 per cent of the student population.The recent report by the LSE Growth Commission, ‘Investing for Prosperity’,highlights the importance of maintaining funding for research and an open2There is an English language bias in the evaluation of elite universities, as the core language ofscience is English, and for instance if universities in France have policies to promote French languagejournals then their ranking will be affected. This bias does affect our overall conclusion.10
The relationship between graduates and economic growth across countriesenvironment in which universities can compete for the best minds – both in terms ofstudents and faculty. The report stresses that ‘the knowledge and understandingcreated in universities play a central role in building a flexible and adaptableeconomy’. Centres of HE benefit the economy through their role in the education andskill development process as well as providing centres for research that developproductivity enhancing innovations. They also act as an increasingly importantsource of export revenue, as HE becomes a globalised industry with enormousgrowth potential.Below we first review some of the key literature relating graduates and growth. Wethen review some key measures of productivity and human capital from a descriptiveperspective to provide context to interpret the existing literature and introduce theempirical work that follows. This is followed by an analysis of the contribution of HEskills to GDP growth using growth accounting techniques. This provides a usefulbenchmark for assessing the importance of HE relative to other productivityenhancing factors over the sample period. However, the approach limits theestimated impact to the productivity enhancement directly accrued to the graduates.Given the dual role of universities, which provide centres of education as well asresearch, this may well underestimate the total macro-economic effects of anexpanded HE system. It will also fail to capture other externalities to HE, such asimproved management techniques that raise productivity at all skill levels. In the finalsection we address these issues through a series of econometric estimates thatrelate the expansion of HE skills to productivity growth.11
The relationship between graduates and economic growth across countries2. Graduates and growth: areview of the literatureImprovements in educational outcomes have been widely recognised as essential inenhancing growth in both developed and developing countries. In the past fewdecades an influential macroeconomic literature has emphasised how education, asa measure of human capital, could generate long-term sustained economic growth.On the one hand, as claimed by Stevens and Weale (2003), since education deliverseconomic benefits to individuals, we should expect to see effects of education ongroupings of individuals (nations) too. On the other hand, education acquired byindividuals provides social returns at the macroeconomic level, yielding additionalindirect benefits to growth (Sianesi and Van Reenen, 2003).Theories of economic growth have emphasised the role of human capital and thedifferent mechanics through which it may affect economic growth. The maintheoretical approaches highlighting the connection between human capital andeconomic growth are the augmented Solow neo-classical approach and the newgrowth theories.The standard growth model developed by Solow (1957) extends the basic productionfunction by adding human capital as an extra input in the aggregate productionfunction, where the output of the macro economy is a direct function of factor inputs:physical capital, labour and human capital, augmented by a term known as theSolow residual, or total factor productivity, which drives technical progress or theproductivity of these factor inputs. The endogenous growth models argue that totalfactor productivity is determined within the model, instead of being driven byexogenous technological progress. Unlike the neoclassical theories, endogenousgrowth models have explicitly included education by emphasising its role inincreasing the innovative capacity of the economy through developing new ideas andtechnologies.12
The relationship between graduates and economic growth across countriesIn the next section of the report we set out the main approaches to modellingeconomic growth (Section 2.1). In Section 2.2 we discuss the main results from theempirical literature whilst highlighting some of the key measurement issues relatingto modelling the influence of graduates on growth.2.1Theories of economic growthThe modelling framework that has been adopted in the vast majority of empiricalstudies that assess the relationship between education and economic growth isconstructed around a simple Cobb-Douglas production function such as: (1) Y AK H1 where Y is output, A is total factor productivity, K is the stock of physical capital, andH is the stock of human capital. H can also be disaggregated into the average levelof human capital per worker (h) and the amount of labour input (L), so that we canexpress equation (1) as:(2) Y AK (hL )1 Some authors have treated this as a 3-factor production process, where labour inputis disembodied from human capital, as in Mankiw, Romer and Weil’s model (1992).The key difference being that the elasticity on h is not restricted to be the same asthe elasticity on L or K (although the three are still constrained to sum to one).Alternatively, L can be disaggregated into different types of labour, where hl isaverage human capital of worker type l and Ll is the amount of labour input of type l.In this case equation (1) can be expressed as:(3) Y AK LhLl 1 l l 1 Expressing the variables in terms of per unit of labour input and taking logs, equation(1) can be expressed as:KHY(4) ln ln A ln (1 ) ln L L L Or13
The relationship between graduates and economic growth across countries(5) ln y ln A ln k (1 ) ln hOr L hl Ll(6) ln y ln A ln k (1 ) ln l 1 L With y and k being, respectively, output and physical capital stock per unit of labourinput and hlLl/L is the share of labour input of type l weighted by the average humancapital of type l.In the original model developed by Solow (1957), A is assumed to be exogenous. Bycontrast endogenous growth models often include variables such as foreign directinvestment (FDI) and openness to capture the economy’s ability to absorbtechnology from abroad; and the domestic stock of R&D or government spending onR&D to capture the innovative capacity of the domestic economy. In addition, studiessuch as Bils and Klenow (2000) look for externalities to education (social returnsbeyond returns to the individual) by modelling A as a function of measures of humancapital/schooling in addition to the direct role expressed in equations (5) or (6)above.Based on the above derivation, we can describe a full long-run model that underliesthe majority of empirical studies of the relationship between education and growth 3as:(7) ln y ln A h, Z ln k (1 ) ln h where the variables are as defined above, ε is an error term and Z is a vector ofcontrol variables such as the degree of openness of economies to trade and foreigninvestment, R&D spending and various dummy variables to control for country- andtime-related influences on economic activity. The fundamental underlying frameworkis adapted in each study, depending on whether the authors are interested inexplaining differences in the levels of productivity across countries, differences in thegrowth rates of productivity across country, the development of productivity within a3The majority of studies surveyed by Sianesi and Van Reenen (2003) have this framework at theirfoundation, as do most of the studies reported in Table A1 (Annex).14
The relationship between graduates and economic growth across countriescountry or set of countries, or decomposing growth within a country or group ofcountries.Many authors have focused on explaining differences in the growth rate ofproductivity across countries (e.g. Judson (1998), Krueger and Lindahl, 2001 andBenhabib and Spiegel, 1994) and have utilised the difference version of equation (7)in estimation:(8) ln y 1 ln A h , Z 2 ln k 3 ln h Finally, many of the cross-country growth regression studies have combined thedynamic and level equations, to include some starting level measures, such as theinitial levels of income, physical capital, distance from the technology frontier orschooling (e.g. Levine and Renelt, 1992; Gemmel, 1996; Barro, 1997; Cohen andSoto, 2007):(9) ln y 1 ln A h, Z 2 ln k 1 ln h0 2 ln A h, Z where 0 indicates starting level values. The cross-section growth regression modelfrom equation (9) can be readily adapted to a dynamic framework, and expressed asan error-correction equation, with short-run dynamics around a long-run relationship,as used, for example, by Mason et al (2012). A full encompassing model, whichallows for the possibility that the relationship is purely dynamic with no long-runrelationship (e.g. δ2 0), can be expressed as: ln yt 1 2 ln yt 1 11 ln kt 1 12 ln ht 1 1z ln Z z ,t 1 (10) 2i ln yt i 3i ln kt i 4i ln ht i 4 zi ln Z z ,t i 3 ln kt 1 4 ln ht 1 5 z ln Z z ,t 1All of the modelling frameworks used in the empirical studies that we review can benested within equation (10), which we will use as the primary framework for oureconometric work.15
The relationship between graduates and economic growth across countries2.2Existing empirical evidenceTheoretical models, based on derivations similar to that presented above, imply thatsustained growth relies on the potential for human capital to grow without bound. Assuch, policy on education should be prioritised when considering the determinants ofgrowth (Temple, 2003). Empirical studies have been undertaken in order to supportthis theoretical premise. The most common empirical approach in the literature tostudy the impact of education on growth has been through cross-country growthregressions, using a framework such as that specified in equation (9) above. Thesestudies relate a measure of the growth rate of productivity to the average level, orgrowth rate, of education within a country.Sianesi and Van Reeenen (2003) provide a thorough survey of the empiricalevidence on the relationship between human capital and growth. They conclude thatthere is strong empirical evidence that human capital increases productivity,suggesting that education really is productivity-enhancing, rather than just a deviceused by individuals to signal their ability to potential employers. The studiessurveyed typically suggest that a one-year increase in average education is found toraise the level of output per capita by between three and six percent, or raise the rateof potential growth by just over one percentage point per annum – depending on thetype of model adopted.Table A1 (Annex) summarises the findings of a set of key studies on the relationshipbetween education and growth. This set includes some of the seminal paperssurveyed by Sianesi and Van Reenen (2003), but is primarily focused on morerecent studies that were not covered by this survey. Most of the papers that wesurvey typically present multiple model specifications and proxies to capture the keyvariables. However, the table only displays the main result/model for each paper 4 .The table also includes information on the measures used, time period and countrycoverage of each study.4Where it is difficult to identify a preferred or main result within a paper, we have selected the modelthat is most directly comparable to the empirical approach of this study.16
The relationship between graduates and economic growth across countriesAs the measures and structure of the models surveyed differ across studies, theempirical results are not strictly comparable. Nonetheless, the key message fromTable A1 supports the conclusions of Sianesi and Van Reenen (2003). Irrespectiveof the proxies and measures used in estimation, almost all the studies found apositive and significant effect of human capital on growth. The only exceptions arethe studies by Benhabib and Spiegel (1994) and Pritchett (2001) who found anegative, but not statistically significant relationship between human capital andgrowth. Holmes (2013) also failed to find a significant relationship between highereducation and GDP growth using a range of cross-country regression frameworks,and warns that the results of cross-country regression estimates, such as that usedby Gemmell (1996), should be viewed with caution, as the results are sensitive to thesample period and country coverage.2.2.1Measurement and data issues in the literatureEmpirical studies have adopted a range of different measures and proxies torepresent the variables underpinning the theoretical framework presented above. Forexample, y, which represents output per unit of labour input in equations (5)-(10),has been most commonly proxied by GDP per capita. A preferred measure wouldreflect developments in employment rather than total population – as demographicand other factors may affect the correlation between the two. However, this variableis difficult to measure for some countries – especially in studies that use a largecross-section of countries that include developing as well as developed economies.If average working time per employee is also non-stationary, output per hour oflabour input would be the preferred measure of y. Some studies have modelled totalfactor productivity (TFP) as the dependent variable, although this is not a directlyobservable figure and subject to a wide degree of measurement error.The presumption behind most of the empirical studies is that an educated labourforce is better at creating, implementing, and adopting new technologies, therebygenerating growth (Benhabib and Spiegel, 1994). One of the issues arising whenconsidering the effect of human capital on economic growth is how human capitalshould be measured (Hanushek and Kimko, 2000). The primary measures used tocapture the average level of human capital per worker include:17
The relationship between graduates and economic growth across countries the average number of years of schooling of the workforce or population,which assumes a linear relationship with human capital.the share of the workforce/population with specific educational qualificationsschool enrolment rates – especially as a starting value. This flow intoeducation is often used as a proxy for the potential stock of educationalqualifications, and is available for a very large cross-section of countries.a discounted wage premium of education over unskilled labour (Pritchett,1999)Mincer-style wage equations or Tornqvist relationships that relate humancapital to wage returns.investment in education – sometimes disaggregated by type (Aghion et al,2009)cognitive skills, usually measured through international test scores such asthe PISA and TIMSS.Over time, data improvements have meant that different, and often more appropriateindicators of human capital have become available for an increasing number ofcountries. The EUKLEMS database marks a significant improvement over previousdatasets, as it allows us to identify both the share of actual employment undertakenby individuals with different levels of educational attainment and also the share oflabour compensation that goes to each group. However, the database is o
reflected in international university rankings such as the QS ranking, the Times Higher Education world rankings illustrated above, the Academic Rankings of World Universities and the Shanghai ranking of the world's top 10 universities. After the United States, the UK is the most preferred destination of international students. In