Transcription
Effects of Administrator Evaluation Policy on Teacher Working Conditions andTurnover Regression1Theodore KaniukaAbstractIn 2010, North Carolina implemented a revised school executive evaluation instrumentrequiring school principals to utilize Teacher Working Conditions (TWC) as a componentof the school improvement process which, prior to 2010, was optional. Teacher WorkingConditions had been heralded as a way to improve student outcomes as well as addressthose conditions which caused teachers to leave a school. This study used data from 20042016 in piecewise regression and found that 1) teachers reported higher satisfactionbeginning in 2010, 2) impact on turnover was less clear, and 3) according to teachers, useof the survey results to improve schools is inconsistent.Keywords: Teacher Working Conditions, School Administrators, Policy, EvaluationDr. Theodore Kaniuka is a faculty member in the Department of EducationalLeadership and School Administration at Fayetteville State University. Prior toserving in higher education he was a district superintendent, school principal andheld several central office positions. His research interests are in Early CollegeHigh Schools, Teacher Working Conditions, and research methods.1Recommended Citation: Kaniuka, Theodore (2020). Effects of AdministratorEvaluation Policy on Teacher Working Conditions and Turnover Regression,Journal of Educational Leadership and Policy Studies, 4(1)Journal of Educational Leadership and Policy Studies (JELPS) Volume 4 Issue 1
IntroductionThe most recent data on teacher turnover claims that it remains around 8% in NorthCarolina; concomitantly, educator preparation programs have experienced a significantdecline in enrollment and production, with some down 25% since 2010 (Hinchcliffe,February 8, 2019). Historically, turnover has remained steady at approximately 12-14%.This recent one-year change is welcomed, but it remains to be seen if this change is atrend or a onetime aberration. Additionally, Hinchcliffe states that currently many NorthCarolina school systems face a shortage of elementary educators along with other highneed areas such as secondary math and science teachers. As has been well documented,the shortage of teachers is not isolated to North Carolina. A recent article by Sutcher,Darling-Hammond, and Carver-Thomas (2019) provided a realistic, but grim, forecast ofthe supply of teachers in the United States, as they claim that in 2017-18 there will be ashortage of approximately 112,000 teachers. A multitude of efforts have been presentedto address these issues nationally (see below) and, in particularly, in North Carolina. Toaddress the conditions in which teachers work, beginning in 2010, North Carolinaadministrators were required to use Teacher Working Condition (TWC) survey results inschool improvement (North Carolina Department of Public Instruction [NCDPI], 2019).The impetus behind the original implementation of the TWC in North Carolina was,among other motivations, an attempt to better understand how teachers see their workingconditions to improve said conditions and ultimately affect turnover and teachershortages (Hirsch, 2005). The purpose of this paper is to estimate the effects of statepolicy on school-level performance indicators to address, in part, the gap which existsbetween research and practice as posited by Cohen and colleagues (2009).Policy and Teacher TurnoverThe association between TWC and teacher attrition (turnover) appears well established.In general, as working conditions decline, or at least are perceived as unsupportive,teachers tend to leave for schools where they can be more successful, believe that theywill receive greater administrative support, and/or have improved relations andcollaboration with peers, school safety, and empowerment (Borman & Dowling, 2008;Boyd, Grossman, Ing, Lankford, Loeb, & Wyckoff, 2011; Hirsch & Church, 2009;Johnson, Kraft, & Papay, 2012; Kraft & Papay, 2014; Kraft, Marinell, & Yee, 2015;Ladd, 2011; Loeb, Hammond, & Luczak, 2005; New Teacher Center, 2014). Consideringsuch working conditions from a practical perspective, recent reports point to a need tofocus on working conditions to address teacher turnover and the difficulty, particularlyin North Carolina, in hiring either replacement or new teachers (Hinchcliffe, February 8,2019; Learning Policy Institute, August 24, 2017; NCDPI, 2019).More recent studies have shown that assessing school leadership as a component of TWCis imperative given the influence of school principals on teacher turnover (Kraft,Marinell, & Shen-Wei Yee, 2016; Learning Policy Institute, 2017). Taking this further,Carver-Thomas and Darling-Hammond (2019) suggest that to address attrition andshortages, school districts should assist school administrators in providing teachers withsupportive and nurturing school environments. They point to research demonstrating thatsuch efforts can yield positive outcomes for both students and teachers (DarlingHammond, LaPointe, Meyerson, Orr, & Cohen, 2007; Sutcher, Podolsky, & Espinoza,2017). In addition to focusing on the work school administrators do to foster moreJournal of Educational Leadership and Policy Studies (JELPS) Volume 4 Issue 1
supportive school environments, it has also been suggested that such shortages andattrition could be ameliorated by increasing compensation and develop a recruitmentprocess that targets potential new teachers (Carver-Thomas and Darling-Hammond,2019).In North Carolina at least, it is clear that the voice of the teacher has been heard.Policymakers have adjusted certain aspects of the system that indicate the importance ofteacher opinions, as early TWC analysis indicated that teacher perceptions of theirschools were associated with student performance (Hirsch, 2005). The importance of thevoice of the teacher is reflected in the 2010 revision of the school executive annualevaluation instrument used in North Carolina (NCDPI, 2015). The intent is clear, as inthe revised evaluation manual it clearly states that the principal “Utilizes data from theNC Teacher Working Conditions Survey in developing the framework for continualimprovement in the School Improvement Plan” (p. 12). Evaluating policy has been, andcontinues to be, considered vitally important in understanding how legislation at thenational, state, and/or local levels can influence educational outcomes (see Vedung,2017).Given that policy evaluation is a critical element in overall program improvement (Slavin,2002), this paper examines the association between implementation of the revised schoolexecutive evaluation requirements and certain school-level indicators. School-levelcovariates that were included were school achievement, poverty (defined by federalschool lunch participation rates), and the grade span for each school. Ladd (2011) foundthat these school characteristics were significantly related to how teachers perceived theworking conditions in their schools. Additionally, in a study that expanded on Ladd’searlier work, Johnson, Kraft, and Papay (2012) also found that teachers do tend to leavelow performing and high poverty schools at a greater frequency as compared to schoolsnot displaying these characteristics. Specifically, this study addressed the followingresearch questions:RQ1 –Is there a relationship between the implementation of the revised North CarolinaSchool Administrator Evaluation Standards and teacher turnover?RQ2 - Is there a relationship between the implementation of the revised North CarolinaSchool Administrator Evaluation Standards and Teacher Working Conditions?RQ3 – To what extent do teachers perceive that the results from the Teacher WorkingConditions survey are utilized by school administrators for improvement?MethodsPiecewise regression was used to estimate the effects of the implementation of the revisedevaluation policy. Piecewise regression was chosen to determine if at the point of policyimplementation and thereafter there were two distinct curves to the data, includingintercepts. To determine a starting point for the possible break in the data, graphicalanalysis was done to visually inspect the data. Once this was done, the data were codedinto two periods indicating pre- and post- policy implementation dates. This study usedthe approach suggested on the UCLA site (UCLA, July 8, 2019). The estimatedregression coefficients were tested (Chow, 1960) to establish if the estimate coefficientswere different.DataJournal of Educational Leadership and Policy Studies (JELPS) Volume 4 Issue 1
Bi-annually North Carolina administers the Teacher Working Conditions survey to allteachers and administrators. The survey includes seven categories that address conditionsin a school. This sample includes responses from 2004-2016 as shown in Table 1.Table 1Teacher Working Conditions Constructs and FocusConstructsUse of Time— Available time to plan, to collaborate, to provide instruction, and toeliminate barriers in order to maximize instructional time during the school dayFacilities and Resources— Availability of instructional, technology, office,communication, and school resources to teachersCommunity Support & Involvement— Community and parent/ guardiancommunication and influence in the schoolManaging Student Conduct— Policies and practices to address student conductissues and ensure a safe school environmentTeacher Leadership— Teacher involvement in decisions that impact classroom andschool practicesSchool Leadership— The ability of school leader- ship to create trusting, supportiveenvironments and address teacher concernsProfessional Development— Availability and quality of learning opportunities foreducators to enhance their teachingCharter, alternative, and other special schools have been excluded from the data set. Thisreduction in schools accounts for less than approximately 5,000 educators, leaving onaverage about 85,000 educators’ perceptions to be heard. The survey is anonymous, andit is therefore impossible to evaluate the effects at the individual teacher level. Thus, alldata were aggregatedJournal of Educational Leadership and Policy Studies (JELPS) Volume 4 Issue 1
Table 2Variables Used in the RegressionsVariablesDescriptionMeasurePre-Policy MeanThe predicted mean for teachersatisfaction close to policyimplementation yearContinuous 0-100%Policy MeanThe predicted mean for teachersatisfactionforpolicyimplementation yearContinuous 0-100%Pre-Policy SlopeSlope for teacher satisfactionprior to implementation yearContinuous 0-100%Policy SlopeSlope for teacher satisfactionpost to implementation yearContinuous 0-100%SchoolPerformancePercent of students meetingstate proficiency requirementsfor state accountability testsContinuous 0-100%School PovertyPercent of students in a schoolthat qualify for either free orreduced-price lunch servicesContinuous 0-100%School TypeCategorical variable classifyingschools as either elementary,middle or highCategorical (1, 2, or 3) withelementary as the referencegroupat the school level, resulting in approximately 2,200 schools in the sample. The scaleswere changed in 2008; therefore, to allow for inclusion, all data were recoded so the datarepresent the percentage of teachers in each school who reported either satisfied or verysatisfied. As mentioned earlier, school performance, poverty, and type (grade level) areincluded as controls as found in previous research these variables have been associatedwith both TWC and turnover (Ladd, 2011). Table 2 describes the variables used in thestudy.Journal of Educational Leadership and Policy Studies (JELPS) Volume 4 Issue 1
ResultsThe descriptive statistics are reported in Table 3, showing a relative steady rate of teacherTable 3Descriptive Statistics of Study Variables 768.582013201479.459.932015201679.294.21School PovertyMSDturnover from 2004 to 2016, concurrently, while there are some fluctuations from year toyear, overall, the TWC showed an increase of slightly less than 12% over the same timeperiod. It appears that teacher turnover was stable and seemingly invariant over thistwelve-year period. Below in Table 4 reports the pairwise correlations for the continuouspredictors, with all showing highly significant coefficients. Consistent with previousresearch (Ladd, 2011) the controls behave as expected, with negative correlationsbetween school performance and poverty and turnover, had a positive correlation withTWC. Poverty and turnover show significant relationships, with higher poverty schoolsreporting higher turnover. The relation between TWC and poverty seemingly runsJournal of Educational Leadership and Policy Studies (JELPS) Volume 4 Issue 1
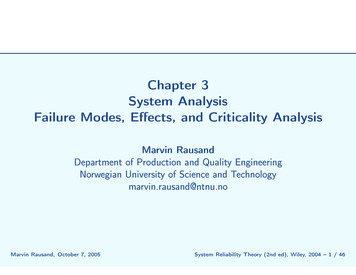
counter intuitively, as higher poverty schools report better TWC; again, the coefficient isvery small.Table 4Pairwise Correlations Among Study VariablesVariablesSchoolSchool PovertyPerformanceSchool .084Note: p 0.001 for all reported correlationsResearch Question 1The first regression reported in Table 5 is the estimated relationship between theimplementation of the revised evaluation policy and teacher turnover. The model withthe predictors was better than a constant only model with F(7,25964) 468.87, p 0.001,r2 0.11. However, the model accounts for only 11% of the variance in turnover. Thepre-policy means are the mean school turnover rate for the year just prior to policyimplementation and post-policy means begin the implementation year of 2010. The Chowtest for the difference in the means F(2,25956) 0.23, p 0.629 revealed that there is nosignificant difference in the means just for the year before and the implementation year.Table 5Piecewise Regression Results for Policy Implementation Year and Teacher ceLCIUCIPre-Policy MeanPost-Policy 10.161Pre-Policy SlopePost-Policy SlopeControlsSchool PerformanceSchool PovertySchool TypeHighMiddle-0.0030.002 0.001 0.001-8.42*4.74*-0.004 0.001-0.0020.003-0.0010.037 0.0010.002-25.43*15.18* -0.0010.032 220.030.025Note: * p 0.001However, the same cannot be said for the slopes, F(2,25956) 102.32, p 0.001,implying that the increase in the teacher turnover rate after the policy was implementedwas positive and significant. The controls appear to behave as expected, with middle andJournal of Educational Leadership and Policy Studies (JELPS) Volume 4 Issue 1
high schools predicted to have higher turnover than elementary schools. Figure 1 showsthe fitted values from the piecewise regression for teacher turnover. It is seen that in someyears there are schools with very large turnover rates. These schools were kept in theanalysis, as subsequent follow up did show that these data are accurate. In addition, figure1 shows that there was no appreciableFigure 1. Fitted Values for Regression on Teacher Turnoverchange in the mean turnover rate pre-policy and from the year it was implemented. Infact, the illustration does show a slight positive trend in turnover.Research Question 2The results for the second regression reported that the model (Table 6) was significantF(7,14028) 1836.65, p 0.001, r2 0.478, accounting for nearly 48% of the variance inTWC. The difference in means of 0.154 was found to be significant F(2,14020) 1323.81, p 0.001, implying that the year of implementation resulted in a large jump inoverall reported teacher satisfaction. Similarly for the slopes, we see that the differenceof 0.015 or 1.5% was significant F(2,14020) 286.03, p 0.001. The results show thatthe mean satisfaction of teachers increased at the onset of the revised administratorevaluation requirements and that over the next six years, teacher satisfaction did show asmall but positive increase.With regard to the controls, it is seen that both middle and high schools have lower TWCresults and, despite the fluctuations in poverty and performance as reported in Table 3,when examined over the span of the study, they are estimated to positively predictincreases in TWC. The drops in poverty in 2015 and 2016 may reflect an improvingeconomy as effects of the great recession. The changes in test scores reflect state changesin reporting test scores (Technical Bulletin, NCDPI. 2016) due to the elimination of somealternative assessments for students with disabilities.Journal of Educational Leadership and Policy Studies (JELPS) Volume 4 Issue 1
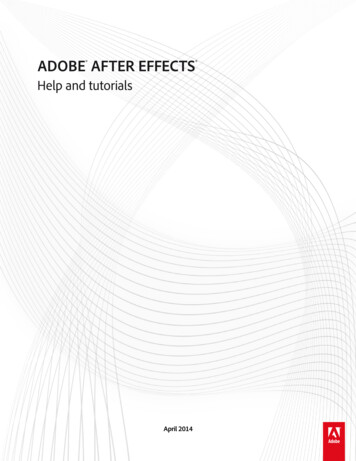
Table 6Piecewise Regression Results for Policy Implementation Year and Teacher lLCIConfidenceUCIPre-Policy MeanPost-Policy 50.612Pre-Policy Slope-0.003 0.001-3.66*-0.005-0.001Post-Policy Slope0.012 0.00122.12*0.0020.003SchoolPerformance0.002 0.00127.47*0.0020.002School chool TypeHighMiddleNote: * p 0.001Figure 2 shows the fitted values for the piecewise regression. This illustration clearlyshows the drastic shift in mean TWC results and the slight positive slope post-policychange.Figure 2. Fitted Values for Regression on Teacher Working ConditionsJournal of Educational Leadership and Policy Studies (JELPS) Volume 4 Issue 1
Figure 2 illustrates the pre-policy years’ teacher satisfaction results and trends for thesubsequent time periods, such that the jump in satisfaction occurred when policy wasimplemented and that there was a positive albeit shallow trend in teacher satisfaction.Research Question 3TWC surveys starting in 2012 added a new question “At this school, we utilize the resultsfrom the 2010 North Carolina Teacher Working Conditions Survey as a tool for schoolimprovement.” This question has been retained in subsequent versions of the survey withjust a year change. Examining the results for this question over the three administrationsof the survey shows that in 2012, 53% of the teachers reported either agree or stronglyagree, while 32% said they don’t know. For 2014 and 2016, the results were 58% and59% for agree and strongly agree respectively. As for the do not know, it was reported29% for both years. Put differently, over 25,000 teachers selected “I do not know” in2014 and 2016. Average school size in North Carolina is approximately 40 teachers, soon average about 12-13 teachers at each school report they do not know if TWC resultsare used for school improvement purposes. Coupled with strongly disagree and disagree,the percentages and numbers become even more significant.Discussion, Conclusion, and RecommendationsThere appears to be a void in research and evaluation of education policy and an evenlarger gap in the utilization of existing evaluations in the revision or formation of suchpolicy (Vedubg, 2017). This paper is significant on several fronts. First, the data usesresults over a 12-year period for over 2,200 schools and nearly 85,000 teachers for eachyear. This data set therefore includes the overwhelming majority of classroom teachersin North Carolina. Second, the study estimates the effects of policy on importanteducational and associated fiscal issues. Hirsch (2005) found that teachers’ perceptionsinfluenced student achievement, indicating that TWC are positively correlated withstudent achievement. Consistent with Hirsch (2005), using data in Massachusetts,Johnson et al. (2012) found that as teachers’ perceptions of their working conditions werehigher, so was student achievement. Furthermore, Geiger and Pivovarova (2018) foundthat teachers in Arizona who reported better working conditions tended to stay in theprofession at higher rates than those that did not. As well, Ladd (2011) found that teacherworking conditions are a reliable predictor of teachers’ intent to stay (weaker associationswith actual movement were found) and that administrative leadership is an importantaspect in defining teacher working conditions.The implementation on the school administrator evaluation policy appears to have hadno effect on teacher turnover. The intercepts and slopes were not found to be significantlydifferent, indicating that turnover remained stable with respect to policy effects. Thissupports the findings of Ladd (2011) in which TWC was weakly associated with bothactual and indicated turnover, implying that turnover is influenced by other factors.Looking at the control variables, it is seen that lower performing schools are predicted tohave lower turnover (coefficient is very small). In fact, the estimated coefficient forschool achievement is slightly larger than zero, indicating a minimal, if not consequential,effect on turnover. However, the poverty-turnover linkage was significant, with a oneunit change in a school’s poverty rate increasing turnover by 3.7%. Elementary schoolsJournal of Educational Leadership and Policy Studies (JELPS) Volume 4 Issue 1
(being the unit of comparison) were found to have lower rates of turnover than eithermiddle or high schools with high schools having a slightly greater turnover rate.Results indicate that once school administrators were held accountable for utilizing TWCresults as part of the school improvement process, there was a significant increase inoverall teacher satisfaction with the working conditions in their schools. Specifically,there was a change in the intercept of 15.4, indicating that pre-policy, the predicted meanwas considerably lower than the mean for the year of policy implementation. The slopeswere also different, indicating the rates of change were found to be different as well. Therates of change are small in size which reflects the relatively stable TWC satisfactionscores. Furthermore, it is seen that both teacher turnover and TWC scores fluctuatedduring the time period studied. When examined for correlation, it was found that TWCaccounted for less than 1% of the variance in turnover – clearly implying that turnoverappears to be fairly resistant to the effects of changes in teacher working conditions.An explanation for lower TWC scores in the earlier years (prior to the policy) may be afunction of sample bias. As reported in other studies (see Boyd et al., 2011), it was positedthat teachers who were unsatisfied could be motivated to participate at greater rates thanthose who were, therefore reporting a picture accurate for dissatisfied teachers but not forthe population as a whole. Thus, it may not be a function of administrators utilizing theTWC results for improvement, but rather larger sample sizes that were morerepresentative of the population causing a shift in satisfaction scores.As mentioned above, during the life of this survey, teacher participation increaseddramatically. In 2004, approximately 40,000 teachers responded, while in 2008 over120,000 responded (86% participation rate). In 2010, the numbers were 119,000 and 88%respectively. These participation numbers could be considered a limitation; however, theyear just prior to and the year of implementation are so similar that it is argued that theonly change is that of the policy and heightened school administrator interest in thesurvey. If so, this might explain the weak associations found between the implementationof the policy and little to no significant change occurring for turnover.The preceding explanation may have a degree of plausibility when examining the resultsfor research question three. Although this data is all post-policy change, it does cast somesuspicion on the effect of this policy on teachers’ perspectives. Nearly 30% of teachersstate that they do not know if the results from the TWC are being used to improve theirschools, indicating either the results are not being used at all or that teachers are unawareof the efforts. This suggests that teacher knowledge of the work being done as a functionof the TWC results is weak and leaves a large gap in drawing effect conclusions as to theactual consequences of the policy change.It must be mentioned that it is assumed that teachers are being truthful and feel free toanswer honestly – a critical assumption – and given the number of teachers reporting “Idon’t know,” this author believes this to be the case. If these responses are to beconsidered valid and representative, they call into question the pervasiveness of actualwork being done to improve the school environment. As shown above, the highpercentage of this response appears to indicate that there is a lack of systemic effort toutilize these results to improve the school environment.Journal of Educational Leadership and Policy Studies (JELPS) Volume 4 Issue 1
Policy InterventionsWhile this study does appear to support the assertion that the policy which requires schooladministrators to utilize teacher perceptions can affect school climate or workingconditions, influence on turnover seems less clear. Since 2010, teachers have reportedsignificantly higher ratings for their working conditions; however, the small amount ofthe variance explained is a serious limitation to any conclusions on its effects on turnover(see Ladd, 2011). This may not be dire, as all organizations have a core rate of turnoveror attrition. Each year employees retire, move, or make a career change and not allturnover has negative consequences for organizations (Abelson & Baysinger, 1984;Meier & Hicklin, 2007).In respect to the effects on turnover, the saying “weighing the cow does not increase itsweight” comes to mind. Clearly in this case, satisfaction and participation have shownincreases linked to the changes in administrator evaluation; however, to be deemed aneffective tool, a causal relationship must be established. Was the increase in reportedsatisfaction a function of the work school administration has done, or that consequencesof sample bias were somewhat ameliorated? This is a fundamental policy question withimplications for policy development. It must be established during the development ofpolicy what aims or goals are wanting to be achieved and once this has been decided on,creating a system with which to gather the necessary data for effect evaluation must beincluded in said work. Failure to consider these salient aspects leads policy makers to thevery disturbing conclusion – which is we just don’t know why this happened. Indeed,academic satisfaction improved, with the policy initially demonstrating a large andsignificant impact; however, as a continuous improvement tool, the policy has yieldedlimited benefit as teacher satisfaction has remained relatively constant, and teacherturnover has not improved. Perhaps there is an upper limit to teacher satisfaction and,once met by schools, little can be done to effect change.In pursuing improvements to teacher satisfaction, alternative approaches warrantattention. Given teacher shortages and the limited success of historical efforts to reduceattrition, it is critical to develop a system of interventions to address the wide ranging anddiverse causes of these issues (Carver-Thomas & Darling-Hammond, 2019). Accordingto these authors, improving the conditions in which teachers work has shown promise.Focusing on school administrators may offer utility, as recent research shows that statesand local school districts can positively affect school environments and teacher attritionby implementing policies and procedures (see Burkhauser, 2017; Kraft, Marinell, &Shen-Wei Yee, 2016). Despite this, from a policy perspective, this study shows that eitherattrition appears to be resistant to changes in teacher satisfaction, or that other factorsinfluence attrition more than how teachers view their working environments.RecommendationsThis study clearly shows that policy designed to affect what school administrators do andpay attention to can matter. This may be a result of asking good questions, but not theones that matter most to teachers in terms of improving their longevity as teachers.Therefore, it is imperative that additional research on similar policies designed to targetteacher-related issues is conducted with a keen focus on the degree to which actual effortsare being employed by key stakeholders and if such efforts can be linked with change.Journal of Educational Leadership and Policy Studies (JELPS) Volume 4 Issue 1
Kaniuka and Kaniuka (2019) conducted a narrow multi-year analysis of the associationsof teacher turnover, working conditions, and student achievement, finding that currentyear TWC have direct effects on teacher turnover and on student performance and thatcurrent or previous-year teacher turnover have no direct effects on student performance.Their research indicates that it is possible, and arguably even necessary, to assess thecurrent and long-term effects of the associations presented in the current study, as theselagged effects have serious implications for policy development. However, this studycould not use annual student testing results, as during the time periods of the studynumerous changes to standards used to assess student achievement and the data collectedby North Carolina changed. For policy researchers interested in the long-termconsequences of policy, such limitations are serious, and these limitations have equallyserious implications for understanding how the effects of policy are diffused over timeand location. Therefore, it is recommended that policy makers consider the long-termimplications of making substantive changes to data s
administrators were required to use Teacher Working Condition (TWC) survey results in school improvement (North Carolina Department of Public Instruction [NCDPI], 2019). The impetus behind the original implementation of the TWC in North Carolina was, among other motivations, an attempt to better understand how teachers see their working