Transcription
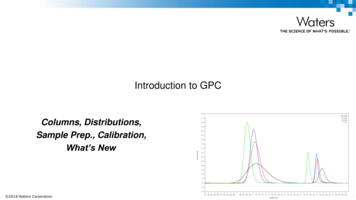
Introduction to GPCColumns, Distributions,Sample Prep., Calibration,What’s New 2018 Waters Corporation1
Polymer Analysis Techniques High Performance Liquid Chromatography (HPLC) (mainly Size ExclusionChromatography, SEC) Mass Spectroscopy (MS) Thermal Analysis (TA) Rheometry, Nuclear Magnetic Resonance spectroscopy (NMR), FourierTransform Infrared spectroscopy (FTIR) 2018 Waters Corporation2
What is GPC? Gel Permeation Chromatography (GPC) separates samplemolecules based upon their relative size in solution Size GelExclusion Chromatography (SEC)Filtration Chromatography (GFC) GPC is an isocratic mode of separation GPC is well-suited for polymer analysis – provides a “molecularweight distribution”Particles arePorous, rigidpolymericmaterials 2018 Waters CorporationBig ones are not sloweddown because they aretoo big to go into thepores, so they elute first3
What is GPC? The elution profile represents the molecular weight distribution based upon therelative content of different molecular weights Molecular Weight Based on size in solutionMwBigOnesComeOutFirstMnMzMz 1largestsmallestElution Volume (retentiontime) 2018 Waters Corporation4
Some definitions Molecular weight averages are used to provide numerical differences between samples– Mn: Number average molecular weighto At this point in the curve the number of molecules in the sample to left is equal to the number ofmolecules to the right– Mw: Weight average molecular weighto At this point in the curve the weight of the molecules to the left is equal to the weight of the molecules tothe right– Mz and Mz 1: these values are calculated based on molecular weight and abundance (obtained byultracentrifugation and GPC software computation)o The values are used for “comparison” purposes Known samples to unknown samples These averages are statistical moments calculated from the molecular weight distribution curve 2018 Waters Corporation5
Molecular Weight AveragesGPC Delivers all MW information with one experiment GPC calculates the MW distributionof the polymer; this distribution canbe measured for:– Mn can affect a polymer’s brittleness,flow and compression properties.– Mw is related to strength properties,and impact resistance– Mz is related to elongation andflexibility, (Gumby - rubber)– Mz 1 is related to die swell,(extrusion parameter) 2018 Waters Corporation6
Molecular Weight/Physical Property ctofHighMWLowMWImpactStrengthPropertiesof eltFlow 2018 Waters Corporation7
GPC Process –Separates by Size in SolutionSample“Bank” of3 GPC ColumnsPolymerBigOnesComeOutFirstVo 2018 Waters CorporationMolecular Weight Distribution ChromatogramVt8
What is happening inside a column?Separation by size –Usually no chemicalRetention mechanismBOCOF 2018 Waters Corporation9
Basic Column Information Columns are put together in seriesto form a bank ( 2) Always put the highest pore sizecolumn first (from the injector), andsmallest pore size column last– This reduces back pressure on themost fragile column (LMW column) Ramp the flow up slowly –0.1ml/minute – 1.0 ml/minute insmall increments* Change over solvent at a0.1ml/minute flow rate over nightSome applications atHigh Temperature 150 C 2018 Waters Corporation10
GPC Column Types Organic vs. Aqueous GPC columnsDifferent Pore SizesAnalytical vs. Preparative GPC columnsConventional vs. Solvent efficient, andHigh speed GPC columns. 2018 Waters Corporation11
Care and Use of GPC Columns Basic GPC – typically a bank of 3 columns of different pore sizes to cover a broad MW range (asneeded) Never use methanol or acetonitrile with Organic GPC columns because certain polar solvents willshrink the column, causing it to void– Note: Make sure to flush the complete system with solvent to be used before connecting the columns tothe system Life time of the columns can be as long as 1 year or more Store the columns in the solvent used with the column bank kept together Make sure that the end fittings on the column are tight to keep the column packing from drying out Be careful not to drop the columns, because they are fragile Filter sample solutions Prevent air bubbles from getting into columns 2018 Waters Corporation12
GPC Rules Polymer is dissolved in a solvent at a low concentration ( 0.10% w/v) Polymer solution passes through crosslinked, organic gel columns packed with controlled poresize particles. Larger molecules do not fit into pores (they are excluded) and elute first Vo : Exclusion volume Vt : Total volume or Permeation volume Exclusion principle assumes no adsorption of polymer molecules on packing material Every polymer will be eluted between Vo and Vt 2018 Waters Corporation13
Detectors in Polymer Chromatography Concentration– Response concentration, (C)– Refractometer; N (dn/dc) C Structure-selective– UV/Vis Detector (Also can use as concentration detector if sample has UV response), Lambert-Beer Law– IR Molecular weight sensitive– Response C x f(M)– Light scattering: f(M) M; M(C)– Viscometer: f(M) [ ] kM ; [ ]C Where k, alpha are the Mark-Houwink constants– Mass Spec.: f(M) 1/M; C/M 2018 Waters Corporation14
Refractive Index (RI) Definition RI’s were among the first detectors used in LC/GPC, (late 1960’s) Typically referred to as a “Universal Detector” Detects all dissolved solutes – “non-specific” Refractive index of any optical medium is defined as the ratio of the speed of lightin a vacuum to the speed of light in the medium Detection based on the refractive index of a given analyte Measures the difference in RI from the eluent to the dissolved sample, (differentialtype)– The greater the dRI, the stronger the signal Sensitivity increase as RI difference increases 2018 Waters CorporationSR15
UV/Vis Detection High SensitivityHigh SelectivityGain information on chemical compositionCan be used in gradient modeExcellent for most polymer additivesLinear response over a wide absorption range:A x l x C (Beer/Lambert)Sometimes UV/Vis detection is used for– Higher detection sensitivity.– Copolymer analysis (usually coupled with RI detector)– Under gradient elution condition. 2018 Waters Corporation16
Polystyrene StandardsUV Detection at 260nm0.160.150.14(Same Pore Size as Conventional Column Set)0.13Flowrate: THF at 0.60 ml/min0.12AU6.0mm X 15cm RT MB-M Column (1)0.11Injection Volume: 5 µl0.10Detector: 2487 UV @260nmPS .55.05.56.06.57.0Minutes 2018 Waters Corporation17
Evaporative Light Scattering Detector Evaporative Light Scattering Detection for polymer characterization– ELSD is a concentration detector.– ELSD is not affected by solvent changes– Most appropriate detector for Gradient Analysis of Polymers (GAP) or Gradient PolymerElution Chromatography (GPEC)– Good alternative to dRI for compounds having a low dn/dc Evaporative Light Scattering Detection for additives– ELSD is a universal detector– Compounds without UV-chromophore groups will be detected 2018 Waters Corporation18
Evaporative Light Scattering Detector Polymers are combined with low molecular compounds (0.1-3%) Additives have several key functions :– Protection : light stabilizers, antioxidants, anti-UV– Safety : flame retardants– Processing : plasticizers, slip agents Full characterization of synthetic polymers involves detection of additives Most of slip agents do not absorb UV light. ELS Detector is a good alternative toUV detection 2018 Waters Corporation19
0.00 2018 Waters Corporation5.0010.00Minutes15.0015.00Irgafos 168Irganox 107610.00Irganox 1330Irganox 1010Tinuvin 3285.00CrodamideSucconox 18Naugard 445Luwinox 44B25Tinuvin 312Succonox 16Tinuvin PIrgafos 168Irganox 1076Irganox 1010Irganox 1330Tinuvin 328Naugard 445Succonox 18Succonox 16BHTLuwinox 44 B25Tinuvin 312 Tinuvin PAdditives MixtureComparison of Detection ModesUV Detection (220 nm)Crodamide (oleamide) isnot detected in UV mode20.00ELS Detection20.0020
GPC Calibration - Narrow StandardsA calibration curve is built with low dispersity(narrow) standards with known molecularweight; (ideal if same structure as unknownpolymer)(PS, PMMA.).This calibration curve may be used toquantitate a polymer of different nature (PC,PMMA.). Then results are expressed in PSor PMMA equivalents, (or relative to PS orPMMA – incorrect for the polymer sample ofinterest).The chromatographic process is based onhydrodynamic volume (H)(size in solution), and not molecular weight.Two different polymers with the same MWwill elute at different retention volumes.NoresolutionABOVEthis MWResolutionrangeis created bydifferences inelution timeMW*RangeNoresolutionBELOWthis MWVoExcludedVTotalElution Time or Volume*MW is Log scale 2018 Waters Corporation21
Creating Column “Banks”Same “Pore Size” ColumnsNoresolutionABOVEthis MWResolution rangeis created bydifferences inelution timeMWRangeResolution rangeis created bydifferences inelution timeMWRangeNoresolutionBELOWthis MWNoresolutionBELOWthis MWVoExcludedVTotalElution Time or Volume 2018 Waters CorporationNoresolutionABOVEthis MWVoExcludedVTotalElution Time or Volume2 Columns of the SAME Type- SAME MW Range- More Resolution22
Creating Column “Banks”Different “Pore Size” ColumnsNoresolutionABOVEthis MWResolutionrangeis created bydifferencesin elutiontimeMWRangeNoresolutionABOVEthis MWResolutionrangeis created bydifferences inelution timeNewMWRangeNoresolutionBELOWthis MWVoExcludedVTotalElution Time or VolumeNoresolutionBELOWthis MWVoElution Time or VolumeExcludedVTotal2 Columns of the Different Type- EXPANDED MW Range- More Resolution 2018 Waters Corporation23
Actual Calibration Curves for the Different Pore SizeHT ColumnsHigh TemperatureHT 2 for Low MWHT 6 for High MWHT 6E for Blended 2018 Waters Corporation24
GPC Calibration 1 – Narrow StandardsTo build a calibration curve:6.46.26.0Log(M)5.85.65.45.25.0Elution volume at peak heightCurve : Log(M) f(Ve)4.84.64.4Log Mol WtNarrow dispersity standards(PD 1.1)4.24.03.83.63.43.23.02.82.6181920212223Time (min)242526279100Calibration:1. Usually 10 standards usedbracketing MW range2. Standards may be injected as amixture3. Mixtures should be 1 order ofmagnitude different (1000,10000,100000) 2018 Waters Corporation1900001100000Elutionvolume25
GPC Calibration – Narrow StandardsOrganic PolymersAqueous PolymersPolystyrenePoly(ethylene oxides)PolybutadienesPoly(ethylene renes 2018 Waters Corporation26
Narrow Standards - Preparation Considerations Narrow standards may be mixed together to develop a relative calibration curve– No more than 3 in one “cocktail” – be careful of concentrations– MW’s should be one decade apart Narrow standards should only be swirled gently No need to filter narrow standards Add antioxidant if high temperature application 2018 Waters Corporation27
Sample Preparation Considerations Sample may be mixed to facilitate dissolution– Be careful of shear for high MW ( 1M) samples In some cases, sample solution should be filtered– Presence of microgels, fillers, any other insolubles Allow enough time for complete dissolution For certain crystalline polymers, high temperature may be needed– Example: Isotactic polypropylene requires 2 hours at 170C in an external oven– The PP may then be run at 145C 2018 Waters Corporation28
Sample Concentration Guide The more dilute the polymer solution, the better– This will prevent viscosity effects and non-reproducible retention– A dilute solution will allow the polymer to open up into its most relaxed conformationoNo chain entanglementoNo microgel formation Injection volume no more than 100 µL per column For very high MW polymers, flow rate may have to be lowered– HMW columns may be needed as well to prevent shear 2018 Waters Corporation29
Sample Concentration Guide MW 1,000 0.20 – 0.30% MW 1,000 – 10,000 0.15 – 0.20% MW 10,000 – 100,000 0.10 – 0.15% MW 100,000 – 500,000 0.05 – 0.10% MW 500,000 – 1M 0.01 – 0.05% MW 1M 0.005 – 0.01%Above concentrations assumeno more than100 µL injection per column 2018 Waters Corporation30
GPC Column Operation Techniques Switch solvents by flushing to the column at0.1ml/min overnight in the new solvent Increase flow rates at 0.1 ml/minute/minute to thecolumns specified flow rates Recommended to keep the flow through the columnsat low flow, 50 100 ml/minute when idling For TCB at 140 - 150 C - purge the toluene out of thecolumns at 0.1 mL/min. overnight at 80C and thenramp up to temperature over 300 min after 3 columnvolumes of TCB have passed through Detection– RI– Viscometry– UV 2018 Waters Corporation31
Polymer Distributions A polymer is a mixture of different size chain lengths of the same monomer. Tomeasure this distribution of sizes we use molecular weight averages. Slices are made to the chromatogram, where the height of each slice (Hi),represents the population of molecules at that chain length or MW.HiElutionvolume 2018 Waters Corporation32
Polymer DistributionsMPMwMvMzMz 1High MW 2018 Waters CorporationMnMv is derivedfrom ViscometryLow MW33
GPC and Flow Rate PrecisionLC Peak Identification (Narrow Standard)Based on retention timeMwMnMolecular Weight DeterminationGel permeation chromatography (GPC)Based on volume of solvent flowing through the columnVeEssential for the flow rate to be absolutely constantTo calibrate, plot Log MW of standards vs volume (time)Any flow variability will result in large MW errors 2018 Waters Corporation34
GPC and Flow Rate PrecisionPrecise solvent flow is essential for precise GPC MwMnVe 2018 Waters Corporation35
Practical use – Fingerprinting the Polymer Comparisons of Molecular Weight Distributions of different samples can highlight even small MW shiftinformation (good vs. bad PP’s below) Determine "good from bad" - e.g. QC of resin batches these are typical formulators – use Mw, Mn, Mz �0.400.200.003.50 2018 Waters Corporation4.004.505.00Log MW5.506.006.5036
Degradation of Polyethylene Terephthalate – HFIP1.21.1Aged PET1.0Virgin PETVirgin PETdwt/d(logM)0.90.80.70.60.5PET Exposed To Oils AndRefrigerants For Several DaysAt Elevated 4.03.83.63.43.23.02.8Log Mol Wt 2018 Waters Corporation37
GAP of Additives 2018 Waters Corporation38
Gradient Analysis of Polymers (GAP)In recent years there has been increased interest in using gradient HPLC techniques, suchas Gradient Polymer Elution Chromatography (GPEC), with polymers for determining thecompositional drift of copolymers, the composition of polymer blends, or for the analysis ofpolymer additives. Depending upon the gradient conditions and columns selected foranalysis, separations may be obtained dependent on molecular weight or based uponprecipitation, or adsorption mechanisms. The use of an Evaporative Light ScatteringDetector (ELSD) allows one to perform solvent gradients with a universal mass detector andobserve both UV absorbing and non-UV absorbing polymer samples without baselinedisturbances from the solvent gradient. The addition of a Photodiode Array Detector (PDA)allows for compositional analysis across the molecular weight distribution of manycopolymers, can be useful for the identification of components in a polymer blend, and alsois invaluable for the quantitation of polymer additives and other small molecules intraditional reverse phase separations. 2018 Waters Corporation39
Experimental ConditionsSystem:Detector 1:Detector 2:Data System:Column:Flow Rate:Samples:Gradient: 2018 Waters CorporationWaters Alliance 2690 Separations Module with column heaterat 30 ºCWaters 996 Photodiode Array DetectorAlltech Model 500 ELSD with LTA Adapter(Drift Tube at 40º C, 1.75 Liters/min Nitrogen)Waters Millennium 32 Chromatography ManagerAs listed in Figures, 30 ºC1mL/min10 - 25 µl injections of 0.2 - 0.5% samplesLinear gradient, conditions and mobile phases as listed inFigures.40
GPC Analysis of a Polymer Blend 2018 Waters Corporation41
Gradient Analysis of a Polymer Blend100Polystyrene90Styrene-ButadieneRubber(50% Styrene)807060% THF50StyreneAcrylonitrile(25% y Shield C8 Column (3.9x150mm)100% ACN to 100% THF over 20 minutes ELSD Detection 2018 Waters Corporation42
Gradient Analysis of Narrow PS Standards100289090Styrene 02,890,00070%THF6050403020100123456Time (Minutes)7Symmetry Shield C8 (3.9x150mm)100% ACN to 100% THF over 10 minutes ELSDDetection 2018 Waters Corporation89101143
100% Butadiene8022% Styrene9030% Styrene10040% Styrene100% StyreneAnalysis of Styrene-Butadiene-Styrene Block% otype DVB/Vinylpyrolidone Column (3.9x150mm)100% ACN to 100% THF over 20 minutes ELSD Detection 2018 Waters Corporation44
Calibration of %Styrene in SBR's 2018 Waters Corporation45
Gradient Analysis of Low Molecular Weight Waxes222018"C18 wax"m 16V1412108"Slack wax"61112131415Time (Minutes)161718Nova-Pak C18 (3.9x150mm)100% ACN to 100% THF over 30 minutes ELSD Detection 2018 Waters Corporation46
Polymer Additives – Tinuvins, (UV Stabilizers)28Tinuvin 9002624Tinuvin 4402220mV18Tinuvin32816141210864141618ELSD Detection 2018 Waters Corporation202224Minutes2628303247
Polymer Additives – Phthalate Plasticizers11.0DOP 05.55.01416182022ELSD Detection 2018 Waters Corporation2426Minutes28303234363848
Polymer Additives - Slips and 0Stearic Acid6040200141618202224Minutes2628303234ELSD Detection 2018 Waters Corporation49
Polymer Additives - AntioxidantsOverlay of 12 injections of Antioxidant StandardUV Detection at 230nm 2018 Waters Corporation50
APC System 2018 Waters Corporation51
Birth of Polymer ChromatographyDow/Waters Collaborations in GPC 1962 - Jim Waters builds prototype low volume, high temperature refractometerfor John C. Moore, Dow Chemicals 1963 – Waters exclusive license of US 3,326,875, “ Separation of Large PolymerMolecules in Solution” from Dow Chemicals 1964 – Key paper by Moore– Reduces analysis from days to hours– Coins term “GPC” 2018 Waters Corporation52
GPC:1964 to today Little change in column technology Primarily polymer-based resins– Styrene-DVB– Methacrylates Low resolution technique– Particle size reduction 75 micron to 5 microno Minimal resolution improvement– Limitations in minimizing instrument dispersion “Universal columns” and fast GPC columns– Compromise speed for resolution– GPC/SEC remained a slow technique 2018 Waters Corporation53
A Novel, Practical Approach toSEC/GPC AnalysisACQUITY Advanced Polymer Chromatography (APC ) System 2018 Waters Corporation54
What’s is the APC System? ACQUITY APC System– Introduced at Pittcon 2013(Philadelphia) GPC/SEC polymer characterization with– sub-2µm /sub-3µm rigid hybrid particlesoBEH chemistry introduced in 2004 Complete solution– New higher efficiency columnsoaqueous and organic– New chromatographic systemoDesigned for high efficiency columnsoLow dispersion, precise flow rate 2018 Waters Corporation55
Recent Trends Polymer DevelopmentModern Chemistry- Functional polymers- End-groups- Pendant groups- Better control- Polymerization reactions- Molecular weightaverages &polydispersity- Next gen catalysts- New, innovative polymerstructures 2018 Waters CorporationGreen Chemistry- Decrease organic solvents inprocesses- Increase water basedprocesses- Bio-sourced polymers- Biodegradable polymersKey: Lower average molecularweight polymers56
Analytical ChallengesSpeed of AnalysisCurrent approaches tosize based separationscompromise- Peak resolution- Characterization- Data qualityGel Based ColumnsTypical materials include- Styrene-DVB- MethacrylatesRelatively fragileSolvent to solventconversion not easyPoorly ResolvedLow Molecular WeightPolymer & OligomersTraditional GPC is a lowresolution techniqueLow resolution limitscharacterizationinformationInnovative polymers andbuilding blocks needhigh resolutionACQUITY APC SystemACQUITY APCTM System 2018 Waters Corporation57
Limitations of High SpeedGel Permeation Chromatography.Data Courtesy of Janco, M; Alexander, J; Bouvier, E; Morrison,D; Ultra High Performance Size Exclusion Chromatography ofSynthetic Polymers; Pittcon 2013; Session 2360-1 2018 Waters Corporation58
Advanced Polymer Chromatographyversus High Speed Gel Permeation ChromatographyData Courtesy of Janco, M; Alexander, J; Bouvier, E; Morrison,D; Ultra High Performance Size Exclusion Chromatography ofSynthetic Polymers; Pittcon 2013; Session 2360-1 2018 Waters Corporation59
Low MW Polymer: Resolution RealizedACQUITY APC Systemwith RI4.6x150mm; 45Å XTPolystyreneStandard 510 Mp 2018 Waters CorporationHPLC System with RI6x150mm HSPgel HR160
Speed of Analysis & Better CharacterizationAlliance GPC system3 x Styragel 7.8 x 300mm (4e, 2, 0.5)Polystyrene calibration (100K, 10K, 1K)5.65.2Log Mol Wt4.804.404.003.603.202.802.4015161718195.50Better calibration more accurate data2122Retention Time2324252627ACQUITY APC system3 x APC TMS 4.6 x 150mm (200,45,45)Polystyrene calibration (100K, 10K, 1K)5.004.50Log Mol WtMore resolution morepoints for low molecularweight calibration204.003.503.002.502.002.4 2018 Waters Corporation2.62.83.03.23.43.63.84.0Retention Time4.24.44.64.85.061
Speed of Analysis & Better Characterization Higher resolution & speed of APC–Easier to run more calibration standards, faster More calibration points Better calibration Bettercharacterization FASTER calibration Calibrate in less than 30 minutes, not hours DAILY calibration, not weekly easier to monitor data consistencyand qualityGPC 2018 Waters CorporationAPC28.004.9062
Gel Based Columns versus Rigid Hybrid ParticlesTHFOne System.DMFOne Bank of Columns.Solvent Flexibility.Toluene 2018 Waters Corporation63
Ethylene-Bridged Hybrid (BEH) Particle lane(TEOS)EtO (BTEE )IncompleteEtOHydrolyticCondensationEtOOCH2 mer(POS)no/wemulsionXTAQ 2018 Waters CorporationColumn PackingSizing&Pore Ripening64
ACQUITY APC ColumnsBuilt on Bridged Ethylene Hybrid (BEH) More than 10 years experience– sub-2µm particles submitted to extreme conditionso pH, temperature, back pressure, flow rates, BEH particles combine advantages of silica & polymeric material– Rigid, pressure resistant– Particle size & pore diameter well-controlled– Inert, resistant to temperature changes E-cord device– Traces usage historyo QC certificate, injection count, temperature, back pressure) 2018 Waters Corporation65
ACQUITY APC Column Options Particles based on BEH chemistry Five pore sizes–––––45 Å (200 – 5,000) 1.7µm125 Å (1,000 – 30k) 2.5µm200 Å (3,000 – 70k) 2.5µm450 Å (20k – 400k) 2.5µm900 Å (300k – 2M) 2.5µm Two surface chemistries– Organic solvent- XT– Aqueous buffers – AQ Three column lengths– 30 mm– 75 mm– 150 mm Internal diameter: 4.6 mm 2018 Waters Corporation66
Rigid Hybrid ColumnsSolvent Flexibility4.00Poly(methyl methacrylate coethylacrylate)822722.00µ R IUTHF0.00-2.004.00% coepichlorohydrin)DMF81709after0.00-2.004.00µ R IU2.00Poly(methyl methacrylate coethylacrylate)81365beforeToluene0.00µ R IUpoly(methyl methacrylate co ethyl acrylate)in THFµ R IU2.00Poly(9,9 di-noctylfluorenyl 2,7 inutes 2018 Waters Corporation67
Summary Size Exclusion and Interactive polymer Chromatography are complimentarytechniques for polymer characterization– SEC measures MWD of polymers– IPC measures CCD of copolymers and blends– Gradient HPLC can be used for polymer additive analysis (deformulation) New ACQUITY APC System––––––––Brings all the advantages of sub-2µm & sub-3µm particles to polymer characterization (GPC/SEC)Analysis time reduction by 5x (at minimum)Daily calibration is easyNew columns compatible with any solventRigid, BEH particlesUse one column set for different solventsAchieve better results fasterHigher resolution, especially in low MW area 2018 Waters Corporation68
2018 Waters Corporation69
2018 Waters Corporation 3 What is GPC? Gel Permeation Chromatography (GPC) separates sample molecules based upon their relative size in solution Size Exclusion Chromatography (SEC) Gel Filtration Chromatography (GFC) GPC is an isocratic mode of separation GPC is well-suited for polymer analysis - provides a "molecular weight distribution"