Transcription
IndustryOutlook 2022Sponsored by
Table of ContentsForeword.04Core Findings.05Introduction.08U.S. Apple Production.14U.S. Apple Utilization.21U.S. Apple Trade.24Global Apple Production.28Appendix.33ACKNOWLEDGMENTSUSApple is grateful to all who contributed to this report including the California Apple Commission (CAC), China’s Chamber of Commerceof Foodstuffs and Native Produce, the Fruit and Vegetable Growers of Canada, the Northwest Horticultural Council, The MarketingAssociations, the U.S. Department of Agriculture (USDA), the Washington State Tree Fruit Association (WSTFA) and the World Apple andPear Association (WAPA).USApple would also like to extend a special thanks to AgroFresh for sponsoring this important industry publication.DISCLAIMERWhile efforts have been made to ensure the accuracy and reliability of the information contained in this report, all information in thisreport is provided by the U.S. Apple Association (USApple) “as-is” with no guarantee of completeness, accuracy or timeliness and withoutwarranty of any kind expressed or implied by USApple. Use of such information is voluntary, and reliance on it should only be undertakenafter an independent review of its accuracy, completeness and applicability. 2022 U.S. Apple Association. Reproduction in whole or in part of the material contained herein is prohibited without prior permissionfrom USApple.For more information, contact the author of this report, Christopher Gerlach, Director, Industry Analytics at USApple:7600 Leesburg Pike, Suite 400 East Falls Church, VA 22043 703.442.8850 usapple.org cgerlach@usapple.org
Tables & FiguresTABLESTable 1:Table 2:Table 3:Table 4:Table 5:Table 6:Table 7:Table 8:Table 9:Table 10:Table 11:Table 12:Table 13:Table 14:Table 15:Table 16:Table 17:U.S. Apple Production & Utilization SummaryU.S. Fresh Apple Trade SummaryGlobal Apple Production SummaryU.S. Farm-Gate Prices & Values, by UseU.S. Apple Production, by StateU.S. Apple Production, by VarietyU.S. Apple Production, by Variety, by StateU.S. Apple Retail Prices, by Select VarietiesU.S. Apple Market Shares, by StateU.S. Apple Utilization, by StateU.S. Apple Utilization, by VarietyU.S. Fresh Apple TradeU.S. Apple Juice Concentrate TradeEuropean Apple Production, by Select CountriesEuropean Apple Production, by Select VarietiesCanadian Apple Production, by ProvinceCanadian Apple Production, by Variety, by ProvinceFIGURESFigure 1:Figure 2:Figure 3:Figure 4:Figure 5:Figure 6:Figure 7:Figure 8:Figure 9:U.S. Apple Production, Varietal SummaryU.S. Apple YieldU.S. Food & Beverage Store E-Commerce SalesU.S. Apple Production: 1946-2022(F)U.S. Apple Production Extended ForecastU.S. Apple Production Trends, by Select VarietiesU.S. Apple UtilizationU.S. Fresh Apple Trading PartnersU.S. Monthly Fresh Apple TradeAPPENDICESAppendix A: U.S. Apple Juice Concentrate Imports, by Top CountriesAppendix B: Global Apple Production, by Country: 2020
ForewordAs a third-generation apple grower, I’mpassionate about my orchards, my people,my community, and my industry as a whole. While notan easy business, it is a rewarding one and I considermyself incredibly fortunate to be a part of such a dynamic,wholesome and economically important endeavor.Our business has changed considerably since mygrandfather started planting apple trees in 1954.Specialized rootstocks have been developedto resist damage from pests and disease. Highdensity cultivation systems have been engineeredto increase yield. Dozens of new varietieshave been created to surprise and delight anincreasingly discerning consumer. And, beyondthe orchard, innovations in sorting, packing andstorage technologies ensure that consistent,high-quality U.S. apples are shipped across thecountry and around the world year-round.Even with all those advancements, the applebusiness is as challenging as it’s ever been. Whilewe’ve always been subject to Mother Nature’sunpredictability, the frequency and severity ofadverse events appears to be increasing. The costof everything from fertilizer to fuel to freight – notto mention labor – is skyrocketing, squeezingalready thin margins. And trade wars are closingonce-profitable foreign markets, leading to anover-supply and lower prices domestically.Despite these challenges, the U.S. apple industrycontinues to provide Americans with theirfavorite fruit – 26 pounds of apples and applejuice per person, per year! The industry alsoprovides jobs and economic activity in thousandsof cities and towns from coast to coast. U.S. applegrowers are responsible for creating around150,000 jobs, generating more than 8 billion intotal wages and 2 billion in tax revenues. Whenaccounting for the total downstream effects, theindustry is responsible for almost 23 billion ineconomic output!USApple Industry Outlook 2022 - ForewordThe following report is a critical resourcefor the more than 26,000 U.S. apple farmerswho need to keep up on the latest trendsin production, utilization and trade. Theindustry relies on these data to make informeddecisions for the coming crop year andbeyond, ensuring that U.S. growers remaincompetitive both at home and abroad.But this is not just a report for industry insiders.Given the importance of the apple industry tothe U.S. economy and to national food security,legislators and regulators must also be aware ofthe challenges and opportunities we are facing.With this understanding, it is hoped that policymakers will have the confidence to consistentlysupport our industry and the many Americanswho have come to rely on us.Much of my passion for this industry isdriven by my desire to see that the industrysurvives and thrives for the next generationof apple growers. In my own family, if mychildren choose this way of life, they wouldbe seventh-generation farmers thanksto my wife’s deep ancestral roots. Byworking together, we can safeguard theseopportunities while continuing to provide theworld with America’s favorite fruit.CHRIS ALPERSChairman, USAppleusapple.org 4
Core FindingsBased on the most recent estimate from the U.S. Department of Agriculture (USDA), U.S. appleproduction for the 2022/23 crop year (CY) will be 255 million bushels, a 2.7% increase from lastyear.1 These apples will have a farm-gate value of almost 3.2 billion, generated primarily from freshapple production (see Table 1).This figure has been adjusted by USApple to include “Other” states, a category no longer reported by USDA. For more information onthe adjustment, refer to the U.S. Apple Production section in the body of this report.1 USApple Industry Outlook 2022 - CoreU.S. AppleFindingsUtilizationusapple.org 5
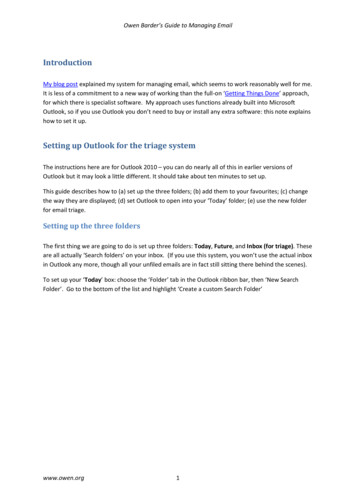
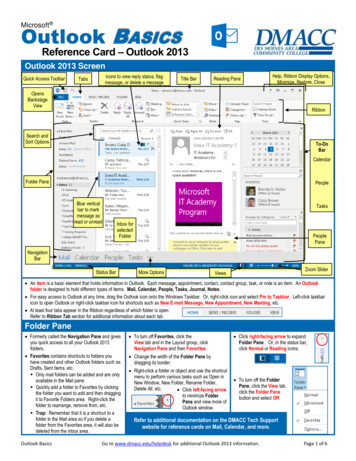
At the state level, Washington will remainthe nation’s top producer with an estimatedcrop of 155 million bushels valued at morethan 2 billion. This production levelrepresents a 4% decrease from the 2021/22CY. Following a sizable reported crop lastyear, Pennsylvania is expected to experiencethe largest drop in production in percentageterms, decreasing by 17% year over year.Conversely, Michigan is expected todramatically increase apple production overhistorically low 2021/22 levels – increasing by68% or 10.6 million bushels.top varieties along with current productionestimates and 5-year growth rates.Table 1: U.S. Apple Production & Utilization SummaryAt the varietal level, Gala is expected to retainthe top spot with almost 46 million bushelsproduced, accounting for around 18% of theU.S. apple market. Rounding out the top five areRed Delicious (34 m bu), Fuji (26 m bu), OtherVarieties (25 m bu) and Honeycrisp (25 m bu).Over the last five years, Honeycrisp, PinkLady/Cripps Pink and Other Varieties havebeen on the rise largely at the expense of RedDelicious. Varieties on the decline relative to2017/18 CY production levels include GoldenDelicious and Gala. Figure 1 highlights theseLEVELSVALUEYR-OVER-YR% CHANGETotalProduction254,958,714 3,158,311,2452.7%Fresh170,867,895 2,796,744,0792.5%Processing75,703,470 361,567,1671.9%Not Sold8,387,349 -14.8%2022/23 (F)BY STATEWashington154,761,905 2,048,232,577-3.8%New York34,523,810 349,267,9768.2%Michigan26,190,476 339,614,29167.7%Pennsylvania10,952,381 105,952,586-17.4%California5,714,286 72,332,18911.1%Virginia4,404,762 49,670,92412.8%Oregon4,166,667 38,677,54012.5%Other14,244,428 154,563,1622.7%Sources: USDA, National Agricultural Statistics Service; USAppleNotes: Production levels are in 42-pound bushels.Utilization shares and value data are based on five-year averages:2017-2021.Year-over-year changes are calculated on levels.Figure 1: U.S. Apple Production, Varietal Summary7065605550-14%4540-41%3530-4% 60% 48%25-21%20 40%15105M BUs2022/232017/18 Honeycrisp Other Varieties Pink Lady/Cripps Pink Fuji Golden Delicious Gala Red DeliciousSources: USApple; California Apple Commission; Washington State Tree Fruit AssociationUSApple Industry Outlook 2022 - Core Findingsusapple.org 6
With respect to fresh apple imports andexports, the U.S. still retains a healthypositive trade balance. In the 2021/22 CY(July to June), the U.S. exported more than38.5 million bushels of fresh apples whileonly importing around 6.3 million bushels.These net exports (32.2 m bu) are valued atalmost 730 million (see Table 2).On a year-over-year basis, the balanceof trade has declined with respect toboth quantity and value. On the quantityside, imports have increased by 20% over2020/21 CY levels while exports havedeclined. On the value side, exports haveincreased marginally, but imports are upalmost 30%. This means that in the 2021/22CY, the U.S. was bringing in a greateramount of more expensive fruit and sendingout a smaller amount of slightly moreexpensive fresh apples.As for global supply, China will continue todominate the world market, producing andestimated 1.9 billion bushels in 2022/23.This represents a significant 20% decreasecompared to 2021/22 production levels.Europe is expected to increase production,growing by 1.3% year over year to almost639 million bushels. South America, alreadywell into their season, was expected to fall8.5% short of last year’s crop, producingaround 147 million bushels. Mexico ispredicted to have a sizable gain in thecoming crop year, increasing productionto 43 million bushels up 11% from 2021/22.Finally, Canada is expected to slightlyincrease production by 1% to almost 19million bushels (see Table 3). 2Table 2: U.S. Fresh Apple Trade Summary2021/222020/21YR-OVER-YR% CHANGE-9.1%LEVELSU.S. Balanceof Trade32,229,20935,443,161Total Exports38,502,51340,656,962-5.3%Total Imports6,273,3045,213,80020.3%VALUEU.S. Balanceof Trade 729,334,000 746,756,000-2.3%Total Exports 922,692,000 896,266,0002.9%Total Imports 193,358,000 149,510,00029.3%Sources: USDA, Foreign Agricultural Service; USAppleNote: Trade levels are in 42-pound bushels.Table 3: Global Apple Production Summary2022/23 (F)United StatesYR-OVER-YR% ,2841.3%South es: USDA, National Agricultural Statistics Service andForeign Agricultural Service; USApple; United Nations, Food andAgricultural Organization; World Apple and Pear Association; Fruit& Vegetable Growers of CanadaNotes: Production levels are in 42-pound bushels.South American crop year is earlier than northern hemispherecountries by approximately six months.Additional data and analyses regardingestimates for 2022/23 U.S. and global applecrop production, utilization and trade arecontained in the following report.The European total represents the production from 21 select countries. The South American total represents the production fromthree select countries. For more information about the countries included, refer to the Global Apple Production section in the bodyof this report.2 USApple Industry Outlook 2022 - Core Findingsusapple.org 7
IntroductionDespite the challenges of the past two and a half years, the U.S. apple industry is alive and wellin 2022. First, the COVID-19 pandemic tested the industry’s ability to adapt to supply chaindisruptions, additional labor regulations, and changing consumer buying behaviors. Second, anddue in part to the first, the U.S. has been experiencing significant price inflation and a slowdown inoverall economic growth. While these issues have put pressure on operating margins, the appleindustry continues to adjust, learning from challenges and taking advantage of opportunities asthey arise. To assist in that endeavor, the following report provides users with the most up-to-datedata and analysis on U.S. and global apple production, utilization and trade. The remainder of thissection is intended to provide those data and analyses with relevant context.USApple Industry Outlook 2022 - IntroductionU.S. Apple Utilizationusapple.org 8
U.S. MacroeconomicConditionsAt the start of the COVID-19 pandemic in early2020, the U.S. officially met the definition of arecession by posting two consecutive quartersof negative GDP growth. Fortunately, theeconomy roared back to life in Q3 due largelyto unprecedented levels of stimulus spending.Throughout the remainder of 2020 and 2021,the economy continued to be strong withaverage quarterly growth in excess of 5.25%.Unfortunately, along with this growth camesignificant and sustained price inflation spurredon by Russia’s invasion of Ukraine. To combatthis, the Federal Reserve has been steadilyincreasing interest rates2 from March 2022 lowsof 0.25% to its most recent July announcementof 2.5%. While this rapid 2.25 percentage pointincrease has had limited success controllinginflation, it has effectively checked economicgrowth. Advance Q2 2022 estimates from theBureau of Economic Analysis suggest thatthe U.S. has, once again, officially dipped intoa recession with two consecutive quarters ofnegative economic growth.3Although it is too soon to tell whether the latestJuly interest rate hike has or will slow inflation,the June consumer price index (CPI) indicatesthat prices are continuing to rise – at anincreasing rate. The CPI for “All Items” grew by14.4% from March 2020 to June 2022 with mostof that increase occurring in the last year.4As of July 2022, the country has gained back22 million jobs and the unemployment rate isdown to 3.5% bringing total employment backto pre-pandemic levels.5U.S. Apple MarketConditionsWhile the (un)employment data above isfocused on nonfarm labor, any assessmentof the U.S. apple industry must consider theagricultural employment situation as well. Byall accounts, domestic agricultural labor hasbeen getting harder and harder to find. From2016 to 2021, average annual crop productionemployment fell by 3% and, in apple orchardsspecifically, it declined by 22%.Some attribute those decreases to thecombination of an aging existing workforceand immigration policies that do not prioritizeindividuals with agricultural backgrounds. Thatis, the U.S. is losing domestic workers fasterthan it can replace them. And so, increasingly,the U.S. agricultural sector has had to turn toseasonal migrant labor (H-2A visas) to meetits needs. In 2012, there were 100,475 certifiedH-2A positions. That figure ballooned to almost318,000 certifications in 2021 – a 216% increaseover the decade.7On the positive side, the U.S. continues toadd jobs. From February to April 2020, theU.S. lost 20.7 million nonfarm jobs and theunemployment rate rose from 3.5% to 14.7%. U.S. Department of Commerce, Bureau of Economic Analysis. Gross Domestic Product, Second Quarter 2022 (Advance Estimate) andAnnual Update.4U.S. Department of Labor, Bureau of Labor Statistics. Consumer Price Index: January 2020-June 2022.5 U.S. Department of Labor, Bureau of Labor Statistics. Current Employment Statistics and Current Population Survey: January 2020July 2022.6U.S. Department of Labor, Bureau of Labor Statistics. Quarterly Census of Employment and Wages: 2016-2021.7U.S. Department of Labor, Employment and Training Administration. Office of Foreign Labor Certification: 2012-2021.3USApple Industry Outlook 2022 - Introductionusapple.org 9
Table 4: U.S. Farm-Gate Prices & Values, by UseThis is a critical issue for the U.S.apple industry because this source oflabor is expensive and getting moreso. Over the last five years, the U.S.average Adverse Effect Wage Rate(AEWR) – the minimum compensationrate for H-2A labor – has increasedby 25% to 15.03 per hour. For thetop-seven apple-producing states,that average is 16.15 per hour – a29% increase from 2017 levels. In 2022,the top three AEWRs in the U.S. werein apple producing states: Oregonand Washington at 17.41 per hourand California at 17.51 per hour. Thisyear, another apple-producing state,Pennsylvania, was tied for the largestyear-over-year increase at 10.6%.8These trends are particularlychallenging for the tree fruit industrywhich cannot utilize automation in thesame way as many other crops. Appleharvesting and much of the packingare done by hand. By some estimates,labor accounts for between 60%-70%of variable costs for apple growers.9Beyond labor, U.S. apple producershave been facing mounting inflationarypressures in other areas as well. Duein large part to Russia’s invasion ofUkraine, the prices for fertilizersand chemicals, the second largestcategory of variable costs for U.S.apple growers, have also beenskyrocketing. Additionally, the pricesfor fuel oil and gasoline/diesel havealso risen dramatically, increasing bymore than 70% since June 2021.102022/23 (F)2021/225-YR. AVERAGEPRICE PER POUNDTotal 0.30 0.32 0.30Fresh 0.38 0.40 0.38 0.11 0.14 0.11ProcessingVALUE OF PRODUCTIONTotal 3,158,311,245 3,032,674,000 3,057,447,400Fresh 2,796,744,079 2,621,496,000 2,700,125,000 361,567,167 411,178,000 357,322,400Juice & Cider 117,892,580 134,068,687 116,508,532Canned 150,870,973 171,572,064 149,099,761Dried 25,208,982 28,667,920 24,913,031ProcessingFrozen 26,415,057 30,039,482 26,104,947Fresh Slices 32,695,200 37,181,327 32,311,361Other 8,484,375 9,648,521 8,384,769Sources: USDA, National Agricultural Statistics Service; USAppleNotes: Five-year averages do not include 2022/23 (F) data.2022/23 (F) data are based on five-year-average prices: 2017-2021.Sub-processing value data are based on 2017 price ratios and five-yearaverage shares: 2013-2017.2020 to March 2022. It has since come downslightly from those highs, but the fact remainsthat the cost of growing apples is significantlymore now that it was just a year or two ago.11Unfortunately, while the prices of labor,fertilizer and diesel have been increasing, theprice that growers are receiving for appleshas not. From 2012-2016, the five-year averagefarm-gate price for all apples was 0.32 perpound. From 2017-2021, that price had droppedtwo cents to 0.30 per pound – not accountingfor inflation.12 Table 4 highlights the year-overyear and year-over-five-year trends for pricesand value by use.With these and other cost factorsrising, the producer price index forapples rose by over 30% from MarchU.S. Department of Labor, Employment and Training Administration. Adverse Effect Wage Rates: 2017-2022.This figure was quoted by several industry members with in-depth knowledge of apple cultivation expenses. According to USDA’sEconomic Research Service which reports income and expense data for a limited number of crop types, labor accounted for 46% of allvariable expenses for specialty crops (fruits, vegetables and nuts) in 2020.10U.S. Department of Labor, Bureau of Labor Statistics. Consumer Price Index: June 2021-June 2022.11Federal Reserve Bank of St. Louis. FRED Economic Data: January 2020-June 2022.12USDA, National Agricultural Statistics Service. Price Received, All Apples: 2012-2021.8 9 USApple Industry Outlook 2022 - Introductionusapple.org 10
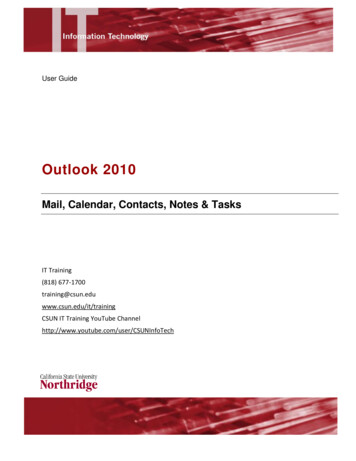
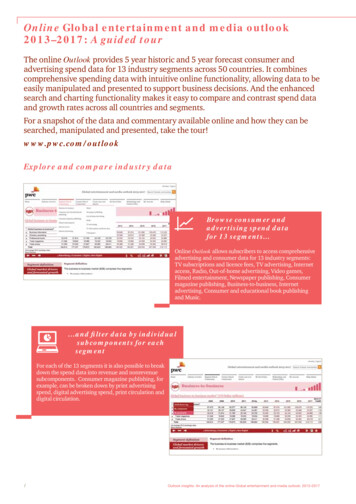
Figure 2: U.S. Apple It should be noted, however, that higher retailprices do not necessarily translate to highergrower prices/revenues. While some of theprice hike may be due to retailers passingalong higher farm gate prices, it is morelikely that they are an attempt by the retailerto recoup higher expenses incurred alongtheir own supply chains and/or to maintainbenchmark margins.20202021 Current TrendSources: USDA, National Agricultural Statistics Service; USAppleThis is not to say that retail prices for appleshave also been flat. The latest consumer priceindexes show that from June 2021 to June2022, the average price that urban consumerspaid for fresh apples in the U.S. increased by6%. Over the same period, food in generalincreased by 10.4% and fresh fruit increasedby 7.3%, so while consumers are seeing higherprices on the shelves, apples are still relativelycheaper than many substitutes.132019number of apple-bearing acres in the U.S. fellby around 17%. At the same time, productionincreased by more than 8%. Figure 2 chartsthe rise in U.S. apple yield as a calculation ofbushels produced per acre.While there may be some relatively low-costtechnologies and techniques to modestlyincrease yield, it is likely that most of thesegains are due to significant reinvestmentsto develop higher density orchards. Thefunds needed to make such improvementsare increasingly being provided by publiccompanies, pension funds and/or privateequity firms (rather than debt). As is alwaysthe case in challenging and uncertain times,the rate of consolidation and influx of outsidecapital is expected to continue and may evenaccelerate in the years to come.With increasing expenses and stagnantrevenues, the U.S. apple industry has hadto get more efficient. From 2007 to 2021, the13 U.S. Department of Labor, Bureau of Labor Statistics. Consumer Price Index: January 2020-June 2022.USApple Industry Outlook 2022 - Introductionusapple.org 11
Adding greatly to this uncertainty are concernsaround climate change and the extent towhich adverse weather events are increasingin frequency and magnitude. Based on datafrom USDA’s Risk Management Agency, theadministrator of the Federal crop insuranceprogram, the number of apple crop insuranceclaims has increased by 46% over the last 30years. Of course, during that time, the programhas expanded dramatically, improving accessand adding entirely new products. Giventhat the number of policies sold also grewsignificantly over the period ( 122% from 1992),the frequency of adverse events does notappear to a primary concern.However, from a magnitude perspective, whenadjusted for inflation, the average claim amountrose from around 37,500 in 1992 to around 119,000 in 2021 – a 218% increase.14 Whilethis does appear to be significant, additionalanalysis is required to disaggregate the dataaccording to cause of loss.14A major environmental issue leading up tothe 2021/22 CY had been the unprecedentedheat wave in the Pacific Northwest. Extremetemperatures in June 2021 likely led to asignificantly shorter crop in Washington andOregon and may have impacted the sizes andstorability of the remaining apples. Thoseheat-induced stresses could also negativelyimpact the 2022/23 CY yield as some industryexperts are expecting Washington productionto be down by 10%-15% year over year (versusUSDA’s forecasted 4% year-over-year decline).Up to this point, the discussion of U.S. applemarket conditions has primarily concernedfactors impacting the supply of apples, butthere are a number of demand-side factorsalso deserving consideration.Although considerable space has beendedicated to this topic in a later section of thisreport, the importance of export markets toU.S. apple growers cannot be understated. USDA, Risk Management Agency. Summary of Business: National Summary by Crop: 1989-2021.USApple Industry Outlook 2022 - Introductionusapple.org 12
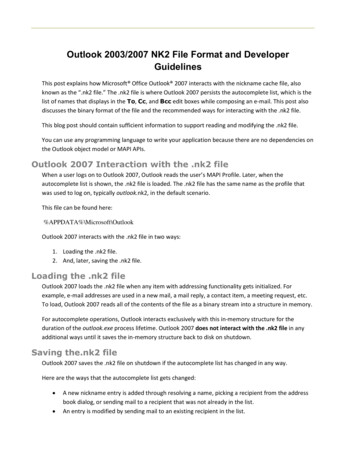
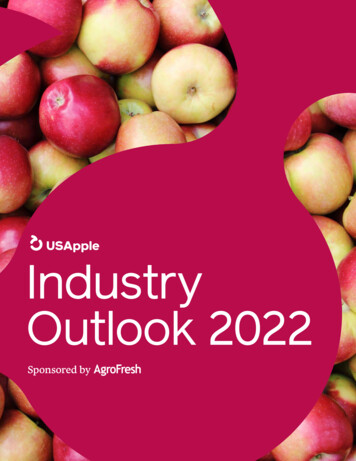
Trade disputes that negatively affect thosemarkets can have real and lasting damage tothe industry. Perhaps the most significant ofthese disputes occurred when, in response toU.S. tariffs on Indian steel and aluminum, Indiaplaced a retaliatory tariff on U.S. apples (amongother products). In 2018, India was the secondlargest export market valued at more than 157 million. By 2021, they were only the eighthlargest with total fresh apple exports valued at 22.5 million – a 135 million drop. From January2019 through June 2022, it is estimated that theloss of the Indian market has cost U.S. applegrowers more than 500 million.15To put that in context, from Q1 2018 to Q12021, total e-commerce sales grew from 112billion to 216.7 billion – an impressive, butsignificantly lower growth rate of 94%.Fortunately, despite inflationary pressures andthe disruptions brought on by COVID-19, the U.S.apple industry has not seen any considerabledecrease in domestic demand. In fact, thepandemic supercharged a trend that may havetaken years to evolve – online grocery shopping.While e-commerce sales have come downsomewhat from those highs, the share of totalfood and beverage sales has stayed above3% through Q1 2022. With this, it seems clearthat online grocery shopping is here to stay.What is less clear are the implications forthe apple industry in the long term. Somehave speculated that it will shrink store sizesand display space causing supermarketsto limit the varieties in store. On the otherhand, the endless aisle of the online grocercould accommodate any number of varietiesexposing adventurous consumers to applesnever before offered in store. The industry willhave to wait and see how these counteractingforces play out as the market evolves.In the first quarter of 2018, e-commerceaccounted for only 0.8% of food and beveragestore sales ( 1.4 billion). By the first quarter of2021, e-commerce had grown to account for3.8% of food and beverage store sales ( 7.8billion) – an increase of 445% (see Figure 3).From H-2A labor force issues to online groceryshopping, the trends and forces detailed aboveare helping to shape the U.S. apple industry inreal time. Users of this report should keep thesefactors in mind as they evaluate the production,utilization and trade data that follow.Figure 3: U.S. Food & Beverage Store E-Commerce Sales84.0%73.5%63.0%52.5%42.0%31.5%21.0%10.5% /BQ12018Q22018Q32018Q42018Q12019Q22019Sources: U.S. Census Bureau; 22021Q32021Q42021Q12022 F&B Store E-Commerce Sales E-Commerce Sales as a % of Total F&B Store Sales15 USDA, Foreign Agricultural Service. Global Agricultural Trade System: Apple Exports: January 2018-June 2022.USApple Industry Outlook 2022 - Introductionusapple.org 130.0%
U.S. Apple ProductionAccording to a USApple analysis of USDA data, total U.S. apple production for the 2022/23 CY willbe more than 10.7 billion pounds or 255 million bushels.16 This represents a 2.7% increase comparedto last year’s production figure and is 3.5% less than the five-year production average.255MILLION BUSHELSPRODUCED16 ach August, USDA releases an estimate of apple production by state for the coming crop year. In 2018, it limited the number of estimatesEto only the top seven apple producing states: California, Michigan, New York, Oregon, Pennsylvania, Virginia and Washington. This meansthat, from 2018 onward, USDA’s total national production figure only represents a sum of the seven states. Prior to 2018, USDA’s totalnational production figure included data for a far greater number of states – 20 in 2017. In an effort to maintain continuity of the dataset,USApple has estimated production for the “Other” states from 2018-2022 and added it back to USDA’s national production figures toarrive at a new, more comprehensive USApple production estimate.USApple Industry Outlook 2022 - U.S. Apple UtilizationProductionusapple.org 14
Figure 4: U.S. Apple Production: 1946-2022(F)325300275250225257.2 m bu255 m bu200175150125100755025Sources: USDA, National Agricultural Statistics Service; USAppleAs shown in Figure 4, U.S. apple productionhas been steadily growing over the last 75years. While there was a slowdown in the2000s following a boom in the 1990s, theindustry has recovered and is returning tothe long-term trendline.Going one step further, USApple has utilizedthis latest data point to develop an appleproduction forecast through 2026.17 Thatoutlook, as well as upper and lower “95%confidence intervals18”, is shown in Figure 5.Based on this analysis, USApple estimatesthat, independent of extraordinary positiveor negative events, production will continueits gradual upward trend increasing by7.6% by 2026. In terms of the confidence
0.21 per pound versus 0.12 per pound in 2017. Conversely, juice was considerably less expensive at 0.09 per pound - a 24% discount. Based on 2017 values, 2022/23 canned apples would account for the largest share of processors at 12% ( 150.9 million) followed by juice and cider apples at 10% ( 117.9 million) and fresh slices at