Transcription
Eindhoven University of TechnologyMASTERAggregate bottleneck capacity planning in the automotive industryBakens, S.Award date:2016Link to publicationDisclaimerThis document contains a student thesis (bachelor's or master's), as authored by a student at Eindhoven University of Technology. Studenttheses are made available in the TU/e repository upon obtaining the required degree. The grade received is not published on the documentas presented in the repository. The required complexity or quality of research of student theses may vary by program, and the requiredminimum study period may vary in duration.General rightsCopyright and moral rights for the publications made accessible in the public portal are retained by the authors and/or other copyright ownersand it is a condition of accessing publications that users recognise and abide by the legal requirements associated with these rights. Users may download and print one copy of any publication from the public portal for the purpose of private study or research. You may not further distribute the material or use it for any profit-making activity or commercial gain
Eindhoven, January 2016Aggregate BottleneckCapacity Planning in theAutomotive IndustrybyStan BakensStudent identity number: 0832820In partial fulfillment of the requirements for the degree ofMaster of ScienceIn Operations Management and LogisticsTU/e supervisors:Dr. Y. Ghiami,Dr. Ir. H.P.G. van Ooijen,TU/e, OPACTU/e, OPACCompany supervisors:Paul Hiel,Dirk Sneijkers,Inalfa Roof Systems, OperationsInalfa Roof Systems, Logistics
TU/e. School of Industrial EngineeringSeries Master Theses Operations Management and LogisticsSubject headings: Employee Planning, Production Planning; Master Planning, Automobile, MathematicalProgramming, Production Optimization.i
This one is dedicated to the one who has shown me how to ride a rocky roadii
AbstractIn the dynamic and competitive environment of the automotive industry, first-tier suppliers struggle todecrease costs, while improving delivery lead times and reliability and flexibility. In this research wepresent two aggregate production capacity planning models that optimize scheduling related productioncosts, for flow line assembly systems in the automotive sector; (1) the bottleneck capacity planningmodel (BCPM), and a simplified (2) IRS model. The BCPM is a mixed-integer non-linear programmingmodel that addresses production workforce capacity per working station in the production system, bymeans of a worker contribution function. Furthermore, the distinction between permanent andcontingent workers is made in the modeling. A relaxation of the BCPM is presented, which linearizes theproblem by replacing worker contribution functions with discretized capacity scenarios. The IRS model isincorporated in a planning tool that is used for (sensitivity) analyses in a case study, at a first-tierautomotive supplier. Results show that the master production scheduling can be improved, such thatsystem costs decrease by approximately 9.6%. Besides the optimization of the production schedule, bymeans of the planning model, the planning model itself can be improved by adaptation of inputparameters.iii
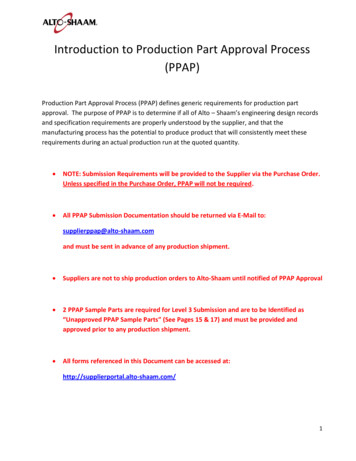
Management SummaryThis research focuses on the master production schedule (MPS) of the XC60-Kuga-Mondeo assembly lineof the IRS-Venray plant. The relation between customer forecasts, relevant production costs, and costsparameters related to production planning, are examined. The goal of this research is to investigate theproblems that are reported regarding the discrepancies between the customer forecasts and theproduction schedule, causing over-time work, idle time of workers, and emergency shipment costs. Theresearch provides a modeling approach that considers all relevant costs factors, while optimizing theproduction planning problem, and automates the execution of the planning. The emphasis of thisresearch is on the production process and finished goods; the supply side, of the internal processes, isout of the scope of this research.Problem DescriptionIRS updates its aggregate production plan, the MPS, once every week for each assembly line. Theplanning horizon of the MPS is 15 weeks, including the week at the time of re-scheduling. The MPS isbased on demand forecasts that are provided by the customer, the current inventory levels, and theavailable capacity, as is common for master production scheduling (Hopp & Spearman, 2000). Theavailable capacity, of the IRS assembly line, is adjustable in terms of number of shifts that are workedper week and the output per time unit can be adjusted. The production line contains multiple workingstations of which the output can be adjusted by altering the number of operators that are allocated tothat station, as is shown in Figure i. The different combinations of number of workers, allocated to theproduction line, and outputs are known as capacity scenarios. The possibility to adjust the number ofshifts that are worked per week is out of the scope of this research, since it is considered a long-termmanagement decision.Indirect LaborFrame StationAssembly lineAudit BoothEnd of LineFigure i: Assembly line configuration at IRSFurthermore, four main product variants are produced on the XC60-Kuga-Mondeo assembly line. Thedemand forecasts that are seen, for each product, fluctuate during the planning horizon, causinguncertainty that need to be coped with. Due to very high penalty costs, when causing a production stopat the customer, backorders are not allowed and are prevented at all endeavor. Hence, customer ordersmust be fulfilled. The workforce consists of a fixed pool of permanent employees and a pool ofcontingent workers that can be easily hired, from an external labor supply agency, or dismissed. Newemployees must be trained before becoming productive and being able to work autonomously. Thesecharacteristics resulted in the following research assignment:Develop a production control methodology for a single, multi-product flow line production system withdiscrete dynamically adjustable production capacity per working station, constrained by limitedproduction capacity, high backordering costs, and a demand fulfillment requirement.iv
Research ApproachThe research is conducted in three phases; the analysis phase, the method development phase, and thecase study phase. In the analysis phase the characteristics of the current production process and theplanning process are examined. Also, the demand is analyzed and the current performance is assessed.These measures serve as inputs for the modeling in the method development phase and serve asbaseline measure in the case study phase.The developed models in the second phase are designed to be applicable to production environmentssimilar to the IRS production environment, including IRS’s other assembly lines. Two models aredeveloped; the bottleneck capacity planning model (BCPM) and a simplified IRS model. The first is amixed-integer non-linear programming model, which optimizes production planning for a multi-productflow line with multiple production stations. This model explicitly allocates operators to a particularstation in order to calculate the best production schedule given demand and constraints. The constraintsin this model include a minimum and maximum number of workers per station. The model is allowed tohire or dismiss contingent workers and optimizes over labor- (wages and costs for hiring or dismissingcontingent workers) and inventory costs. Furthermore, backorders are included in the modeling and atraining period for new workers is included, in which the new operators are not productive. This modelimplicitly schedules an efficient allocation of workers over the production system and consequentlyexposes efficient capacity scenarios. The simplified IRS model, on the other hand, is based on theassumptions of the BCPM. This model uses capacity scenarios to calculate an optimal production plan,which are retrieved from the idea that each production station has its own output-per-workercontribution function. This function describes the behavior of a specific working station when adding aworker to that station. The possibility to schedule backorders is eliminated in the IRS model. The use ofcapacity scenarios enables the model to become linear, and thus more computationally efficient.In the case study phase the simplified IRS model is used to test whether the developed planning methodimproves the production planning performance of IRS. A testing period of 10 re-scheduling efforts overan 11-week period is used to compare the baseline measure with the case study results, retrieved fromthe simulations with the IRS planning model. Furthermore, a sensitivity analysis is performed to assessthe influence of the used parameters in the planning model and to increase the performance of themodel.ResultsThe results from the three research phases have shown that the demand IRS faces is very volatile.However, the change in average demand is almost negligible and changes in demand volume are moreoften delayed or expedited demand, than an absolute increase or decrease in demand over the longterm. The MPS of IRS shows to be less volatile (more stable), but the final planned production quantitiesfluctuate between weeks; indicating that the production schedule is not flat. Furthermore, demandshows to be normally distributed.When evaluating the baseline measure, it is shown that 8.80% of the total system costs are caused byemergency shipments and over-time working. This implies that emergency measures were taken toprevent orders to become overdue. This might indicate that safety stock levels could be reconsidered.Hence, two alternative approaches are proposed to calculate safety stock levels; approach 1 includesthe incorporation of demand volume uncertainty in the calculation of the safety stock, while approach 2extends that approach with the inclusion of demand lead time uncertainty. Both approaches are basedon the characteristics (mean and standard deviation) of the demand that is actually faced by IRS.Therefore, safety stock levels are better fit to the production environment of IRS and broadly applicable.v
Furthermore, cost parameters were estimated, which are the inputs of a planning methodology. Theseparameters are given in Table i. The estimated costs that are provided here help to understand thequantitative importance of the balance between workers and inventory.Table i: Costs parameters of IRS (December 2015)ParameterCostsSalarypermanentworker (per hour) 30.10Salarycontingentworker (per hour) 34.02Cost of Hiringa contingentworker 3,402Cost of dismissinga contingentworker 500Annualholding cost(%/ /Year)26.77%When comparing the performance of the developed production planning tool and the actualperformance of IRS, a cost reduction up to 9.6% can be achieved by implementing the methodology thatis proposed in this thesis. The planning model that is set according to the parameters, as presented inTable i, can be improved by adjusting the model such that the computational algorithm is used moreefficiently. The main results of the research are presented in Table ii.Table ii: Planning model performance resultsModelIRS performanceTrue IRS modelOptimal modelInventorycosts 26,926 43,808 21,836Laborcosts 754,656 738,326 703,024Acquisitioncosts 35,118 3,000 13,206Utilization95.16%95.14%92.88%Totalcosts 816,700 785,134 738,066Performanceincrease0.0%3.9%9.6%Conclusion and RecommendationsThe production planning of IRS can be improved in two areas; first, the production plan can be improvedby adopting the planning tool that is developed in this research. This could result in a cost saving of 371,724 annually, while fulfilling demand, and complying with all production requirements, set by IRSmanagement. On the other hand, the production planning process could be automated by implementingthe planning tool and scheduler’s time is saved. To fully benefit from the proposed model the followingmain recommendations could be followed: Train schedulers and other stakeholders of the production planning tool, such that they are ableto understand and work with the production planning (tool).Roll-out the planning tool to all production lines in a factory to fully benefit of its potential. Thiswould save time for the production planning department, since all MPS planning would beautomated. Also, production schedule quality is likely to be improved.Examine the re-planning frequency and planning horizon to improve the performance of theplanning tool. The planning tool estimates an optimal schedule for the planning horizon, but isnot able to incorporate re-scheduling efforts in its calculation.Update the parameters and inputs that are used by the planning tool on a regular basis.Elsewise, the tool might not provide reliable results (production schedules).Re-estimate the ratio between permanent and contingent workers for each production line tooptimize labor costs. The IRS model could be used to calculate this ratio.Extend the planning model (by future research), such that is able to: optimize the productionplan on factory level (multi-line), select the number of shifts that are worked per week, includethe short-term order scheduling (hierarchical production planning), etc.Integrate production planning in the Enterprise Resource Planning system.vi
PrefaceIt has been a hell of a ride. Writing these words means that I am finishing my OML master thesis andaccordingly finishing my time as student (at Eindhoven University of Technology). Graduating andobtaining my degree is the result of years of laughs, struggles, effort, and above all; a lot of goodmemories, of all the schools and universities that survived me. Now, the time has come to startpreparing for a working life, and probably to grow up a bit.I have enjoyed my time as student and especially the time during my master’s track Operations,Management and Logistics. During this study I have been accompanied with good friends and fellowstudents who have challenged me to get the best out of myself. I have often surprised myself, when Ifelt I was with my back against the wall. Sometimes projects or exam weeks seemed impossible to pass,but I have learned that there is always a solution to complete a challenge successfully.My master thesis research project was the greatest challenge of them all, but therefore the mosteducative. I learned a lot the past months; especially from the people who were closely watching meand my project. First of all, I want to thank Inalfa and my company supervisors Paul Hiel and DirkSneijkers for the opportunity they provided me. You have challenged and supported me during myresearch project and have also shown me what it is like to work as a professional in a commercialorganization in a dynamic industrial environment. Furthermore, I would like to thank all co-workers ofthe CFT Topslider, who have seen me do nothing throughout my research project. I really know the mostefficient way to get coffee now. Besides these colleagues I have had a lot of help of many people withinIRS, which really made the difference. Thanks, to all who have spent little and great effort for myresearch, because it was always valuable to me.Furthermore, I would like to thank Dr. Yousef Ghiami for his supervision during this research project.You have challenged me a lot, making me go lunatic at times. However, it always made me rethink myapproach, ever resulting in an improved version of the thesis I am presenting here. I especially enjoyedyour eye for detail and you have learned me a lot. Also my second supervisor, Dr. Henny van Ooijen,contributed greatly this thesis. Thank you for always asking the right, challenging questions, which putme often in the right direction.There have been a lot of people who have supported me throughout this project (and the last 25 yearsof my life). I want to thank my parents, Ben en Nelly, for always believing in me and supporting mewhenever I needed it. You have always enabled me to pursue my dreams and explore my talents.Furthermore, I need to thank my brother and sister who are always there, for their support and advice.Also, my friends deserve an acknowledgement. Without you guys, studying would not have been thissuccessful or fun. My special thanks go to Rogé who has been my partner in crime during OML and whohas found the time to give valuable feedback on my work. Lastly, I want to thank my girlfriend, Aniek,simply for being awesome.Thank you,Stan Bakens,Eindhoven,Januari, 2016vii
ContentsAbstract . iiiManagement Summary . ivProblem Description . ivResearch Approach . vResults . vConclusion and Recommendations . viPreface . vii1Company Description . 11.121.1.1Organizational Information . 21.1.2Production Process . 21.1.3Production Planning Process. 31.1.4Related Departments and Processes . 41.1.5Company Culture . 41.2Trends in Automotive Industry . 51.3Thesis Outline. 5Problem Description and Research Assignment . 72.1Problem Context . 72.2Problem Statement . 82.3Literature Review . 82.3.1Aggregate Capacity Planning . 82.3.2Planning Solution Methods . 102.3.3Gaps in Literature. 102.43Inalfa Roof Systems Group . 1Research Assignment and Methodology . 112.4.1Research Assignment . 112.4.2Research Questions. 122.4.3Research Scope . 13Detailed Analysis . 143.1Production System and Planning Characteristics . 143.1.1Production System . 143.1.2Production Planning Process. 19viii
453.2Demand Characteristics . 203.3System Performance . 21Method Development. 234.1Goals of the Modeling . 244.2Sets, Parameters and Variables . 254.3Bottleneck Capacity Planning Model . 254.4Simplified IRS Model . 27Case Study . 305.1Variables and Constraints . 305.1.1Demand . 305.1.2Production Capacity Scenarios. 315.1.3Initial System Status . 325.1.4Constraints . 325.1.5Summary of Input Parameters . 335.2Cost Parameters . 335.2.1Summary of Input Cost Parameters . 345.3Summary of Assumptions . 345.4Case Study Methodology . 345.5Results and Sensitivity Analysis. 355.5.1Reference Model. 355.5.2Influence of Inventory . 365.5.3Influence of Labor . 385.5.4Reference Model with Frozen Period Incorporated . 405.5.5Model with Optimal Settings Combined . 405.6Conclusion of Results . 416Implementation Plan . 437Conclusion, Discussion, and Recommendations . 457.1Conclusions from Analysis . 457.2Influence of Parameters. 467.3Practical Recommendations . 467.4Theoretical Contribution . 477.5Limitations and Future Research Directions . 48ix
List of Abbreviations . 49List of Figures . 50List of Tables . 51Bibliography . 53Appendix A.Organizational Information of IRS. 58Appendix B.Excel File Used for MPS Calculation . 59Appendix C.Classification of MPS Literature . 61Appendix D.Methodology . 63Appendix E.Demand Characteristics Analysis . 64Normality Test. 65Appendix F.System Performance Analysis . 68Redundant System Costs . 68System Costs . 68Schedule and Re-planning Stability. 69Appendix G.Demand Analysis Case Study . 71Appendix H.Capacity Scenarios . 73Appendix I.Calculation of Safety Stocks . 77Appendix J.Holding Cost Calculation . 79Appendix K.IRS Planning Tool . 80Appendix L.Estimation of Optimal Number of Permanent Employees . 82x
1 Company DescriptionIn the automotive industry the power enjoyed by big car manufactures plays an important role in thewhole supply chain settings and agreements. Using their power, these original equipmentmanufacturers (OEM) pressure their suppliers for lower prices, more flexibility in deliveries, higherreliability, and shorter lead times (Mansouri, Gallear, & Askariazad, 2012). The pressure OEMs put ontheir suppliers results in demand volatility at their suppliers, and thus throughout the whole supplychain (Chiang, 2011). In order to stay in business, suppliers in the automotive supply chain shouldcomply with the conditions set by the OEMs. Elsewise, the consequences could be high penalty costs orloss of market share to competitors. The main drivers of this trend of pressure and supply chainnervousness are the globalization of the industry and the increasing competitiveness in the industry, inthe past decades (Sturgeon, Memedovic, Van Biesebroeck, & Gereffi, 2009; Thun & Hoenig, 2012). Theincreasing competitiveness is mainly due to the financial crisis, started in 2007, and the battle for lowestpriced cars in each segment (Ernst & Young, 2013).These changes in the automotive industry resulted in very volatile demand volumes at the first tiersuppliers in the industry, causing great difficulties in production and capacity planning for the suppliers.Last-minute increases or decreases in demand are common challenges in the automotive industry andare faced throughout the supply chain (García-Sabater, Maheut, & García-Sabater, 2012; Heneric, Licht,& Sofka, 2006). Volatility in demand causes nervousness in production schedules, and thus difficulties inworkforce-, inventory-, and capacity planning. Inalfa Roof Systems Group B.V. (IRS) is one of those firsttier sup
planning horizon of the MPS is 15 weeks, including the week at the time of re-scheduling. The MPS is based on demand forecasts that are provided by the customer, the current inventory levels, and the available capacity, as is common for master produc