Transcription
Assessing the Magnitude and Costs ofIntraoperative Inefficiencies Attributable toSurgical Instrument TraysEmily Walker Stockert,MBA,Alexander Langerman,MD, FACSEfficiency in the operating room has become a topic of great interest. This study aimed toquantify the percent use of instruments among common instrument trays across 4 busy surgical services: Otolaryngology, Plastic Surgery, Bariatric Surgery, and Neurosurgery. Wefurther aimed to calculate the costs associated with tray and instrument sterilization, aswell as the implications of missing or damaged instruments.STUDY DESIGN: This was a single-site, observational study conducted on the surgical instrumentation at alarge academic medical center in Chicago. Data were collected through direct observation bya trained investigator. Operating room instrument use and labor time required for cleaningand repacking instrument trays in central sterile processing (CSP) were analyzed usingdescriptive statistics and linear regression. Institutional data on volume and expenses weregathered from hospital leadership.RESULTS:Forty-nine procedures and 237 individual trays were observed. Average instrument ( SD)userates were 13.0% for Otolaryngology ( 4.2%), 15.5% for Plastic Surgery ( 2.9%), 18.2%for Bariatric Surgery ( 5.0%), and 21.9% for Neurosurgery ( 1.7%). An increasing numberof instruments per tray was associated with decreased use and increased instrument error rate.Using recorded labor time, the cost of cleaning and repackaging an individual instrument wascalculated to be 0.10. Adding in CSP operating expenses and instrument depreciation peruse, total processing cost per instrument increases to 0.51 or more.CONCLUSIONS: Our study demonstrates that the percent use of instruments across surgical specialties andmultiple tray types is low. Attention to tray composition may result in immediate and significant cost savings. (J Am Coll Surg 2014;-:1e10. 2014 by the American College of Surgeons)BACKGROUND:have calculated the comprehensive costs of sterilizing andpackaging reusable instrumentation for each incrementaluse, with estimates ranging from V0.47 to V9.20(roughly 0.59 to 11.52 US) per instrument, dependingon instrument type.2-4 Furthermore, Leslie Kroes5 and colleagues, working in The Netherlands, found that reducingthe volume of excess instrumentation sent through sterilesupply processing could lead to savings between V55,000and V65,000 ( 68,843 to 81,360 US), and up toV125,000 ( 156,461 US) each year for a nonacademichospital with 13 operating rooms.5 Similarly, Farrokhiand associates,6 at Virginia Mason Medical Center, useddata from 2 neurosurgical procedures to estimate potential institutional savings up to 2.8 million a year througha 70% reduction in instrument processing through sterilesupply. Although these estimates are based on rough calculations, they lead us to believe that significant costcutting may be achieved by reducing the unnecessaryGiven the increasing scrutiny of health care expenditures,there is a growing body of literature assessing the efficiency of operating rooms and their impact on the delivery of patient care, physician satisfaction, and thehospital’s bottom line. Surgeons can and should be proactive in this effort by focusing on costs that are directlycontrollable and vary with volume of usage.1 The instrumentation used during a surgical procedure is one of theareas under surgeons’ purview where cost-benefit metricscan be easily assessed. Several studies conducted in EuropeDisclosure Information: Nothing to disclose.Received March 22, 2014; Revised June 18, 2014; Accepted June 19, 2014.From the University of Chicago Pritzker School of Medicine (Stockert), theDepartment of Surgery, Section of Otolaryngology-Head and Neck Surgery(Langerman), and the Operative Performance Research Institute (Stockert,Langerman), University of Chicago, Chicago, IL.Correspondence address: Alexander Langerman, MD, FACS, University ofChicago, 5841 S Maryland Ave, MC 1035, Chicago, IL 60637.ª 2014 by the American College of SurgeonsPublished by Elsevier 06.019ISSN 1072-7515/14
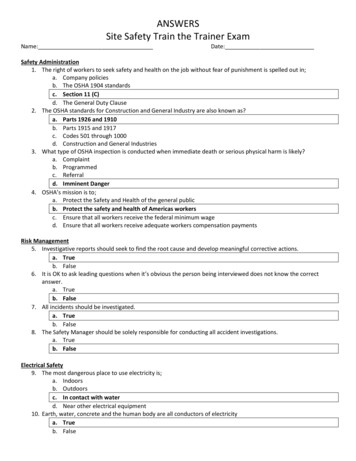
2Stockert and LangermanTable 1.Operating Room Details by SpecialtySpecialtyOtolaryngologyPlastic surgeryBariatric surgeryNeurosurgeryJ Am Coll SurgSurgical Instrument Use and CostsPercent of procedurePercent of procedureCirculatorPercent of procedure operative time circulatoroperative timeMeanretrievals per operative time circulator spent outside of OR for surgeon spent waitingProcedures procedure operative hour, n, spent outside of OR,instruments only,on instruments,observed, nlengthmean (SD)mean (SD)mean (SD)mean .46.1( 2.1)( 3.1)( 1.6)( 4.1)9.47.15.915.5( 7.2)( 7.1)( 4.4)( 10.6)2.50.51.00.5( 3.9)( 1.3)( 1.7)( 1.0)1.81.63.25.9( 5.3)( 3.5)( 7.4)( 12.2)Retrievals include any event in which the circulator left the operating room to obtain instruments or supplies needed for the case. Time surgeon spent waitingon instruments was defined by surgeon performing no other task during that time.Total procedures ¼ 49; total trays ¼ 237.OR, operating room.sterilization, wear and tear, and processing of instrumentsthat are opened and exposed in the operating room butnot actually used during a procedure.Moreover, Greenberg and coworkers7 showed that amore streamlined instrument tray with fewer instrumentscan be both cost-effective and safe for the patient, and Farrokhi and colleagues6 found that reducing the number ofinstruments in specific trays had no effect on surgical procedure times. In addition, Christian and colleagues8 notedthat excessive time spent counting instruments in theoperating room can significantly compromise case progression and patient safety by drawing attention away frompatient care activities. On the other hand, the inverse ofexcess instrumentation must be considered; an inadequatequality or quantity of instruments included in a tray cangreatly disrupt operating room flow, causing the surgeonto stand idle, with the patient under anesthesia, andrequiring the circulating nurse to leave the room to replacebroken or missing instruments. Recent studies have linkedoperating room traffic flow and the number of door openings during a procedure to higher airborne bacterial countsand the potential for increased postoperative infection.9,10The ramifications of inadequate supply of instrumentsmust be balanced against excess supply.Based on stakeholder interviews, we have strong anecdotal evidence that a significant proportion of instrumentsincluded in certain surgical trays at our institution areconsistently unused. The purpose of this study was toquantify the percent use of instruments among the mostcommonly used instrument trays in a sample of 4 busysurgical services at a university teaching hospital: Otolaryngology, Plastic Surgery, Bariatric Surgery, and Neurosurgery. We further aimed to calculate the costsassociated with tray and instrument sterilization processing by using direct evaluation of the instrument processing workflow. Lastly, we aimed to quantify the timewasted by the surgeon and the circulating nurse when instruments are missing, broken, or unexpectedly neededduring operative time.Our hypothesis was that a substantial percentage of instruments in each surgical tray opened would go unused,and that these unused instruments would cost a nontrivialamount to be cleaned and repackaged in on-site centralsterile processing (CSP). We further hypothesized thatduring each procedure, issues related to instruments andother supplies would result in unfavorable circulatorabsence from the operating room.METHODSStudy designThis was a single-site, observational study conducted onthe surgical instrumentation used at a large academicmedical center in Chicago. Surgical cases of Otolaryngology, Plastic Surgery, Bariatric Surgery, and Neurosurgery were identified through stakeholder interviews as thespecialties most pertinent to the goals of this study: highvolume instrument tray use, documented issues withinstrumentation, a stated need for improvement, and ahigh weekly case load (Table 1). Based on historical usagedata, the most frequently used surgical instrument trays ineach of these 4 specialties were identified. The data onoperating room instrument usage and operating roomflow related to instruments and supplies, as well as thesterile processing labor time required to clean and repackan instrument tray were collected through in-persondirect observation by a trained investigator using a calibrated stopwatch. Case cart assembly begins with a surgeon- and procedure-specific pick sheet 1 day before ascheduled procedure. The pick sheet details the instruments, trays, and supplies needed for the case. On theday of surgery, a case cart with sealed sterile instrumenttrays is sent to the operating room. Before the procedure,the scrub and circulator set up the operating room,breaking the sterile seal on all opened instruments trays.During the procedure, the circulator leaves the operatingroom to retrieve instruments and supplies not in availablein the room. At the end of the procedure, the scrub places
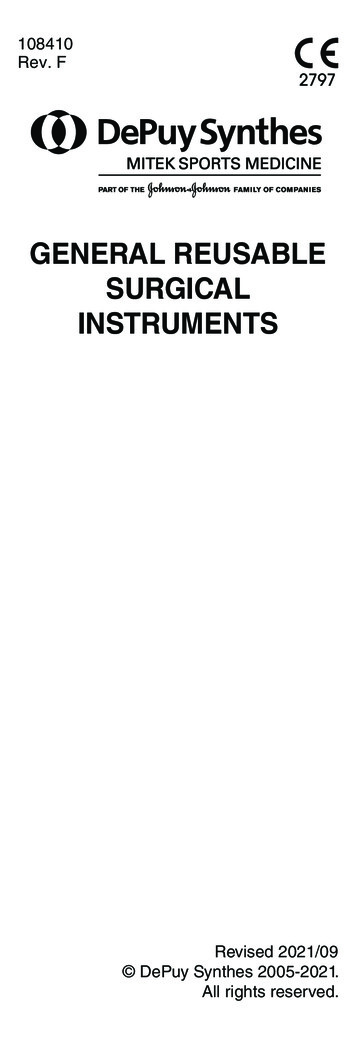
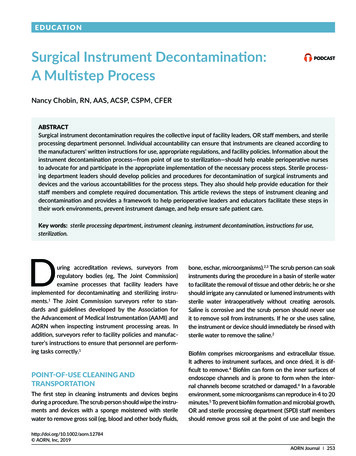
Vol.-,No.-, -2014Stockert and Langermanall instruments (used and unused) back into their respective trays, and the dirty case cart is sent to central sterileprocessing. Once in central sterile processing, dirty traysof instruments are first washed and soaked by hand.Next, trays are passed through a machine washer. Afterdrying, every instrument is removed from its tray,inspected, tested (replaced if needed), and repacked byhand. Newly packed instrument trays then undergo steamsterilization. Once steam sterilization is complete, instrument trays are ready to be placed on case carts (accordingto pick sheet), and the cycle repeats (Fig. 1).This research was approved by the University of Chicago Institutional Review Board (either expedited ornonhuman subjects determination depending on theportion of the study). All surgeons, nurses, operatingroom personnel, and central sterile processing staffinvolved in this study were educated on the data beingcollected and the purpose of the research.Surgical Instrument Use and Costs3Data collectioneoperating room instrument useSurgeons from the Otolaryngology, Plastic, Bariatric, andNeurological surgical services were contacted before thisstudy for willingness to have an observer in their operatingroom. Data were collected from routine (weekday, nonemergent) surgical procedures over a period of 8 weeksin June through August 2012. A goal was set to collectdata on 10 or more procedures in each of the target specialties. Data collection required that the investigator bepresent from anesthesia induction time until patientclose/instruments down, recording the following: numberand type of instruments used per tray opened; broken,missing, and unplanned instruments and trays; circulatingnurse instrument and supplies retrieval events and times;time spent on pre- and postoperative instrument counts;surgeon nonoperative time due to instrument retrieval;and procedure duration. A “used” instrument was definedas having touched a surgeon’s hand. “Procedure length”Figure 1. The instrument tray cycle: a long and complex process. Data collection was conducted on each of the areas in bold through inperson direct observation by a trained investigator using a calibrated stopwatch. CSP, central sterile processing.
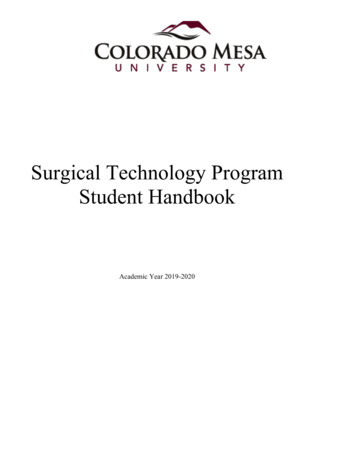
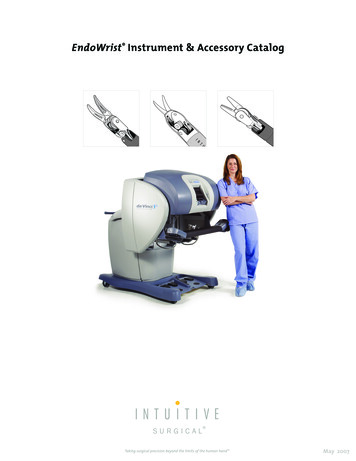
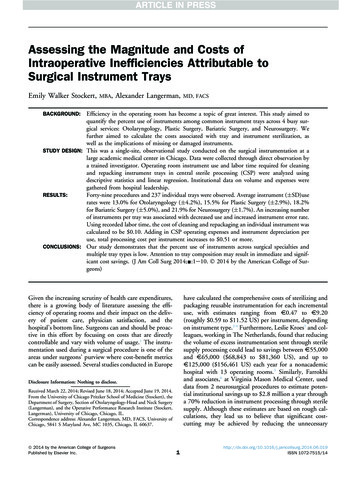
4Stockert and LangermanJ Am Coll SurgSurgical Instrument Use and CostsFigure 2. Total instrument use for all opened trays. Instrument use (vertical axis) is presentedby specialty (horizontal axis). OHN, otolaryngology; PLA, plastic surgery; BAR, bariatric surgery;NEU, neurosurgery.was defined by first cut to patient close/instruments down.All data collected were recorded via pen and paper, andtransferred to a database. Data entry was subjected tomultiple data quality checks and validation.Data collectionecentral sterile processingData on instrument trays processed through on-site CSPduring peak volume times on weekdays only werecollected over 2 weeks during the study period. Using acalibrated stopwatch, the investigator recorded thefollowing: person time needed to hand wash instrumenttrays in the decontamination area; person time neededto repack instrument trays before sterilization; and trayname. Total instrument counts per tray were providedby perioperative administration. Sterile processing technician hourly wage, along with CSP operational costs, weregathered from hospital leadership.Data analysisThe data were analyzed and summarized using descriptivestatistics and linear regression. To test our hypothesis thata substantial percentage of each surgical tray opened goesunused, we applied the equation:Current Tray A Utilization ¼ ICountUsedA ICountTotalAwhere the number of instruments included in tray A ¼ICountTotalA and the number of instruments from tray Athat were used in the procedure ¼ ICountUsedA. We plottedboth the time to hand wash a tray and the time to pack atray against the number of instruments per tray, and usedlinear regression to calculate the time required to decontaminate each incremental instrument, and the time required topack each incremental instrument before steam sterilization.To test our hypothesis that the unused instruments cost anontrivial amount to be cleaned and repacked in CSP, weused the equation:Cost of Cleaning and Re-packing Instrument I ¼ Ew Ict þ Iptwhere the average time in seconds to clean 1 instrument ¼ Ict,the average time in seconds to pack 1 instrument ¼ Ipt, andthe average CSP employee wage per second ¼ Ew. Theaverage CSP employee wage at the time of the study was 19.84 per hour, which translates to: 19:84 per hour O 60 minutes per hourO 60 seconds per minute¼ :006 per secondWe also collected institutional data on CSP monthlyvolume, expenditures on individual instruments, anditems such as detergents, biologic and quality checks,and maintenance and repair contracts to fully estimate instrument processing costs.RESULTSInstrument trays in the operating roomForty-nine procedures were observed in Otolaryngology(n ¼ 18), Plastic Surgery (n ¼ 12), Bariatric Surgery(n ¼ 13), and Neurosurgery (n ¼ 6). A total of 237 individual trays were observed across these specialties. The average
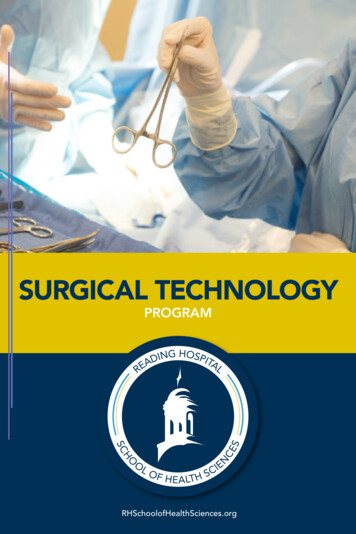
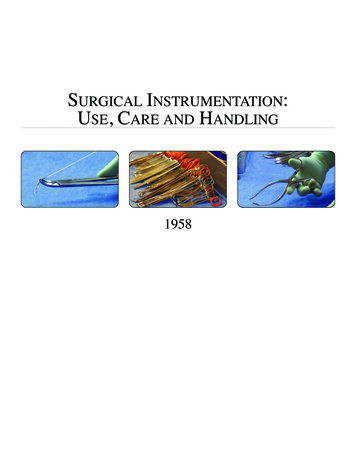
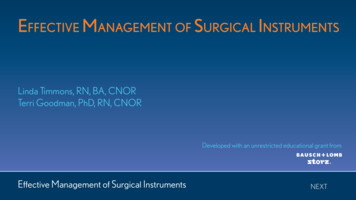
Vol.-,No.-, -2014Stockert and Langerman( SD) specialty-specific instrument use was 13.0% forOtolaryngology ( 4.2%), 15.5% for Plastic Surgery( 2.9%), 18.2% for Bariatric Surgery ( 5.0%), and21.9% for Neurosurgery ( 1.7%; Fig. 2). At the level ofthe individual instrument tray, we noted an inverse relationship between instrument use and number of instruments per tray (Fig. 3, Box A). Of the 237 trays opened,40 (17%) of these trays had 1 or 0 instruments used afteropening (Fig. 3, Box B). This happened most frequentlywith Otolaryngology trays (16 of 73 trays, 22%), andslightly less frequently with Plastic Surgery trays (10 of 58trays, 17%), Bariatric Surgery trays (10 of 76 trays, 13%),and Neurosurgery trays (4 of 30 trays, 13%) (Table 2).When comparing usage of specific instrument typesacross specialties, we found that among 3 similar traysin Otolaryngology, Plastic Surgery, and Neurosurgery,the average number of forceps, scissors, and suctionsused per tray was consistent, regardless of number available (Fig. 4). We also identified where excess instrumentation of a certain type may exist. For example, less than20% of all clamps provided in each of these trays are used.Lastly, of the 237 trays observed, 25 trays (10.5%) weredelivered to the operating room with instruments missingand recorded as missing, 1 tray (0.4%) was delivered tothe operating room with instruments missing and notrecorded as missing, and 14 trays (5.9%) were deliveredto the operating room with broken instruments. Instrumentation issues were observed to dramatically increaseby tray size, with an error rate of 49% for trays withgreater than 40 instruments, contrasted against an errorSurgical Instrument Use and Costs5rate of 13% for trays with 40 instruments or less. Duringthe 49 cases observed, a total of 18 trays were requested bythe surgeon to be sent up from central sterile processingduring active operating time. This occurred for variousreasons such as the need for an unplanned instrumentor to replace a broken or missing instrument. The averagetime from surgeon request to circulator phone call to CSPwas 42 seconds ( 1 minute, 42 seconds), and the averagetime from phone call to CSP to tray arrival was 6 minutes,30 seconds ( 6 minutes, 35 seconds).Operating room flowThe circulating nurse left the operating room, on average,between 3.4 times per hour (Bariatrics) and 6.1 times perhour (Neurosurgery) during the procedures observed(Table 1). As a percentage of procedure time, this translates to the circulating nurse being outside of the operating room from an average of 5.9% of operative time(Bariatrics), up to 15.5% of operative time (Neurosurgery). The majority of these retrievals were for essentialdisposable items not stored inside the operating room.The subset of time the circulator spent outside of theoperating room devoted specifically to instrumentretrieval ranged from an average of 0.5% of operativetime (Plastic Surgery and Neurosurgery) to 2.5% of operative time (Otolaryngology). Out of the 49 observed procedures, the surgeon was idle in nonoperative timeattributable to instrumentation in 14 (29%) of the cases.During these 14 procedures (Otolaryngology, 2; PlasticSurgery, 3; Bariatric Surgery, 6; Neurosurgery, 3), theFigure 3. Instrument use by tray size. Instrument use (vertical axis) is presented by number ofinstruments included in the tray (horizontal axis).
J Am Coll Surg6Stockert and LangermanTable 2.Frequency of Minimal Use of Instruments after Opening a TraySpecialtyOtolaryngologyPlastic surgeryBariatric surgeryNeurosurgeryTotalSurgical Instrument Use and CostsTrays with 0 instrumentsused (frequency), n (%)1561224Trays with only 1 instrumentused (frequency), n (%)(21)(10)(1)(7)(10)149216(1)(7)(12)(7)(7)Trays observed, nTotal frequency ofminimal use, %735876302372217131317Minimal use was defined as only 1 or 0 instruments used in a tray that was open, exposed, and made unsterileeexcluding trays with 5 or fewer instruments.Frequency indicates the percentage of total trays opened that are categorized as “minimal use.”Total procedures ¼ 49; total trays ¼ 237.OR, operating room.average surgeon idle waiting time was 8 minutes, 57 seconds, or 9.1% of total operative time (range 1 minute, 19seconds to 39 minutes; 0.4% to 30.6% total operativetime). None of the procedures observed met the criteriafor pre- and postoperative instrument counts at the timeof this study (no large open cavities, no blind cavities,and no risk for retained foreign body as defined by thedepartment or unit).Cost calculationsAt the time of this study, the average sterile processingemployee wage was 0.006 per second. Based on this,we calculated the labor cost of cleaning and repackagingan unused instrument to be 0.10 per instrument:Instrument trays in central sterile processingSixty-one trays were observed being decontaminated, and35 trays were observed being packed before steam sterilization in the on-site central sterile processing unit. A significant linear relationship was noted both for time todecontaminate vs number of instruments per tray, aswell as time to pack vs number of instruments per tray(Fig. 5). Using linear regression analysis, it was determined that an incremental instrument takes 4.02 secondsto decontaminate (R2 ¼ 0.68), and 12.51 seconds to packbefore sterilization (R2 ¼ 0.83).Ew ¼ 0:006 per s; Ict ¼ 4:02 s; Ipt ¼ 12:51 sCost of Cleaning and Repacking Instrument I ¼ Ew ðIct þIpt 0:10 per instrument ¼ 0:006 per second 16:53 secondsTo gain a more complete understanding of the processing costs per instrument beyond employee wages, weconsidered the utilities, maintenance, and repair costs ofoperating CSP. Our institution processes an average222,500 instruments per month for the main operatingrooms. If we assume CSP operates at 80% capacity, totalFigure 4. Use of specific instrument types included in 3 specialty trays. Use of instrumentsincluded in similar specialty trays (vertical axis) is presented by instrument type (horizontalaxis). OHN, otolaryngology; PLA, plastic surgery; BAR, bariatric surgery; NEU, neurosurgery.
Vol.-,No.-, -2014Stockert and LangermanSurgical Instrument Use and Costs7Figure 5. (A) Decontamination and (B) tray packing time by tray size. Time to decontaminateinstruments and time to pack instruments (vertical axis) is presented by the total number ofinstruments included in each tray (horizontal axis).capacity would be 278,125 instruments per month. Utilities expenses for detergents, biologic checks, and qualitychecks amount to 25,000 per month. Water and electricity are rolled up into central operating costs and arenot included in this amount. Annual repair expenses forthe previous year totaled 195,000, and maintenancecontracts amounted to 267,058. Combined repair andmaintenance average 38,505 per month. The perinstrument CSP operating costs of detergent, biologicand quality checks, maintenance, and repair calculates as:ð 25; 000 þ 38; 505Þ per monthO278; 125 total capacity instruments per month¼ ð 0:09 þ 0:14Þ ¼ 0:23 per instrumentThis is a conservative estimate of the true expense of processing 1 instrument because we were unable to includedepreciation of CSP washers and sterilizers, depreciationof the instrument tray container, and expense of maintaining CSP square footage and instrument storage space. Toestimate the per use depreciation costs of 0.02 to 0.18for an individual instrument, we identified 5 of the mostcommonly used instruments and obtained purchase priceand estimated lifespan data from our institution’s primaryvendor (Table 3). Instrument per use depreciation cost iscalculated by dividing the purchase price by the estimatedlifespan. Exposures in the setting of lifespan estimates areindependent of how the instrument was handled in theoperating room (used or unused) during the procedure.One “exposure” means the instrument was exposed inthe operating room, sent back down to CSP for cleaningand sterilization, and repackagedea process known tosubject the instruments to high heat and chemicals,and to cause baseline wear and tear, loss of integrity, andbreakdown of instrumentation. It was also noted by bothperioperative leadership and our instrument supplyrepresentatives that many instruments are actually “lost”before they wear outeloss of instruments may be a consequence of excess instrumentation and results in a shorterlifespan than our estimates (Table 3).If we include the instrument depreciation per use, CSPoperating costs of detergent, biologic and quality checks,and equipment maintenance and repair, we find the totalexpense of cleaning and repacking an unused instrumentincreases to 0.12 to 0.28 in direct costs, and up to 0.51 or more per instrument when considering the fullexpense of processing through CSP (Table 4).Qualitative observationsThere were other observed factors that we believe contributed to the inefficiencies and costs of surgical instrumentprocessing. Some delays in decontamination were causedby dried bio-burden that had to be scrubbed off (whichcan be mitigated by brief washing and spraying enzymaticdetergent in the operating room before sending trays fordecontamination). Delays in tray packing were derivedfrom instruments being placed in the wrong tray in theoperating room at the end of a procedure, requiring aTable 3. Per Use Depreciation Costs for 5 Commonly ssorsNeedle driverAveragePurchaseprice, Estimated lifespanin exposures, nPer usecost, .040.060.180.06The needle driver used in this example has a purchase price of 55, and a 20 replacement carbide insert is required every 160 uses, with a totalestimated life span of 640 uses (total price: 55 þ 20 þ 20 þ 20 ¼ 115). Other instruments are replaced in their entirety.
8Stockert and LangermanSurgical Instrument Use and CostsTable 4.Detailed Breakdown of Total Processing Cost per Individual InstrumentJ Am Coll SurgTotal processing cost, Direct (driven by excess instruments in trays)LaborDepreciationIndirect (driven by excess volume through CSP)UtilitiesRepairAdditional (unaccounted for during this study)QuantifiableUnquantifiableTime to clean (requires CSP employee to directly handleeach instrument; cleaning time affected by type ofinstrument)Time to pack (requires CSP employee to identify andhandle each instrument) [Figure 5]Varies by instrument type (delicate and preciseinstruments have shorter lifespans than bulkier, bluntinstruments) [Table 3]DetergentsBiologic checksQuality checks (ensuring that machines are functioningproperly and adequate sterilization occurs)Maintenance contracts for sterilization equipmentAdditional repair of equipment needed for categorizing,tracking, and packing instruments 0.10 0.02 to 0.18 0.09 0.14Water and electricity (rolled up into institutional centraloperating costs)Depreciation of durable equipment (washers, steamsterilizers, tray containers)CSP floor space and storage spaceLabor costs from time spent during OR procedure settingup complex trays, searching for instruments ondisorganized back table, and pre-/post-operativeinstrument countingReplacement costs for instruments lost or damaged inheavy disorganized traysBurden to employees lifting heavy traysOrganizational coordination for a larger volume ofinstrument inventoryDisruption of operating room flow and surgeon and stafffocusDirect costs are determined to be those driven by excess instrumentation included in each tray. Indirect costs are those driven by excess volume ofinstrumentation through central sterile processing.CSP, central sterile processing; OR, operating room.sterile processing employee to track down the right piecesfor each tray. Also adding time to tray packing were instruments such as suction tubes, which require morehands-on quality checks, and trays with many clampsthat all had to be individually opened before the decontamination wash cycle.DISCUSSIONTo our knowledge, this is the first study to examine surgical instrument tray use across multiple specialties. Theresults validate our hypothesis that a substantial percentage of each surgical tray opened goes unused. Thenumbers we found are notably lower than expected,with the highest observed use rate at 21.9% ( 1.7%)for Neurosurgery. The issue of low use is pervasive acrossall 4 specialties observed, and we speculate that this islikely similar for the majority of surgical procedures inthe study hospital’s operating rooms. Predictably, wefound that an inverse relationship exists between the number of instruments included in each tray, and the overallinstrument use for that tray. Additionally, the numberof errors per tray (missing or broken instruments) increases with the size of the tray. It is worthwhile toconsider the root cause of excess instrumentation: is it aconsequence of ineffectively predicting what will beneeded (either poor planning or holdover “legacy” traysthat have not been updated), or is there inherently sucha significant amount of variability between individualcases that the excess is warranted? We suspect it is theformer, and further research is imperative to better characterize this issue.
Vol.-,No.-, -2014Stockert and LangermanWe found that cleaning and repackaging an instrumentthat went unused in the operating room costs on average 0.10 per instrument by the most conservative estimates,and up to 0.51 or more per instrument using morecomprehensive cost metrics. This is compatible with findings of Farrokhi and colleagues,6 who roughly calculatedan estimated processing cost per instrument of 0.77 atVirginia Mason. We had intended to look at time spentby the scrub and circulator in pre- and postoperative instrument counting; however, the subset of cases weobserved was exempt from this practice at the time ofthis study. We imagine that instrument counting wouldlikewise reflect a linear time cost for excessive instrumentsand we intend to study this in future investigations. Additionally, each tray full of instruments must be set upbefore the start of every procedure, and one can imaginethat excess instrumentation lengthens this process as well.The savings in labor time spent cleaning and repackingexcess instrumentation could be realized immediately byremoving individual instruments from trays, and reductions in costs of operating CSP can be achieved overtime by decreasing the total volume of unnecessary processing. To put this in perspective, eliminating 80 unusedinstruments from 1 tray type that is opened 10 times aweek for 50 weeks could result in savings of:80 ½ 0:10 to 0:51 10 50¼ 4; 000 to 20; 400 per yearon just 1 tray type. This amount is indeed nontrivial, especially considering that our institution processes approximately100,000 trays and over 2.6 million instruments per year.We also validated our hypothesis that during each procedure, the circulator spends a considerable amount of totaloperating time outside of the operating room retrieving instruments and other supplies. This is particularly a problemwhen the circulator is out of the room and scrubbed staff oranesthesiology staff are required help with a nonsterile task.Our study numbers show that the circulator spends onaverage anywhere from 5.9% to 15.5% of operative timeoutside of the operating room. However, circulator retrievals due to instrumentation were only 1 componentof the out-of-room time, comprising an average of 2.5%(Otolaryngology) or less of total operative time. Rather,the primary reason for circulator exit was for disposablesupplies. Detailed assessment of the disposables neededand re
commonly used instrument trays in a sample of 4 busy surgical services at a university teaching hospital: Otolar-yngology, Plastic Surgery, Bariatric Surgery, and Neuro-surgery. We further aimed to calculate the costs associated with tray and instrument sterilization process-ing by using direct evaluatio