Transcription
NASA Goddard Institute for Space Studies (GISS)Climate Change Research Initiative (CCRI)Applied Research STEM Curriculum Unit PlanUnit Title: Future Temperature ProjectionsNASA STEM Educator / Associate Researcher: Nicole DulaneyNASA PI / Mentor: Dr. Allegra N. LeGrandeNASA GSFC Office of Education – Code 160NASA Goddard Institute for Space Studies Climate Change Research Initiative (CCRI)Matthew Pearce Education Program Specialist GSFC Office of Education 1601
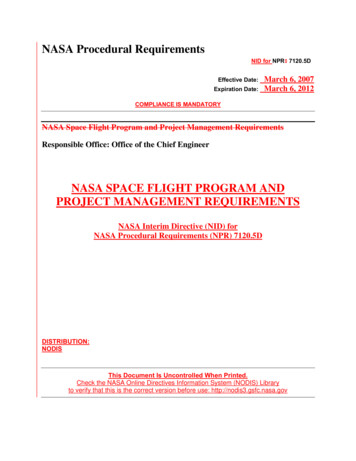
I. Executive SummaryThe title of this unit is Future Temperature Projections and will allow students to analyze and evaluatefuture temperature projections up to the year 2100 from the NASA Goddard Institute for Space StudiesGlobal Climate Model called GISS-ModelE2. The NASA GISS ModelE2 and other climate models simulatepresent day climate based on knowledge of how the heat and energy move around the earth andobservations of the radiative forcing of the entire system. Currently (as of 2011), the human-caused, oranthropogenic, radiative forcing of the climate system is 2.3 W/m2 (watts per meter-squared), withabout a third of that not yet realized as temperature change. To estimate future climate, the radiativeforcing for the future must first be estimated; this is accomplished through Representative ConcentrationPathways (RCP) scenarios. These RCP scenarios are future economic and development forecasts thatestimate global output of greenhouse gases. Each of the four RCP scenarios differ by the amount ofgreenhouse gas radiative forcing applied to the model simulation. In short, a positive greenhouse gasradiative forcing means greenhouse gases are causing Earth to receive more incoming solar radiation(insolation) than it is radiating back towards space. All RCP scenarios are based on positive greenhousegas radiative forcing values. In this unit, the students will be engaging with the RCP 2.6, RCP 4.5, and RCP8.5 scenarios, which correspond to greenhouse gas radiative forcings of 2.6 W/m 2, 4.5 W/m2, and 8.5W/m2, respectively.Climate scientists use RCP scenarios in their future climate change projection models because the futurestate of Earth’s climate system is dependent on the amount of greenhouse gas emissions. It is uncertainhow much the world can reduce greenhouse gas emissions and the different RCP scenarios account forthe possible pathways the Earth’s climate could develop through the year 2100. It is essential for thestudents to understand that changes to temperature patterns in the future can change if the futuregreenhouse gas emissions change. This unit allows the students to evaluate how the RCP 4.5 and RCP 8.5scenarios compare to the best-case scenario (smallest change from the historic period of the last 150years) of RCP 2.6 in terms of global temperature projections. As Earth’s climate continues to change, it isessential for people to understand how temperature is expected to change across the world and how thechanges are dependent on the amount of future greenhouse gas emissions. When people are able to seethe future impacts of climate change, they are more likely to take action and help reduce the amount ofgreenhouse gas emissions to keep future projections closer to the RCP 2.6 scenario.NASA Goddard Institute for Space Studies Climate Change Research Initiative (CCRI)Matthew Pearce Education Program Specialist GSFC Office of Education 1602
II. Introduction Goals and Overview of UnitThe title of this unit is Future Temperature Projections and will allow students to analyze and evaluatefuture temperature projections up to the year 2100 from the NASA Goddard Institute for Space StudiesGlobal Climate Model called GISS-ModelE2. This unit should be completed after students learn aboutfactors that influence climate, such as Earth’s energy budget and greenhouse gases emissions, and theimpacts of climate change. The NASA GISS ModelE2 and other climate models simulate present dayclimate based on knowledge of how the heat and energy move around the earth and observations of theradiative forcing of the entire system. To estimate future climate, the radiative forcing for the future mustfirst be estimated; this is accomplished through Representative Concentration Pathways (RCP) scenarios.These RCP scenarios are future economic and development forecasts that estimate global output ofgreenhouse gases. Each of the four RCP scenarios differ by the amount of greenhouse gas radiativeforcing applied to the model simulation. In short, a positive greenhouse gas radiative forcing meansgreenhouse gases are causing Earth to receive more incoming solar radiation (insolation) than it isradiating back towards space. All RCP scenarios are based on positive greenhouse gas radiative forcingvalues. In this unit, the students will be engaging with the RCP 2.6, RCP 4.5, and RCP 8.5 scenarios, whichcorrespond to greenhouse gas radiative forcings of 2.6 W/m 2, 4.5 W/m2, and 8.5 W/m2, respectively.The students will begin the unit in lesson #1 reading a science journal authored by NASA GISS scientistDr. Larissa Nazarenko and others titled “Future Climate Change Under RCP Emission Scenarios with GISSModelE2”. Students will be directed to section 3 of the article titled Representative ConcentrationPathway (RCP) Experiments. As the students read this section, they will complete a graphic organizer tolearn how the RCP scenarios and their respective greenhouse gas radiative forcings are used to simulatefuture climate change. In this same lesson, the students will learn how to effectively compare simulatedoutcomes from the RCP scenarios by analyzing difference, or anomaly, maps that result from subtractingthe output from two scenarios that are being compared. In this unit, all RCP scenarios are compared tothe baseline RCP 2.6 scenario. This part of the lesson is crucial for student understanding in lessons #2and #3 of the unit. Finally, at the end of lesson #1 the students will lead a whole class discussion aboutthe RCP scenario they believe will become our reality by the year 2100. This allows students to build onprior knowledge to make predictions about Earth’s future based on the current state of our climate andactions of our society.In lesson #2, the students will download the RCP 2.6, 4.5, and 8.5 temperature projection output from theNASA GISS ModelE2 and learn how to analyze the contents of the output in RStudio. Climate-related dataand model simulations are often stored in the data format called netCDF (files that end in .nc), and thelesson begins with a guide that teaches students how to work with netCDF data in RStudio. The guideshows students how to compare RCP scenarios by subtracting the output, resulting in RCP 8.5 – 2.6 andRCP 4.5 – 2.6 scenarios. The students will ultimately learn how to calculate monthly averages in threedifferent 30-year intervals from 2011 to 2100 for the RCP 8.5 – 2.6 and RCP 4.5 – 2.6 scenarios for NewYork City. The goal is for the students to learn how temperature projections are expected to change as weprogress into the future up to 2100.In order to successfully complete lesson #3, students need to apply the skills and content they acquired inlesson #2. In lesson #3, the students will be working in groups to evaluate monthly temperatureprojections for three different 30-year intervals for the RCP 8.5 – 2.6 and RCP 4.5 – 2.6 scenarios forNASA Goddard Institute for Space Studies Climate Change Research Initiative (CCRI)3Matthew Pearce Education Program Specialist GSFC Office of Education 160
another city around the world. Students will be assigned a city based on climate parameters such asproximity to the Intertropical Convergence Zone (ITCZ), proximity to a desert, influence of the IndianMonsoon, influence of the El Niño Southern Oscillation (ENSO), and influence of the North AtlanticOscillation (NAO). The students will prepare and present an oral presentation that teaches the classabout the climate of their city, and how climate change is expected to impact their city based on thetemperature projections from the NASA GISS ModelE2.There is highlighted text throughout the unit intended for specific reasons. The reasons are describedhere: Yellow means the text provides essential information for students or teachersBlue means the following text is for teachers onlyPurple means the text is related to Functions.R (this will be introduced in lesson #2)NASA Goddard Institute for Space Studies Climate Change Research Initiative (CCRI)Matthew Pearce Education Program Specialist GSFC Office of Education 1604
III. Educator BiographyNicole Dulaney – Earth Science & STEM Educatornmd46@cornell.eduNicole Dulaney has been a New York City Department of Education Earth Science teacher at Hillcrest HighSchool in Jamaica, Queens since September 2013. She was also a Math for America Early Career Fellowfrom 2016 to 2019. As of September 2019, Nicole will be teaching Earth Science in the Tuckahoe UnionFree School District (UFSD).Nicole’s interest in STEM education can be traced back to her childhood, when she would often track EastCoast Winter Storms. She is grateful to have a career in a field that merges her passion of STEM contentand education, and she looks forward to empowering the next generation of STEM leaders. Nicole earneda Bachelor of Science in Atmospheric Science cum laude from Cornell University and a Master of Arts inAdolescent Education from Hunter College.Over her career, Nicole has participated in two research programs for STEM educators. During thesummers of 2014 and 2015, she participated in the Columbia University Summer Research Program forScience Teachers. From 2015 to 2018, Nicole worked as an associate researcher with the NASA GISSClimate Change Research Initiative (CCRI). Through her research experience with CCRI, Nicole created aSTEM Earth Science research class at Hillcrest High School. The course began in September 2016 andintroduced students to Earth’s climate system. In this course, students learn about past, present andfuture climate change; the course heavily leverages on NASA resources. Students end the year engaging ina group-based research project about a topic related to climate change.Nicole looks forward to enhancing the STEM offerings and opportunities for students in the TuckahoeUFSD when she begins teaching at Tuckahoe Middle School in the fall 2019.NASA Goddard Institute for Space Studies Climate Change Research Initiative (CCRI)Matthew Pearce Education Program Specialist GSFC Office of Education 1605
IV. Table of ContentsClicking on each component of the Table of Contents will bring you directly to the location in the document.I. Executive Summary . 2II. Introduction Goals and Overview of Unit . 3III. Educator Biography . 5IV. Table of Contents . 6V. NASA Education Resources Utilized in Unit . 7VI. Unit Pre & Post Standards-Based Assessment . 9VII. Lesson #1: RCP Projection Scenarios .14VIII. Lesson #2: Using RStudio: Creating Temperature Projection Graphs For New York City .43IX. Lesson #3: Using RStudio: Creating Temperature Projection Graphs for Cities Around theWorld . 126X. References - APA . 139XI. Acknowledgements . 141NASA Goddard Institute for Space Studies Climate Change Research Initiative (CCRI)Matthew Pearce Education Program Specialist GSFC Office of Education 1606
V. NASA Education Resources Utilized in UnitA) Resources1. Future Climate Change Under RCP Emission Scenarios with GISS ModelE2 (Lesson #1)This NASA resource is a science journal article from 2015 by Dr. Larissa Nazarenko and other NASA GISSauthors such as Dr. Gavin Schmidt and Dr. Allegra LeGrande. The article discusses the future projectionsfrom the year 2006 to 2100 of the NASA GISS ModelE2 through the different RepresentativeConcentration Pathway (RCP) scenarios. The students will utilize section 3 of this resource to learn aboutthe different RCP scenarios that are based on different greenhouse gas radiative forcing values.This is the link to the Nazarenko et al., 2015 research paper2. GISS ModelE2 future climate change projection simulations (Lessons #2 and #3)This NASA resource allows students to download future temperature projection model output from theNASA GISS ModelE2 from the year 2006 to 2100. The exact link to the model output is provided ratherthan a descriptive link because the link needs to be copied and pasted into a browser to 5/global mon/BCSD/giss-e2-r/3. Forcings in the GISS Climate Model (Lesson #1)This NASA resource is in the For Further Exploration section in Lesson #1. The lesson is mainly based onforcings from carbon dioxide emissions and this resource allows students and teachers to expand theirknowledge on other forcings in the model. Link to information about forcings in the GISS climate model4. NASA Global Climate Change Website (Lessons #1 and #3)This NASA resource allows students to explore background content regarding evidence, causes, effects,and solutions to climate change. If students lack the prior knowledge needed for this unit, teachers canutilize this resource. Link to the NASA global climate change websiteB) Data Visualization and Analysis ActivityLesson #1 – The visualization activity in this lesson is based on the world maps students are asked toanalyze to learn how to properly compare model output from two different RCP scenarios. Students aregiven maps of temperature projections for December 2100 for all RCP scenarios and are asked questionsabout each map. Students are then asked to answer the same analysis questions using difference maps ofthe RCP 8.5 – 2.6, RCP 6.0 – 2.6, and RCP 4.5 – 2.6 scenarios. The goal is to show students that subtractingthe RCP projection output allows for an easier and more accurate analysis of the different RCP scenarios.Lesson #2 – The activity in this lesson is based on the students using the R programming language toread the contents of the netCDF model output from the NASA GISS ModelE2. Students will be learninghow to create average monthly temperature projection graphs for three different 30-year intervals from2011 to 2100 to show how temperature projections are expected to change for New York City.Lesson #3 – The activity in this lesson is based on the students using the skills they developed in Lesson#2 to create similar temperature projection graphs in RStudio for different cities around the world.NASA Goddard Institute for Space Studies Climate Change Research Initiative (CCRI)Matthew Pearce Education Program Specialist GSFC Office of Education 1607
C) NASA Mission AlignmentThis unit plan is entirely dependent on future simulated projections from the NASA GISS ModelE2through the Representative Concentration Pathway (RCP)scenarios. The NASA GISS ModelE2 wasdeveloped under the leadership of NASA GISS director Dr. Gavin Schmidt and has been used insimulations with the Coupled Model Intercomparison Project Phase 5 (CMIP5). The CMIP5 simulationsprovided the basis for the future climate estimations in the Intergovernmental Panel on Climate Change,Phase 5 (Taylor, Stouffer, & Meehl, 2012). The goal of analyzing the output from the GISS ModelE2 withthe RCP scenarios is to determine how future greenhouse gas emissions will influence the climatethrough the year 2100 and to understand the range of potential outcomes if current greenhouse gasemission rates are changed. There is a large amount of uncertainty surrounding how much the world canreduce future greenhouse gas emissions, and it is essential for global climate models such as the GISSModelE2 to account for different emission scenarios when making future projections.D) NASA 2018 Strategic Objectives AlignmentThis unit plan relates directly to the NASA 2018 Strategic Goal #1 – Expand Human KnowledgeThrough New Scientific Discoveries. NASA’s missions allow for the public to view and analyze data suchas model output from the GISS ModelE2. In each lesson, students are directly engaging with futureclimate projection simulations from the model to evaluate how temperature projections are expected tochange overtime. With this model output, the unit also allows students to expand their knowledge of howtemperature projections are dependent on different greenhouse gas emission scenarios and how climatechange will impact multiple regions of the world in different ways. Under Strategic Goal #1, this lessonalso aligns well with Strategic Objective 1.1 – Understand the Sun, Earth, Solar System, and Universe.Throughout the unit, the students are learning more about Earth’s climate system and future climatechange projections through analysis of output from the GISS ModelE2. Students are also able to use theoutput to help improve life on Earth by learning how projections can be impacted by greenhouse gasemissions and which regions of the world are most vulnerable to changes in temperature. Finally, thisunit is also aligned to Strategic Objective 3.3 – Inspire and Educate the Public in Aeronautics, Space, andScience, as the nature of this unit is to educate society about climate change.E) NASA Office of STEM Engagement Objectives AlignmentThis unit plan is also aligned with the NASA Office of STEM Engagement objectives, specifically, 1.1 – Students contribute to NASA’s endeavors in exploration and discovery. 2.1 – Students, including those from underrepresented and underserved communities, exploreand pursue STEM pathways through authentic learning experiences and research opportunitieswith NASA's people and work.Throughout the unit, students are exploring the contents of simulated model output from the NASA GISSModelE2, allowing students the opportunity to engage in a NASA endeavor with regard to future climatechange projections. Through all lessons, students have the opportunity to pursue STEM pathways byconducting data analysis similar to the analyses performed daily by NASA researchers.NASA Goddard Institute for Space Studies Climate Change Research Initiative (CCRI)Matthew Pearce Education Program Specialist GSFC Office of Education 1608
VI. Unit Pre & Post Standards-Based AssessmentPre & Post-Unit Assessment: Earth’s Energy BudgetIn order to truly measure student growth after the completion of the unit, the pre-assessment will be the sameas the post-assessment.The pre and post-unit assessment is based on New York State Earth Science Regents questions andstandards. Since students in New York State taking part in these lessons are also likely taking Regents EarthScience, students need to be familiar with answering Regents-style questions. The following New York StateEarth Science standards are assessed:2.2a - Insolation (incoming solar radiation) heats Earth's surface and atmosphere unequally due to variationsin: the intensity caused by differences in atmospheric transparency and angle of incidence which vary withtime of day, latitude, and season characteristics of the materials absorbing the energy such as color, texture, transparency, state ofmatter, and specific heat duration, which varies with seasons and latitude.6.1 - Identifying patterns of change is necessary for making predictions about future behavior and conditions.1. Most scientists infer that a major factor in the increased rate of melting of Earth’s glaciers is(1)(2)(3)(4)a decrease in the output of energy from the Suna decrease in Earth’s atmospheric transparencyan increase in Earth’s orbital distance from the Sunan increase in carbon dioxide in Earth’s atmosphere2. Which list contains three major greenhouse gases found in Earth’s atmosphere?(1)(2)(3)(4)carbon dioxide, methane, and water vaporcarbon dioxide, oxygen, and nitrogenhydrogen, oxygen, and methanehydrogen, water vapor, and nitrogen3. Most scientists infer that increasing levels of carbon dioxide in Earth’s atmosphere are contributingto(1)(2)(3)(4)decreased thickness of the tropospheredepletion of ozoneincreased absorption of ultraviolet radiationincreased global temperaturesNASA Goddard Institute for Space Studies Climate Change Research Initiative (CCRI)Matthew Pearce Education Program Specialist GSFC Office of Education 1609
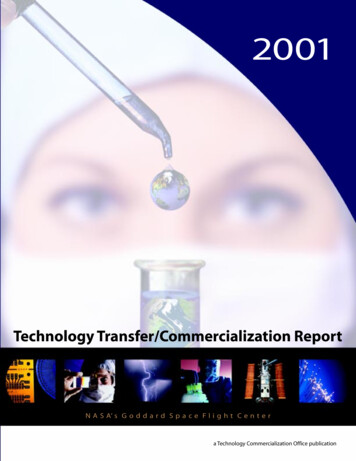
4. Which event is inferred by most scientists to be responsible for a climate change that has recentlyled to a decrease in the size of most glaciers?(1)(2)(3)(4)a decrease in the rate of divergence of lithospheric plates along a mid-ocean ridgea decrease in the amount of insolation reaching Earth’s surfacean increase in the amount of greenhouse gases in Earth’s atmospherean increase in the amount of vegetative cover in the tropics5. The graph below shows changes in carbon dioxide concentrations in Earth’s atmosphere over a 140year period. Carbon dioxide concentrations are shown in parts per million (ppm).This significant change in CO2 concentration is most likely caused by(1)(2)(3)(4)decreased cloud cover, and is predicted to decrease average global temperaturesdecreased volcanic activity, and is predicted to increase average global temperaturesincreased use of fossil fuels, and is predicted to increase average global temperaturesincreased El Niño activity, and is predicted to decrease average global temperatures6. The process of developing and implementing environmental conservation programs is mostdependent on(1)(2)(3)(4)the availability of the most advanced technologythe Earth’s ability to restore itselfpublic awareness and cooperationstricter environmental lawsNASA Goddard Institute for Space Studies Climate Change Research Initiative (CCRI)Matthew Pearce Education Program Specialist GSFC Office of Education 16010
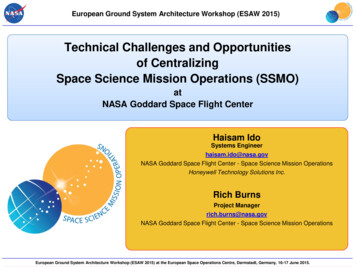
Use the graphs below to answer questions 7 - 10. Graph I shows the average temperature change on Earthbetween the years 1870 and 1955. Graph II shows the amount of carbon dioxide in the atmosphere betweenthe years 1870 and 1962.7. What was the approximate overall change in the carbon dioxide content between 1900 and 1962?(1)(2)(3)(4)330 parts per million290 parts per million40 parts per million0.4 parts per million8. If the trend shown in graph II continued into 1980, the amount of carbon dioxide in the atmospherein 1980 was probably(1)(2)(3)(4)less than 30 parts per millionbetween 100 and 280 parts per millionbetween 300 and 320 parts per milliongreater than 340 parts per million9. Which statement best accounts for the relationship between the carbon dioxide and temperaturechange data shown by the graphs?(1)(2)(3)(4)Carbon dioxide is a good absorber of infrared radiation.Carbon dioxide is a poor absorber of infrared radiation.Temperature decreases usually occur when the carbon dioxide content of the atmosphere increases.Temperature changes do not usually occur when the carbon dioxide content of the atmosphereincreases.NASA Goddard Institute for Space Studies Climate Change Research Initiative (CCRI)Matthew Pearce Education Program Specialist GSFC Office of Education 16011
10. Which is the best interpretation that can be made from the graphs for the period between 1870and 1955?(1) The amount of carbon dioxide in the atmosphere has increased steadily, and the temperature changeon Earth has shown an overall increase.(2) The amount of carbon dioxide in the atmosphere and the temperature change on Earth have increasedat a steady rate.(3) The amount of carbon dioxide in the atmosphere has decreased steadily, and the temperature changeon Earth has shown an overall decrease.(4) The amount of carbon dioxide in the atmosphere has decreased at a steady rate, causing a varyingchange in temperature on Earth.NASA Goddard Institute for Space Studies Climate Change Research Initiative (CCRI)Matthew Pearce Education Program Specialist GSFC Office of Education 16012
NASA Goddard Institute for Space Studies (GISS)Climate Change Research Initiative (CCRI)Applied Research STEM Curriculum Unit PortfolioUnit Title: Future Temperature ProjectionsLesson #1 Title: RCP Projection ScenariosNASA STEM Educator / Associate Researcher: Nicole DulaneyNASA PI / Mentor: Dr. Allegra N. LeGrandeNASA GSFC Office of Education – Code 160NASA Goddard Institute for Space Studies Climate Change Research Initiative (CCRI)Matthew Pearce Education Program Specialist GSFC Office of Education 16013
VII. Lesson #1: RCP Projection ScenariosA. Summary and Goals of LessonThe goal of this lesson is for the students to learn how global climate models such as the NASA GISSModelE2 use Representative Concentration Pathway (RCP) scenarios to predict future climate patterns,such as temperature and precipitation projections, which are based on greenhouse gasradiative forcings. A radiative forcing is defined as the difference between incoming solar radiation(insolation) absorbed by the Earth and energy sent back towards space. The students will learn aboutgreenhouse gas radiative forcings and the RCP scenarios when they read a section of a paper by Dr.Larissa Nazarenko and other GISS authors titled Future Climate Change Under RCP Emission Scenarioswith GISS ModelE2. As the students read section 3 of the paper titled Representative ConcentrationPathway (RCP) Experiments, they will complete a graphic organizer to learn about the RCP 2.6, 4.5, 6.0,and 8.5 scenarios. These scenarios are based on the different greenhouse gas radiative forcings Earthcould experience in the future. The higher RCP scenario predicts greater greenhouse gas emissions in thefuture, which leads to a greater radiative forcing since more outgoing longwave radiation will beabsorbed in the atmosphere.After the students learn about the RCP scenarios, the students will learn how to effectively compare RCPprojection model output. The students will first be provided with maps that show temperature projectionsimulations for December 2100 for the RCP 2.6, 4.5, 6.0, and 8.5 scenarios. Students will be asked a seriesof questions about the locations that are expected to experience the greatest temperature out of allscenarios. The students will then be given difference maps that show the December 2100 temperatureprojections for the RCP 8.5 – 2.6, RCP 6.0 – 2.6, and RCP 4.5 – 2.6 scenarios. The RCP 2.6 scenario is usedas a comparative baseline to the other RCP scenarios. The students will then be asked the same series ofquestions as the ones for the RCP 2.6, 4.5, 6.0, and 8.5 scenarios. This will allow the students to see thatanalyzing the difference between model output is more effective for comparing different RCP scenarios.Finally, the lesson ends with the students leading a whole class discussion about the RCP scenario theybelieve will become our reality by the year 2100. This allows students to build on prior knowledge tomake predictions about Earth’s future based on the current state of our climate and actions of oursociety.B. Table of Contents for lessonA. Summary and Goals of Lesson . 14B. Table of Contents for lesson . 14C. 5 E Lesson Model Template . 15D. Supporting Documents (order according to sequence of lesson) . 22E. Conclusion and overview of linkages to next lesson and unit goals. 41NASA Goddard Institute for Space Studies Climate Change Research Initiative (CCRI)Matthew Pearce Education Program Specialist GSFC Office of Education 16014
C. 5 E Lesson Model TemplateSTEM Earth Science ResearchUnit: Future Temperature ProjectionsTopic: RCP Projection ScenariosPrior Learning: For successful completion of this lesson, the students should have knowledge of howincreasing or decreasing greenhouse gases plays a role in impacting Earth’s climate. Students should know thatgreenhouse gases trap outgoing longwave radiation (infrared energy) and can influence temperature at Earth’ssurface. The students should also have knowledge of Earth’s energy budget and how the relationship betweenincoming and outgoing energy can influence Earth’s average temperature. If students need more informationabout the role greenhouse gases have in climate change, please visit this link to NASA resource about thecauses of climate change. This resource will also remind students about the evidence of climate change and theimpacts.In this lesson, the students will learn about the R
V. NASA Education Resources Utilized in Unit A) Resources 1. Future Climate Change Under RCP Emission Scenarios with GISS ModelE2 (Lesson #1) This NASA resource is a science journal article from 2015 by Dr. Larissa Nazarenko and other NASA GISS authors such as Dr. Gavin Schmidt and Dr. Allegra LeGrande. The article discusses the future projections