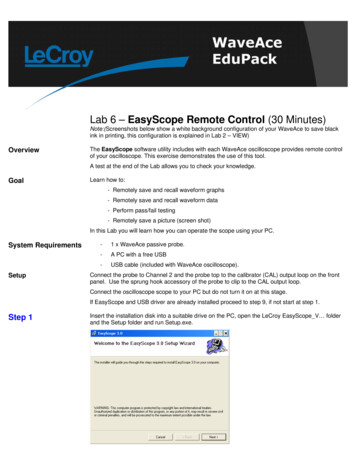
Transcription
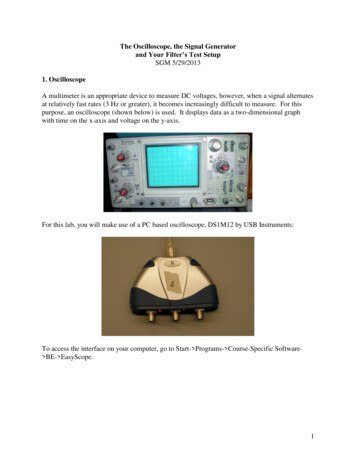
The Oscilloscope, the Signal Generatorand Your Filter’s Test SetupSGM 5/29/20131. OscilloscopeA multimeter is an appropriate device to measure DC voltages, however, when a signal alternatesat relatively fast rates (3 Hz or greater), it becomes increasingly difficult to measure. For thispurpose, an oscilloscope (shown below) is used. It displays data as a two-dimensional graphwith time on the x-axis and voltage on the y-axis.For this lab, you will make use of a PC based oscilloscope, DS1M12 by USB Instruments:To access the interface on your computer, go to Start- Programs- Course-Specific Software BE- EasyScope.1
A screen shot is given below. The display shows a sine wave across a graph made up of 10x8squares.This scope’s time base (in the figure’s top right) is set to 20ms per division, referring to thedenomination of each square across the x-axis. Adjusting this dial will modify the time base forboth Channels A and B. Thus, if it was adjusted to 10ms/div, half as many cycles of the sinewave will be seen. This information can be seen on the bottom right of the display.The magnitude of the signal is seen across the y-axis. The units can be seen with the volts/divdial. In this case, each square represents 1V. This information can be seen on the bottom rightof the display. The ‘zero’ point of the signal is seen by the arrow to the left of the display. Toalternate between Channels A and B, select the respective tabs on the bottom right of the screen.By selecting the various cursor buttons on the bottom of the screen, the amplitudes and timeperiods can be measured accurately. Also, there are virtual Meters A and B that can be used toeasily measure frequency and voltages. Generally, you will want to measure peak-to-peakvoltage (Vpp) and frequency. When using the meters, make sure that at least one full period of thesignal of interest is visible on the screen; otherwise the meter may not give the correct reading.2
2. The Signal GeneratorIn this experiment, you use a Signal Generator (alternatively known as a Function Generator) inorder to create oscillating signals. Most Signal generators produce Sine, Square Triangle andSawtooth waves:For this experiment, you will use a Virtual Signal Generator. To access it, open the EasyScopeprogram, and press the ‘Signal,’ button at the bottom. The Signal Generator window will open:3
Using this window, you can select the type of waveform to generate, which in the above case is asine wave. Set the Peak to Peak voltage (Vpp) and the frequency (using the ‘Samples’ drop downmenu, you can change the ranges of possible frequencies). When you select apply, this waveformwill be created out of the third terminal of the DSM12 device on your bench top (The ‘OUT’button must be selected on the Virtual Oscilloscope). Although you can set the frequency on thefunction generator, measure it on the oscilloscope to get the actual value.3. Setting up the test station1. Equipment needed:a. BNC Cableb. T-Connectorc. BNC-to-Alligator Clip Cables4
d. Two Power Supplies With Banana Cables2. Connect the BNC cable from the Signal Generator output to Channel A of theoscilloscope. You should have a cable connected from the first terminal to the thirdterminal.a. Turn on the EasyScope program. Set the signal generator to produce a sine wave offrequency 1kHz, and a voltage of about 2Vpp (voltage from peak to peak).b. Now look at the signal on the oscilloscope. Make adjustments to your scope so thatyou can see the signal.c. Try out different frequency and voltage combinations.3. Prepare the power supplies to power your filters – Your chip needs a positive and anegative 12V voltage, as well as a ‘ground’ or ‘common.’ In order to do attain this, set theoutput dial to 12V and connect the power supplies in series as shown, using the bananacables:Here, you have a black cable connecting the positive terminal of the left supply to thenegative of the second. Now, between the negative terminal of the left supply (yellowbanana cable) and the positive terminal of the right supply (red banana cable), there willbe 24V, and the terminals connected to the black banana cable will be common/ground.Voltage from the yellow to black cable, will measure -12V, and from the red to blackcable, 12V. A diagrammatic representation is given below:5
4. Construct the filter on your breadboard. Remember to power the chip.Remove the BNC cable from the Signal Generator output and replace it with a ‘T’connector. From one end of the ‘T,’ connect a BNC cable to Channel A of theoscilloscope. From the other end, connect the BNC to alligator clip cable to go out to thecircuit. This will be your Vin. Connect this to the input of your circuit. Remember thatthe black lead of the BNC to alligator clip cable is for common/ground (which isconnected to the power supply). Connect a BNC to alligator clip cable from Channel B tothe output of your circuit, with the black lead connected to common/ground as well. The‘T’ connector will allow the input of the Virtual Signal Generator to be monitored byChannel A of the Virtual Oscilloscope. Channel B of the Virtual Oscilloscope willmonitor the output of your filter, Vout. Your setup will look like this:The set-up is designed to simulate the following test station:6
To access the interface on your computer, go to Start- Programs- Course-Specific Software- BE- EasyScope. 2 A screen shot is given below. The display shows a sine wave across a graph made up of 10x8 squares. This scope's time base (in the figure's top right) is set to 20ms per division, referring to the