Transcription
Simultaneous Fingerprinting and Mapping forMultimodal Image and WiFi Indoor PositioningPlamen Levchev, Michael N. Krishnan, Chaoran Yu, and Avideh ZakhorDepartment of EECS, U.C. BerkeleyAbstract—In this paper, we propose an end-to-end system whichcan be used to simultaneously generate (a) 3D models andassociated 2D floor plans and (b) multiple sensor e.g. WiFiand imagery signature databases for the large scale indoorenvironments in a fast, automated, scalable way. We demonstrateways of recovering the position of a user carrying a mobiledevice equipped with a camera and WiFi sensor in an indoorenvironment. The acquisition system consists of a man portablebackpack of sensors carried by an operator inside buildingswalking at normal speeds. The sensor suite consists of laserscanners, cameras and an IMU. Particle filtering algorithms areused to recover 2D and 3D path of the operator, a 3D point cloud,the 2D floor plan, and 3D models of the environment. The samewalkthrough that produces 2D maps also generates multi-modalsensor databases, in our case WiFi and imagery. The resultingWiFi database is generated much more rapidly than existingsystems due to continuous, rather than stop-and-go or crowdsourced WiFi signature acquisition. We also use particle filteringalgorithms in an Android application to combine inertial sensorson the mobile device, with 2D maps and WiFi and image sensordatabases to localize the user. Experimental for the second floorof the electrical engineering building at UC Berkeley campusshow that our system achieves an average localization error ofunder 2m.I. I NTRODUCTION AND R ELATED W ORKIn recent years, indoor localization has received a great dealof attention among researchers. On one hand, it has a numberof important applications such as location-aware intelligentshopping assistant and indoor real-time navigation. On theother hand, it is a technically challenging problem due to thefact that most buildings virtually block GPS signals. Hencealternate localization approaches are needed for the indoorenvironment.The prevalence of WiFi infrastructure inside most buildingsprovides a natural starting point for this problem. A wellknown approach is to construct a database of WiFi ReceivedSignal Strength Indicator (RSSI) fingerprints for the building.The RSSI fingerprint for each location is a vector of decibelvalues where each entry corresponds to the WiFi signalstrength of a particular access point detected at that location.As the client-side application queries the database with anRSSI measurement, algorithms such as Redpin [2] or variantsof k NN [9, 22] are used to retrieve the location whosefingerprint is closest to the querying fingerprint. A major advantage of this method is its cost-effectiveness, since hardwareinfrastructure is already in place in most indoor commercialand residential buildings. Furthermore, practically all mobilephones and consumer electronic devices have WiFi scanningcapability. One disadvantage of this approach is that thefingerprinting process is slow and cumbersome and requiresa map. Another disadvantage is that the location dependencyof RSSI is not reliable and is subject to interference. Eventhough room-level accuracy e.g. approximately 5 to 10m hasbeen demonstrated, the method does not achieve meter or submeter level accuracy [12].Another approach that could be used for localization is inertialdead reckoning using a smartphone’s on-board accelerometer,gyroscope and magnetometer. Nowadays consumer electronicdevices are equipped with increasingly more accurate sensorsthat are capable of sampling at fast data rates. Utilizing thesesensors, users’ speed and orientation of movement can beestimated and their path can therefore be tracked in realtime. Magnetometer can be used to get users’ orientation,but it suffers from interference from various indoor magneticanomalies such as steel cabinets. Integrating raw accelerometerand gyroscope readings provides displacement information butintegration introduces significant drift error [25]. To estimateusers’ movement, a commonly adopted method is to firstdetect their steps, and then estimate the corresponding steplengths [8, 10, 21]. The inertial sensor-based approach isdifferent from the WiFi-based one in that it only estimatesrelative change in position, whereas WiFi measurements provide position estimates in the global coordinate frame. Inan attempt to combine strengths of above two approachesand combat their respective weaknesses, it is possible to usea probabilistic technique, e.g. particle filtering, to derive anintegrated location estimate [13].Recently an image-based indoor localization scheme [7, 14,15] has been proposed for mobile devices with cameras.Firstly, a database of images is constructed via a man portableambulatory backpack of sensors, and then images taken bythe client mobile device are used to retrieve those imageswith most number of matching features in the database. TheShift Invariant Feature Transform (SIFT) [18] finds distinctfeatures contained in images that are invariant to uniformscaling and partially to affine distortion. Even though thismethod generally achieves higher accuracy than WiFi RSSImatching, its performance is degraded when the query imagehas few distinguishing features, or when the pictures are of lowquality due to out-of-focus and/or motion blur. In the first case,lack of distinct features would adversely affect the ranking ofretrieved database images. In the second case, it is difficultto detect and extract features from blurry images. Liang et al.
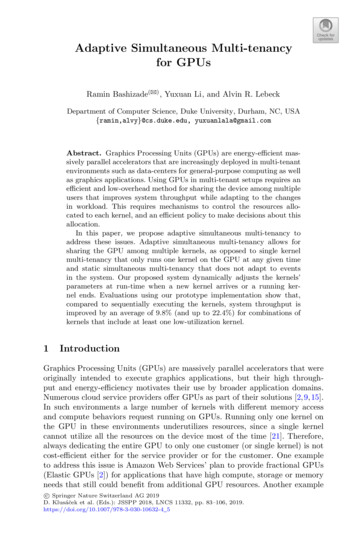
2[14, 15] have shown that in the static case, where blur-freeimages are captured with a stationary camera, image-basedlocalization could achieve an accuracy of 2 meters over 80%of the time, and 4 meters over 90% of the time.In this paper, we propose an end-to-end system which canbe used to (a) construct 3D models of large-scale indoorenvironments in a fast, automated, scalable way; (b) constructmultiple sensor, e.g. image and WiFi, signature databases forthe same environment; (c) use the reference databases in part(b) to recover position of users carrying a mobile deviceequipped with a camera and WiFi sensor. The system consistsof a man-portable backpack equipped with sensors that iscarried by an operator inside buildings walking at normalspeeds. The sensor suite consists of laser scanners, camerasand an IMU [3, 4, 11, 17, 20]. Particle filtering algorithmsare used to recover 2D and 3D path of the operator, the3D point cloud, the 2D floor plan, and 3D models of theenvironment. The same walkthrough that results in 2D maps,is used to generate multi-modal sensor databases, in our caseWiFi and imagery. We also use particle filtering algorithmsin an Android application to combine inertial sensors on themobile device, WiFi and image sensor databases, and a 2Dmap of the environment to localize the user.Our proposed simultaneous fingerprinting and mapping systemhas two main advantages over existing indoor fingerprintingschemes. First, it does not require the knowledge of the mapof the environment a priori in order to collect the fingerprints.Second, it requires significantly smaller set up time comparedto existing schemes that fall into two categories: The originalidea of [1] require tens of scans at each location with 13 meters between points; other techniques, starting with [2]obtain the training data from crowd-sourcing. Both of thesemethods require a significant amount of time to be spent ondata collection and can be problematic if the environmentchanges. In [23], Quigley et. al. map the building interior witha robot, then make a second pass with an ambulatory backpackto collect fingerprint data with the specific sensors to be usedby the client. Our method generates both the map and thefingerprint map simulatneously so that they can be used byany client.Fig. 1. Ambulatory backpack equipped with various sensors.U.C. Berkeley is shown in Figure 2. Our system builds ontop of that work by adding WiFi scanning capability to thebackpack. Specifically, we use three USB AirPcap NX cardsfrom Riverbed Technology to capture 802.11 beacons. As thehuman operator walks with the backpack, the Multi-ChannelAggregator captures WiFi beacons on all supported channelsin the 2.4GHz and 5GHz bands, recording the timestamp andRSSI of each beacon. The operator walks at normal speeds,i.e. at about 0.7 m/s, to generate a dense WiFi signature andimage database. Thus, with one walkthrough it is possible togenerate both a 2D map of the environment and the associatedWiFi and image databases for indoor localization.The remainder of the paper is organized as follows: in SectionII we present the data collection system, in Section III wediscuss the client system, experimental results are presentedin Section IV, and the paper is concluded in Section V.II. DATA COLLECTION SYSTEM OVERVIEWIn previous work, we have demonstrated that an ambulatorybackpack, shown in Figure 1, equipped with two cameras,one orientation sensor, and five 2D laser range sensors canbe used to generate a 2D floor plan and 3D model of anindoor environment with a single walkthrough of the buildingwith 10cm average 3D position accuracy [3, 4, 11, 17, 20].An example of the recovered 2D floor plan for the secondfloor of the Electrical Engineering building, Cory Hall, at(c)Fig. 2. 2D floor plan and room labels for second floor of Cory Hall.
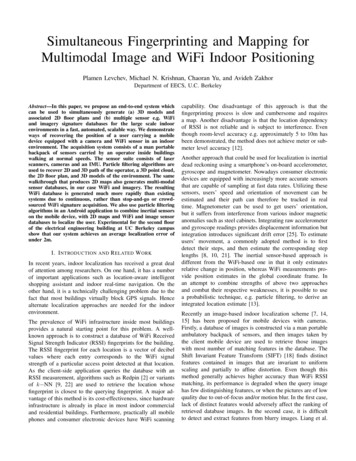
3We have experimentally verified that a normal walking speedof 0.7 m/sec does not result in significant blur in databaseimages which would adversely affect the performance of ourimage-based localization method [14–16, 18]. Images takenwith two fisheye cameras on the backpack at 4 frames per second are post-processed using algorithm in [14–16] to constructa database containing processed images, their correspondingSIFT features, pose information and depth maps.To summarize, with one walkthrough at normal walking speedwith the backpack shown in Figure 1 we generate 2D maps andmultiple sensor modality e.g. WiFi and image databases for anindoor environment in order to enable indoor positioning.III. MULTIMODAL CLIENT-SIDE POSITIONINGA. System designFig. 3. Spatial distribution of data points in our WiFi database, where eachcircle represents a WiFi signature at the corresponding location.The WiFi database consists of points in our local coordinatesystem. Each point has an associated fingerprint. A fingerprintconsists of a variable-sized set of pairs of the form (APMAC address, RSSI). This fingerprint is associated with asingle location or point in the coordinate system. The MACaddresses and corresponding RSSI values are collected bythe WiFi cards over time as they sweep through all thechannels. As a complete sweep of all channels may takeseveral seconds, depending on channel-switching delay, the setof MAC addresses and corresponding RSSI values does notprecisely correspond to a single location. Since the standard802.11 beacon period is 102 milliseconds, it is possible touse 3 AirPcap cards to scan each channel for 102 ms beforeswitching to a new channel. Assuming there are a total of30 channels to scan in the 2.4 and 5 GHz bands, this resultsin 1 second end-to-end scanning of all 30 channels; hence atwalking speed of 0.7m/s, the spacing between fingerprint datapoints in our WiFi database is approximately 0.7m. It is alsopossible to scan each channel for a period of 204 or even306 ms so as to obtain 2 or 3 beacons from each AP on thecurrent channel before switching to the next one in order toboth minimize the overhead associated with switching betweenchannels and reduce the impact of single noisy observations.We can use the median signal strength of the beacons foreach entry in our WiFi signature database to reduce the noise.However, this comes at the expense of lower spatial densityof the fingerprints in our database. Specifically, assuming thesame walking distance, the spatial density of the 204 (306) msdatabase is half (a third) of that of the 102 ms database. Anexample of 306 ms database superimposed on the 2D floorplan of the 2nd floor of Cory Hall is shown in Fig 3. Asshown, for a donut shaped square corridor of dimension 35meters, there are 76 fingerprints in our database. We use thisdatabase for the experiments in this paper.We use particle filtering to fuse inertial sensors, WiFi readingsand images to localize the mobile device or the AR glassof the user. Particle filtering is particularly attractive for ourapplication because it can incorporate observations from WiFiand image localization estimates arriving at different rates.Since the localization is done in 2 dimensions, each particleis a 3-dimensional vector consisting of the x and y positionand an orientation.The client device continually scans the WiFi channels andperforms step detection using the accelerometer. Images aretaken in one of two ways: “on-demand”, whereby the usertakes pictures of feature rich areas, and continuously, wherebyevery time a positioning result is returned from the imageserver, another image is captured. The first method requiresmore user intervention, but yields a greater localization successrate. The second method is more automatic, but can result inmany featureless images being sent to the server. In order tominimize the impact of these featureless images, the serverfirst checks if the number of SIFT features is above 150, andif it not, it returns immediately.The particle filter to combine these observations with thestep detection is performed on the device with 500 particles.The observations and step estimates are also timestamped andrecorded to allow for offline processing and thus controlledcomparison between various methods. In the following subsections, components of the particle filtering are discussed.B. Step ModelSteps are detected using the accelerometer on the mobiledevice. We use the algorithms in [24, 25] to detect stepsand estimate their lengths, and estimate the direction basedon change in orientation reported by the device since theprevious step. It is assumed that the device stays oriented ata fixed known offset from the direction of motion. For eachparticle, we add a random noise to this step estimation andapply the appropriate rotation and translation to update theparticle. The noise model comes from empirical observations
4of the variability in the estimated step lengths and orientations.If the step results in a particle crossing a wall, the particlecannot represent the true location and is thus eliminated. Ifmore than 90% of particles are eliminated, the particles willbe resampled, and if all particles are eliminated, a new set ofparticles is generated in a wide Gaussian distribution aroundthe last estimated location.C. Observation Update: WiFi and ImagesThe observations consist of two types: WiFi and image. TheWiFi observations occur periodically as the device completesscans of the WiFi channels. The image observations occurless regularly, when the device is able to capture an imagewith a sufficient amount of features to perform the localizationdescribed in [13]. At the time an observation is available,importance resampling is performed.For WiFi observations, importance factor is computed viathe Redpin algorithm [2]. For each particle, the fingerprintcorresponding to the closest point in the database is comparedto the current observed fingerprint. The weight is proportionalto the Redpin score, which compares the similarity of 2fingerprints by considering the set of command and distinctaccess points observed as well as the signal strengths.For image observations, the importance factor is a functionof the distance between the particle and the result of theimage localization. The probability distribution of the location is assumed to be Gaussian with variance depending onthe confidence returned by the image localization [15]. Theconfidence, c, is a number between 0 and 1, where 1 represents100% confidence, and the standard deviation of the Gaussianis taken to be 1 c.Since the observations require processing on a server, theparticles will have moved between the time of the actualobservation and the time the result is available. In order tocombat this delay, each particle maintains an additional statewhich records the position at the time of the outstandingobservation. The importance factor is then computed basedon the stored location rather than the current location.D. Location ReportAfter fusing multiple sources of information, the particle filterreturns a single location estimate, which is the centroid of allthe living particles. In computing the average position of theparticle cloud, it is possible for the centroid to lie outside ofthe valid region e.g. outside of the walls of floor plan. In thatcase, we use binary search along the past trajectory to find theclosest valid point as the answer.To determine whether a point is in valid regions we use raytracing as shown in Figure 4; specifically we draw a linefrom an arbitrary point outside of the polygon to the point inquestion, check whether the number of edges crossed is odd,and make sure that if the crossing is a vertex, it is counted onlyonce. Odd number of crossed edges/vertices would indicate aFig. 4. Ray tracing used to determine validity of a given coordinate.Image Localization ServerWiFi Localization Server(a)(c)(b)(d)Android MobileClientFig. 5. Client-side architecture and communication paths. The Android mobileclient is either a smartphone or an AR glass. Arrows indicate direction ofmessage transfer. Message content for each arrow is as follows. (a) Picturetaken by smartphone camera. (b) Image-based location estimate (xi , yi ). (c)WiFi measurements. (d) WiFi-based location estimate (xw , yw ).valid point. This result is known in topology as Jordan curvetheorem [6].IV. EXPERIMENTAL RESULTSIn this section, we evaluate the performance of our systemconsisting of step detection/step length estimation algorithm,and the tracking/localization system for the second floor of theU.C. Berkeley Electrical Engineering building, Cory Hall. Themap and fingerprint database is generated from a single walkthrough with the backpack, using a 306 ms channel dwell timefor WiFi, resulting in a total of 76 data points in the databaseas shown in Figure 3. The entire path is about 130m, whichon average results in about one WiFi fingerprint per 1.71m inthe database.The tracking system on the client side is implemented andtested on Android platform with the Samsung Galaxy S4smartphone running Android 4.3, which supports requiredsensor APIs. The system architecture is shown in Figure 5.The users walks around the second floor of Cory Hall orientingthe phone such that the camera is facing the outer wall, i.e.90 degrees to the right of the user.While the particle filter is executed on the phone, the observations and step estimations are stored in a text file to
5TABLE Imean errormax erroravg std 10.961.66Average performance over 10 runs with on-demand imagecapturebe processed offline. This data can then be used to simulatethe performance of the particle filter with only image oronly WiFi observations in order to allow for a controlledcomparison between the three methods.1 For both the ondemand and continuous image capture, we performed 10 runsat 3 different times of day in order to capture a variety of levelsof interference, both in terms of WiFi and image obfuscationfrom the presence of other humans in the hallways. In allruns, the operator walked an identical path counter-clockwisearound the hallway. We recorded the time taken to reach eachcorner of the path and assume the user walked at a constantvelocity over each straight section in order to create a groundtruth path. We measure the error at the time of each step as thedifference between the estimated location and the ground-truthlocation at the step with the closest timestamp.A. On-demand Image Capture(a)(b)The first set of experiments was performed with on-demandimage capture. The user selectively took pictures of areaswith sufficient SIFT features for image localization, i.e. heavoided taking pictures of blank walls. Figure 6 compares thelocalization performance for the 10 runs in terms of meanerror, maximum error, and the average spread of the particlecloud. Combined stats for all 10 runs are shown in Table I.It can be seen from the table that the combined method has thebest overall performance in terms of mean error and averagestandard deviation. Additionally, it can be seen from Figure6(a) that in all 10 cases, mean error of the combined methodis either on par with or significantly lower than both singlemodality methods. While the relative performance of the singlemodality methods varies greatly on a run-by run basis, itcan be seen from Table I that the average error for imagebased localization is slightly lower than for WiFi. It shouldbe noted that there are an average of 41.7 WiFi observationsand only 9.8 image observations, as the operator was verycautious about taking images, yet the addition of these fewreliable observations allows for a noticeable improvement inperformance.It can be seen in Figure 6(b) that maximum error of thecombined method is on par with or lower than that of thesingle modality methods except for run 1, in which the imagebased localization has a significantly lower maximum error1 We have implemented the entire particle filter on the phone to ensure ourapproach can run real time on a Galaxy S4.(c)Fig. 6. (a) Mean error, (b) max error, and (c) average cloud standard deviationfor image only, wifi only, and combined image and wifi for each of 10 runs.than either of the other methods. Similarly, Figure 6(c) showsthat the average standard deviation of the combined method ison par with or lower than that of the single modalities exceptfor run 1.Figure 7 shows the localization error as a function of time forthe fourth run, which is the run with mean errors closest tothe average of all ten runs: 2.00, 2.55, and 1.77 for image,WiFi, and combined, respectively. The dashed blue curvecorresponds to image only, the dotted red curve correspondsto WiFi only, and the solid green curve corresponds to the
6Fig. 7. Error vs timecombination. It can be seen that for much of the time, theperformance of the combined method is similar to WiFi only,since the WiFi observations are more frequent than imageobservations; however, at the time the WiFi only method startsto perform poorly, around 135-165ms, the combined methodis able to maintain a much lower error.(a)Figure 8 shows the resulting paths for each of the threemethods for the same run as in Figure 7. The dotted greencurve represents the ground truth path and the solid blue curverepresents the centroid of the particle cloud. It can be seenthat the WiFi only path in Figure 8(b) starts to drift aroundthe location (12, 32), hits the wall at (1, 28), and is forced tojump around the corner. However, the combined path in 8(c),the estimated curve tracks cleanly around the corner. A videoof the particles corresponding to Figure 8 can be found at [26].B. Continuous Image CaptureThe second set of experiments was performed with continuousimage capture. Again the phone is oriented in the same direction, but this time the pictures are taken whenever the serveris available, and not necessarily in areas with a significantnumber of features. Counts of images captured, used, andsuccessfully localized, for each run are shown in Figure 9(a).As seen, on average 73.9 images are taken, 24.5 or 33% aredeemed to have sufficient features to attempt retrieval, and 16.4are correctly localized. Retrieval success rate for the imageswith a sufficient number of features for both on-demand andcontinuous captures are shown in Figure 9(b). As expected,the average success rate for on-demand, 86.3%, is higher thanthat of continuous capture, 66.9%.A few representative example images are shown in Figure 10.Figure 10(a) is an example of a correctly retrieved image.The image in Figure 10(c) is primarily of a blank wall, sono retrieval is attempted. The image in Figure 10(b) appearsas a blurry door, which has sufficient features to attemptretrieval but fails to return a correct result. On average, thereare 8.1 incorrect retrievals per continuous image capture run,as compared to 1.2 for the on-demand image capture.Figure 11 compares the localization performance for the 10runs in terms of mean error, maximum error, and the average(b)(c)Fig. 8. Example paths for (a) image, (b) WiFi, and (c) combined.
7(a)(b)(c)Fig. 10. Representative images for which (a) localization is successful, (b) localization fails, and (c) there are insufficient SIFT features to attempt localization.(a)(b)Fig. 9. (a)Number of images captured, used, and correctly localized for the10 runs and (b) percent s uccess for on-demand and continuous capture forall 10 runs.spread of the particle cloud. From Figure 11(a), the meanerror for the combined method is on par with or lower thanthe single modality methods except for run 6. Similarly, fromFigure 11(b), the maximum error of the combined methodis on par with or lower than the single modality methodsexcept for run 10. While the maximum error for imageonly or WiFi only can exceed 16m, the combined methodnever exceeds 11m. From Figure 11(c), the average cloudstandard deviation is on par with or lower than the singlemodality methods except for run 7. Notably, it is significantlylower than WiFi only in all 10. This is due to the greatlyincreased number of observations and the fact that correctimage observations localize to greater certainty than is possiblefor WiFi observations.Aggregate statistics for all 10 runs in Figure 11 are shownin Table II. As seen, the combined method has lower meanerror and maximum error than either of the single modalitymethods. Comparing Tables I and II, we see that the meanerror of both image and combined are significantly higher thanwith on-demand image capture, owing to the lower retrievalsuccess rate. With on-demand image capture, image-basedlocalization has slightly lower error than WiFi-based, and withcontinuous capture, it has slightly higher error. The lowestoverall mean error is for the combined method with ondemand image capture at 1.81m. Even though the mean errorfor the combined method with continuous capture, 2.46m,is higher than for combined with on-demand, 1.81m, it isstill lower than for WiFi only. This indicates that even in anenvironment with primarily blank walls and non-distinctivefeatures, the use of random images can still provide someimprovement over WiFi only.
8An example video of particles for a run with continuous imagecapture can be found at [27].V. C ONCLUSIONS AND F UTURE W ORKWe have presented a complete end-to-end localization systemincluding map and database generation and client localizationwhich is faster than any other current solution while maintaining good localization accuracy, with an average error ofunder 2m. We have demonstrated that by combining WiFiand image observations, it is possible to achieve accuratelocalization even when neither system can do so on its own.Additionally, we have shown that image-based localization canperform similarly to WiFi-based localization, and can thus bea viable alternative for indoor positioning.(a)It may be possible to improve the performance of continuousimage capture by doing coarse image processing on the phoneto avoid sending featureless images to the server, which wastestransmission time and may result in missed opportunities tocapture images with more features.In addition to the Galaxy S4, we have also implementedthe client system on the Google Glass. The performancehas similar trends, but is worse overall due to the lack a 5GHz radio. It has been observed in [5, 19] that localizationperformance using 5 GHz is superior to using 2.4 GHz. TheGoogle Glass does, however, have some inherent advantagesdue to the fact that it is attached to the user’s face: sincethe face is more rigidly attached to the torso than the hand,it results in fewer erroneous step detections as compared toa phone held in the user’s hand; and additionally, since thecamera faces out from the user’s face, it will more often bein a position to capture images than a hand-held phone whosecamera will often be facing the ground while the user viewthe screen.(b)We are also in the process of developing a simplified systemfor the database generation, consisting only of a foot-mountedIMU and a mobile phone. Simplifying the map and databasegeneration will be beneficial for frequently changing environments where 3-D models are not required.(c)Fig. 11. (a) Mean error, (b) max error, and (c) average cloud standarddeviation for image only, wifi only, and combined image and wifi for each of10 runs.TABLE IImean errormax erroravg std 10.551.35Average performance over 10 runs with continuous imagecaptureR EFERENCES[1] P. Bahl and V. Padmanbhan, “Radar: An in-buildingrf-based user location and tracking system,” in IEEEINFOCOM, 2000.[2] P. Boliger, “Redpin - adaptive, zero-configuration indoorlocalization through user collaboration,” in ACM MELT,2008.[3] G. Chen, J. Kua, S. Shum, N. Naikal, M. Carlberg,and A. Zakhor, “Indoor localization algorithms for ahuman-operated backpack system,” 3D Data Processing,Visualization, and Transmission, Paris, France, 2010.[4] N. Corso and A. Zakhor, “Indoor localization algorithmsfor an ambulatory human operated 3d mobile mappingsystem,” Remote Sensing, vol. 5, pp. 6611–6646, 2013.
9[5] A. Farshad, J. Li, M. K. Marina, , and F. J. Garcia, “Amicroscopic look at wifi fingerprinting for indoor mobilephone localization in diverse environments,” in International Conference on Indoor Positioning and IndoorNavigation, 2013.[6] T. C. Hales, “The jordan curve theorem, formally andinformally,” The Mathematical Association of AmericaMonthly, vol. 114, 2007.[7
WiFi and imagery. We also use particle filtering algorithms in an Android application to combine inertial sensors on the mobile device, WiFi and image sensor databases, and a 2D map of the environment to localize the user. Our proposed simultaneous fingerprinting and mapping system has two main advantages over existing indoor fingerprinting .