Transcription
Welch Allyn Vision Express Holter Analysis SystemClinician’s Guide
2021 Welch Allyn This document contains confidential information that belongs to Welch Allyn, Inc. No part ofthis document may be transmitted, reproduced, used, or disclosed outside of the receiving organization withoutthe express written consent of Welch Allyn, Inc. Welch Allyn is a registered trademark of Welch Allyn, Inc. Burdick,Vision, H3 and VERITAS are trademarks of Welch Allyn, Inc. Software 6.4.0 2019-11PATENT/PATENTShillrom.com/patentsMay be covered by one or more patents. See above Internet address. The Hill-Rom companies are theproprietors of European, US, and other patents and pending patent applications.Hillrom Technical SupportFor information about any Hillrom product, contact Hillrom Technical Support at1.888.667.8272, mor tech.support@hillrom.com.9515-200-71-ENG Rev GRevision Date: 2021-05901143 HOLTER ANALYSIS SOFTWAREand EU IMPORTERWelch Allyn, Inc.4341 State Street RoadSkaneateles Falls, NY 13153 USAhillrom.comWelch Allyn, Inc. is a subsidiary of Hill-Rom Holdings, IncWelch Allyn LimitedNavan Business Park, Dublin Road,Navan, Co. Meath C15 AW22Ireland
TABLE OF CONTENTSINTRODUCTION. 2PREFACE .2OVERVIEW .2PROCESSING THE ECG DATA . 4BEAT DETECTION .5TEMPLATES AND BEAT LABELING .5EVENT, EPISODE AND ECTOPY PRESENTATION .7HEART RATE CALCULATION .9ATRIAL FIBRILLATION DETECTION .10SUPRAVENTRICULAR BEAT IDENTIFICATION .12ST SEGMENT ANALYSIS .13QT/QTC ANALYSIS .14TIME DOMAIN RR VARIABILITY CALCULATION .15PACEMAKER ANALYSIS .16FINAL REPORTS .17CONDENSED REPORT PATIENT INFORMATION WITH SUMMARY STATISTICS .17STANDARD REPORT PATIENT INFORMATION .18STANDARD REPORT SUMMARY STATISTICS .19NARRATIVE SUMMARY .20PROFILES .21TRENDS .23TEMPLATES .26ECG STRIP LIST AND ECG STRIPS .27FULL DISCLOSURE .30QUICK REFERENCE FOR THE HOLTER ANALYST .31RHYTHM AND CONDUCTION .31PREMATURE BEATS .37ST SEGMENT ANALYSIS .44PACEMAKER ANALYSIS .46Page 1
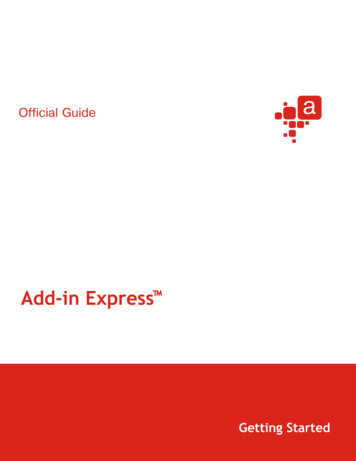
INTRODUCTIONPrefaceThis guide is intended for qualified health care professionals who want to learn more about the Vision ExpressHolter system methods for analysis. It describes various aspects of the Welch Allyn VERITAS algorithm forHolter analysis.Contents of the Vision Express final report are explained in detail for the interpreting physician’s understanding.A “Quick Reference for the Holter Analyst” section contains representative ECG strips of commonly encounteredrhythms and arrhythmias along with widely accepted medical definitions. This section also includes a description ofhow the Vision Express analysis program interprets each event.This guide does not cover the user actions such as editing, review and results generation. These instructions arecontained in the Burdick Vision Express Holter Analysis System user manual.OverviewVision Express is a high-speed, PC-based Holter scanner that performs analysis on continuous digital ECG data.The Vision Express application provides full-disclosure data for arrhythmia analysis and incorporates Welch Allyn’sexclusive VERITAS ECG algorithm for superior beat detection, QT/QTc analysis and ST segment analysis toacquired ECG data.The Vision Express system is indicated for use in a clinical setting, by qualified medical professionals only, forpatients requiring ambulatory (Holter) monitoring. Such monitoring is most frequently used for the purpose ofprospective and retrospective cardiac data and arrhythmia analysis. The analysis software package includesdetection and reporting features appropriate to the indications below: Evaluation of adult patients with symptoms suggesting arrhythmiaEvaluation of adult patients with pacemakersReporting of time domain heart rate variabilityEvaluation of patient’s response after resuming occupational or recreational activities (e.g. after myocardialinfarction or cardiac surgery)Evaluation of ECG documenting therapeutic interventions in individual patients or groups of patientsClinical and epidemiological research studiesEvaluation of ECGs from infants is limited to QRS detection and heart rate reporting, including infantsweighing less than 10 kg (22 lbs) if supported by the Holter recorder device, see specific Holter recorderUser Manual.The Vision Express analysis process consists of the following steps and components:1.2.3.Reading the raw digital ECG data and then processing and storing the digital ECG dataBeat detection and creation of templates (QRS shapes) and their group typesBeat labeling and creation of navigable events within the following selections: Strips ECG Summary TemplatesPage 2
INTRODUCTION4. Histograms Profile presentation with summary periods of data Trend presentation in five-minute periods of dataCreation of summary data to provide totals for each beat and event typeRecording acquisition and the automatic computer analysis of one or more days of recording is completed by theVision Express program in approximately one minute. Recalculation after an editing change is immediate.Templates, beats, and events are navigable and can be edited during review. Holter ECG strips are added to the finalreport manually or automatically.Holter results can be reported and exported in several different formats. The final report pages are numberedsequentially with examples explained in this guide.Page 3
PROCESSING THE ECG DATAAccuracy of the Welch Allyn VERITAS analysis algorithm has been measured in accordance with the EC38 andEC57 standards published by the American National Standards Institute and the Association for the Advancement ofMedical Instrumentation, as well as the international standard IEC 60601-2-47, who require sensitivity and positivepredictivity of ECG analysis algorithms be reported for both QRS and ventricular ectopic beat detection. Tests wereperformed on all recordings excluding those with ventricular fibrillation and artificial pacemakers of two referencedatabases: AHA and MIT-BIH. Performance results show that the Burdick Vision Express Holter algorithm has99.9% QRS detection accuracy, the best performance published by any company.Note: Evaluation of ECGs from infants is limited to QRS detection and heart rate reporting, including infantsweighing less than 10 kg (22 lbs) if supported by the Holter recorder device, see specific Holter recorder UserManual.AHA DatabasePerformance MeasuresWelch AllynQRS Sensitivity %99.88QRS Positive Predictivity %99.91Ventricular Sensitivity %93.73Ventricular Positive Predictivity %98.40False Positive Rate %0.15MIT-BIH DatabasePerformance MeasuresWelch AllynQRS Sensitivity %99.95QRS Positive Predictivity %99.87Ventricular Sensitivity %95.24Ventricular Positive Predictivity %97.05False Positive Rate %0.22It is well-known that Holter ECG signals are subject to ambulatory noise and artifacts that can make the datadifficult to analyze. Signal processing is performed to remove or lessen the types of noise and artifacts that occurduring ambulatory recording such as baseline wander and shifts caused by high electrode impedance, 50/60 Hz ACinterference, movement artifact, and muscular noise. The presence of noise and artifact in the recording can beminimized by using high-quality monitoring electrodes with proper skin preparation and electrode placement duringpatient hook up, explained in each device-specific user manual. Interactive review of the computer analyzedrecording by a qualified clinician will ensure a highly accurate final report.The results of EC 57 testing on the Noise Stress Database testify the resilience of the VERITAS algorithm to noiseup to twice the power of the ECG signal itself:NST DatabasePerformance MeasuresWelch AllynQRS Sensitivity %87.25QRS Positive Predictivity %89.44Ventricular Sensitivity %85.76Ventricular Positive Predictivity %72.42False Positive Rate %3.95Page 4
PROCESSING THE ECG DATAThe Vision Express analysis program applies a high pass filter to the data as it is acquired and read whereappropriate for the recorder. Each sample is stored accompanied by a status field that contains indicators for diaryevents, no data, pacemaker spikes, and lead fail for each of the recorded channels.Beat DetectionThe analysis program checks the signal quality on each beat to determine the best quality channels to be used. Beatdetection channels may change dynamically as the analysis progresses. Intermittent periods of lead fail or artifactwill cause analysis channel switching to ensure accurate beat labeling. If required, the user can manually excludechannels from being used in the detection algorithm.Templates and Beat LabelingThe analysis program groups beats in templates based on shape related information. Template groups such asNormal, Supraventricular*, Ventricular, Paced, and Unknown are then determined through evaluation of thedominant beat morphology, beat characteristics, prematurity and presence of any pacemaker spikes.Templates with similar morphologies are merged during the final processing step based on the correlation betweenthem.Templates are presented in a total of 4 or 5 groups that may also contain other related beat types.1.Normal Supraventricular* Bundle Branch Block Aberrant*2.Supraventricular* Supraventricular* Aberrant*3.Ventricular Fusion R-on-TOnce a beat is identified as being Ventricular, it is then compared to the previous beat. If theprevious beat is not ventricular, its RR interval is less than 500 ms, and the beat is less than onehalf of the previous beat’s RR, it is declared an R-on-T beat by the analysis program. Interpolated Ventricular Escape4.Paced Atrial Paced Ventricular paced Dual Paced5.Unknown* When the user has selected Enable Supraventricular Template Group, all normal beats that meetthe set SVPB prematurity percent criteria and manually labeled aberrant beats will be in theSupraventricular template group and not included in the Normal template group.Page 5
PROCESSING THE ECG DATAEach individual beat type is color-coded for rapid identification during review.Automatically applied beat labels by theanalysis program:Manual beat labels:Note: Deleted beats and beats relabeled asartifact are removedDuring review and editing, any applied beat label can be relabeled by the analyst with any one of the 13 beat labels.Additionally, the analyst may relabel a beat or region of the recording as Artifact to exclude data from being usedfor analysis, delete a beat or all beats within a template, and insert beat labels as desired. If an entire Template isrelabeled Artifact, a short episode of recording containing each beat that is part of the template will be relabeledArtifact.User-labeled Fusion and Interpolated beats will be classified as a ventricular beat type and used for ventricularcalculations. User-labeled Bundle Branch Block beats will be classified as a normal beat type. Supraventricularbeat types are identified by the program according to a user-defined prematurity percent setting and are containedwithin Normal templates or Supraventricular templates when enabled, as their QRS morphology is classified normalaccording to the dominant beat shape. Beats that are manually labeled as Normal or Supraventricular will not berelabeled on the basis of prematurity. User-labeled aberrant beats will also be classified as a supraventricular beattype.Ectopic beats are grouped as "single" (one ectopic beat followed by a Normal beat), "couplets" or “pairs” (2contiguous ectopic beats) and "Runs" (3 or more contiguous ectopic beats).Page 6
PROCESSING THE ECG DATAEvent, Episode and Ectopy PresentationRhythm, QT and ST-segment analysis is performed using Welch Allyn’s advanced VERITAS algorithm todetermine isoelectric, Q, R, S and ST measurement points. The beat time, classification family, ST level, noiseproperty,Q onset and offset, QT interval, template number, and RR interval is analyzed for every beat and is processed bybreaking down this information allowing the analyst to rapidly navigate to events and episodes through use of theVision Express Profile, Histograms, and Trends.User-defined scan criteria settings can be modified on a per-study basis or set as a default for the following: Pacemaker analysis on/off and minimum pacemaker rateAutomatic atrial fibrillation detection on or offSupraventricular prematurity percentagePause duration in msec and if pauses are excluded from minimum HR calculationPauses to use all beats or only normal to normal beatsST Segment Depression and Elevation thresholds in μVTachycardia/Bradycardia heart rate thresholds and minimum durationVentricular Tachycardia rate and number of consecutive beatsSupraventricular Tachycardia rate and number of consecutive beatsHeart Rate calculation on all beats, or only normal beatsHeart Rate Variability calculation on normal beats only, or normal and supraventricular beatsThe analysis program will identify ventricular bigeminy when the following pattern is present for at least 3 cycles:NVNVNV Ventricular trigeminy is identified when the following pattern is present for at least three cycles:NNVNNVNNV Navigation to these rhythm patterns is best performed in the Profile display.The analysis program will identify supraventricular bigeminy when the following pattern is present for at least 3cycles: NSNSNS Supraventricular trigeminy is identified when the following pattern is present for at least threecycles: NNSNNSNNS Navigation to these rhythm patterns is best performed in the Profile display.Supraventricular or ventricular beats that occur during bigeminy and trigeminy episodes are included in the totalectopic beat count. The profile and summary statistics report the total number of beats that occurred during thebigeminy and trigeminy episodes (ventricular or supraventricular Normal) in their respective columns.Periods of artifact that occur within a tachycardia or bradycardia episode will be considered to have the same heartrate and will be included in the duration of the event.A colored Event Bar is selectable for display in the ECG view to indicate the start and end of an episode or event forthe types listed below. Users may also define up to three custom event types per Holter study. Some event episodesmay overlap and may not be visible. Event episodes are prioritized as follows: Exclusion (lead fail, artifact, user-removed)Atrial FibrillationUser-defined Event 1User-defined Event 2User-defined Event 3ST DepressionST ElevationVision Express Profile information is broken into one-hour periods with calculated information presented for eachperiod and a summary for the entire recording period.Page 7
PROCESSING THE ECG DATAVision Express RR Intervals Histogram information is created displaying the number of intervals that fall within 20ms bins. This feature provides a graphical representation of the interval distribution allowing quick determination offrequency and density of intervals as well as navigation to the most extreme events.Vision Express Trend information is broken into five-minute periods presenting a minimum, average and maximumgraphical representation of events and episodes.Profile Events Beat totalMin/Mean/Max Heart RateBradycardia/TachycardiaBundle Branch Block BeatsAberrant BeatsInterpolated BeatsUnknown BeatsSupraventricularAtrial Fibrillation percentVentricularPaced events and failuresMin/Max RRPausesST Elevation/DepressionRR variability calculationsMin/Mean/Max QT/QTcUser-defined episodes (3)Histogram Events RR IntervalSupraventricularPrematurityPace Spike QRSQRS Pace SpikeVentricular RunSupraventricular RunTrend Events Min/Mean/Max Heart RateBundle Branch Block BeatsAberrant BeatsInterpolated BeatsUnknown BeatsSupraventricularAtrial Fibrillation percentVentricularPaced events and failuresMin/Max RRPausesST Elevation/DepressionRR variability calculationsMin/Mean/Max QT/QTcUser-defined episodes (3)Page 8
PROCESSING THE ECG DATAHeart Rate Calculation Minimum and Maximum HR are calculated in a sliding window of 7.5-second intervalsMean HR is calculated on all beats within the time period (hourly, 5-minutes, 24-hours, etc.)The analysis program calculates a heart rate for every beat based on the RR intervals in a 7.5-second windowcentered around the beat with a two interval minimum. The minimum and maximum (current) heart rate is thencalculated using these heart rates in the defined profile period (e.g. one hour). The Vision Express heart ratemeasurement range is 20 to 300 BPM.Minimum and maximum heart rates consider all beats with a valid RR, unless configured to exclude RR intervalsgreater than the user-defined pause duration. The analysis program can also be configured to use only normal beats(Normal to Normal intervals) for heart rate calculation.Mean heart rate is calculated on all beats with a valid RR interval within the recording period. This calculation canalso be configured to use all beats or only normal beats.There are two settings in the user defined Scan Criteria window that will affect heart rate calculation:1) [Pause] Normal to Normal Only and 2) Exclude Pause from HR.A pause is declared when the RR interval is greater than the user defined pause duration in the Scan Criteriawindow.The heart rate RMS % error, as measured according to EC57 for the AHA, MIT-BIH and the Noise Stress Testdatabases are 2.69, 1.72 and 41.53 % respectively.Page 9
PROCESSING THE ECG DATAAtrial Fibrillation DetectionAtrial fibrillation episode detection is based on RR interval variability and p-wave analysis. Due to the nature ofatrial fibrillation, detection is performed on episodes rather than beat-by-beat. The analysis program first divides theECG into short sections of beats to compute the amount of variation in the RR interval of all beats with a normalmorphology and the probability of P-wave presence prior to the QRS. When a criteria threshold is reached, thepresence of atrial fibrillation is declared at the time of onset is established. Periods of artifact that occur within anatrial fibrillation episode will be considered to have the same average heart rate and will be included in the durationof the atrial fibrillation event.In the interest of a high specificity, short (less than a minute) episodes of atrial fibrillation may not be seen by theautomatic algorithm. These clinically less important episodes may be added by the user when encountered, usuallyduring the review of supraventricular beats.Regular (non-chaotic) variability, such as that which can be generated by occasional periods of supraventricular runswith regular rate or atrial flutter with constant AV-conduction, is specifically excluded by the detection algorithm.Irregular rhythm caused by sinus arrhythmia or frequent ectopic beats is also excluded in lieu of the presence of a Pwave in all or the majority of beats.The analysis program does not automatically detect atrial flutter episodes which tend to present a regular rhythm thatis not chaotic or random, as well as a “P-wave” (flutter wave) correlated with the QRS complex. This episode typecan be manually classified by the analyst by applying a user-defined event.The percent of atrial fibrillation is summarized hourly and for the entire recording. An Atrial Fibrillation peakaverage heart rate value in the summary statistics reports the highest averaged heart rate of all of the atrialfibrillation episodes. This result may be useful when intermittent periods of atrial fibrillation are present.MIT-BIH DatabasePerformance MeasuresWelch AllynEpisode Sensitivity %74Episode Positive Predictivity %76Duration Sensitivity %94Duration Positive Predictivity %78Duration False Positive %N/ANST DatabasePerformance MeasuresWelch AllynEpisode Sensitivity %N/AEpisode Positive Predictivity %0Duration Sensitivity %N/ADuration Positive Predictivity %0Duration False Positive %12.9Page 10
PROCESSING THE ECG DATAPerformance has also been measured on the Physionet AFDB /afdb/), a database specifically collected to test the performance of atrialfibrillation algorithms. Results are as follows:AFDB DatabasePerformance MeasuresWelch AllynEpisode Sensitivity %49Episode Positive Predictivity %95Duration Sensitivity %92Duration Positive Predictivity %99Duration False Positive %N/AThe AFDB database has also been used in a comparative study, using a slightly different way of measuringperformance. The VERITAS results measured in the same way testifies the high specificity of the algorithm and arereported in the table below.Page 11
PROCESSING THE ECG DATASupraventricular Beat IdentificationSupraventricular beats are shaped the same as normal beats, unless they are aberrantly conducted, and are includedwithin the Normal templates and the Normal template group or the Supraventricular template group when the userhas enabled it. The SV Prematurity (%) Histogram presents a graph of beats according to prematurity %. Thisoffers a way to locate, review, and adjust prematurity percentage as needed.The SV Prematurity % value is adjusted through selection of the menu barEdit and Scan Criteria dialog. The clinician can change the SVPBprematurity percent to adjust when there are false calls. The default is25%.If SVEs are under called, the value can be decreased (20%, 15%, etc.).If SV beats are overcalled, increase the value (30%, 40%, etc.).The entire Holter recording is updated immediately after a change to theprematurity % value is made and the OK button is selected.Supraventricular Prematurity Calculation: Supraventricular beat identification is based on the average R-to-Rintervals from the previous Normal beats. Each beat is associated with an envelope of 16 preceding normal R-Rintervals as demonstrated in the example below.The Supraventricular Template group, when enabled, and Supraventricular Ectopy columns within in the Profile taband the Rhythm section are also helpful to quickly navigate to the system identified rhythm events.Note: When a run of SVT approaches or exceeds 16 consecutive beats, the prematurity of the next R-R interval islikely to approach zero, since it is calculated compared to the previous 16 R-R intervals. Therefore, the next beatwill be labeled normal (N) and the run is ended. In this case, the clinician may edit the beats of a long run whencontinuation of the run is determined. If, during a run of SVT, the next R-R interval is less than 400 ms (rate isgreater than 150 bpm), it is always labeled supraventricular (S) independent of prematurity and the run is not ended.Page 12
PROCESSING THE ECG DATAST Segment AnalysisDuring analysis, a per-beat measurement of ST level is determined at 60 msec post J for each “normal” beat. STepisode detection is performed by first processing all beats and then averaging the beat ST levels for each channel,excluding aVR, for each five-minute period in the recording.An ST episode in a channel is found when the user-configured threshold is reached AND a 100 μV step occurredwithin one hour before the threshold was crossed, using the five-minute averages. Subsequently, the precise channelonset of the episode is found by determining where the individual beat measurements crossed the threshold. If achannel onset is found for more than one channel, the earliest of the channel onsets is used as the episode onset.Starting from the episode onset, the next twelve five-minute episodes (one hour) are evaluated for being below thethreshold or showing a 100 μV step back. If the sum of these episodes in the next hour reaches a threshold, meaningthat the ST-level has come back consistently, the offset of the episode is declared. This is done on all the channelswhere an onset was found, and the offset of the episode is determined where the last channel offset was found.The same process is then repeated backward in time, that is, from the last five-minute episode in the recording to thefirst, interchanging the offset and onset. Lastly, the ST-episodes found in the forward process are merged with thosefound in the backward process.The same process is used for ST-depression and ST-elevation.For each ST episode, the maximum ST values for each channel are calculated and the time at which each occurred issaved. The channel with the largest ST (average) value is labeled as the Primary channel, and the time of itsmaximum value is declared as the event time of the episode. The average ST value for each channel is calculated.The ST-segment analysis performance of the VERITAS algorithm has been tested on the European STT databaseaccording to EC57. The results are depicted in the table belowSTT DatabasePerformance MeasuresWelch AllynDiscrepant measurements 100 μV %7.3Discrepant measurements 150 μV %2.2Discrepant measurements 200 μV %0.8Mean absolute error μV49.1Mean error μV8.5Standard deviation μV66.1Page 13
PROCESSING THE ECG DATAQT/QTc AnalysisQT interval evaluation may be beneficial in detection of abnormal prolongation due to drug effects, electrolyteimbalance or genetic diseases, in order to evaluate the risk of serious ventricular arrhythmias that can lead to suddencardiac death. The VERITAS algorithm automatically determines the QT from the interval between the earliestventricular depolarization activity and the latest “end-of-T” point. This determination utilizes average beats astemplates to reduce the effects of noise, but the actual QT interval determination is made on each single beat.Each single QT value is corrected for previous heart rate (RR-intervals) by one of three formula's chosen by theuser: Welch Allyn Linear, Bazett or Fridericia. These formulae correct the QT value for heart rates that differ from60 bpm (RR intervals of 1 second). The following formulae are used where HR is expressed in beats per minute andQT, QTc and RR are expressed in seconds: Welch Allyn Linear:Bazett:Fridericia:QTcL QT (1-RR)*S (See Note below)QTcB QT (HR/60)1/2 QT (RR)-1/2QTcF QT (HR/60)1/3 QT (RR)-1/3There are three
Vision Express is a high-speed, PC-based Holter scanner that performs analysis on continuous digital ECG data. The Vision Express application provides full-disclosure data for arrhythmia analysis and incorporates Welch Allyn's exclusive VERITAS ECG algorithm for superior beat detection, QT/QTc analysis and ST segment analysis to .