Transcription
Final ReportAirborne Aero-Optical Laboratory - TransonicN00014-16-1-3186Eric J. JumperProfessor, University of Notre DameDepartment of Aerospace and Mechanical EngineeringUniversity of Notre DameNotre Dame, IN 4655629 November, 20181
AbstractThis report covers the first and second year of this ONR grant, but it is the fourth and fifth yearsof the Airborne Aero-Optics Laboratory-Transonic (AAOL-T) program, whose first three yearswere under an AFOSR grant. Aero-optics severely limits an airborne directed-energy system’slethal field of regard; aero-optics refers to the deleterious effect that the density fluctuations inthe flow have on an airborne optical system. The AAOL-T program studies aero-opticalaberration problems from experimental, theoretical and computational approaches; the mostunique part of the program is that we also perform flight tests using Falcon 10’s, capable oftesting at greater than Mach 0.8. The program makes use of two aircraft, one to project a smallaperture, diverging beam toward an optical turret on the second, laboratory aircraft. The fourthand fifth years of the program have been productive with flights in support of both the baselineprogram and to support AFRL/DARPA 40% ABC Turret testing. During the baseline program,extensive measurements of aero-optical environment around both hemisphere-on-cylinder andhemisphere-only turrets were performed for Mach range between 0.5 and 0.8.2
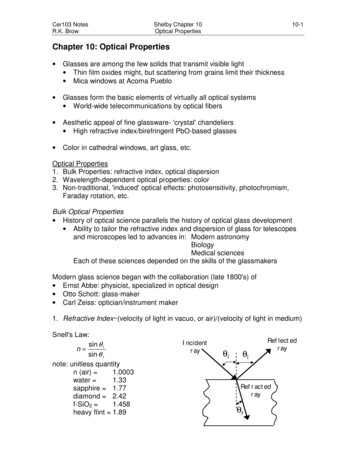
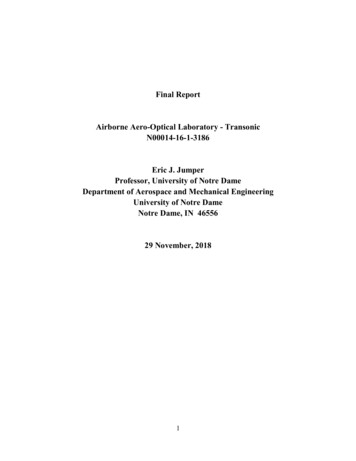
Airborne Aero-Optics Laboratory – Transonic (AAOL-T)I. INTRODUCTIONThis report covers the final two years of an original 5-year HEL-JTO Grant that began itsfirst three years as an AFOSR Grant, FA9550-13-1-0001 which ended in 2015. Because ofadministrative problems, the last two years of the Grant became administered by ONR underONR / DE-JTO Grant N00014-18-1-2112, whose performance period ended in August 2018.The final report from the AFOSR Grant is attached as an appendix. This report covers the periodfrom August 2016 to August 2018. As the title implied, the primary research in AAOL-T coversthe collection and analysis of aero-optics. In its most restrictive definition, aero-optics refers tothe deleterious effect that the density fluctuations in the flow over the exit or receiving pupilhave on an airborne optical system, thus the name “aero-optics.” Except for some wavefrontgathering on the AirBorne Laser, ABL, near the end of its program to assess aero-optic scalinglaws, the AAOL [1] and present AAOL-T programs are the only programs to collect highquality, aero-optically-aberrated wavefront data in flight [2,3,4]. The AAOL-T programcontinues to include Aero-Optics, the focus of AAOL, as its primary focus but at higher Machnumbers [5]; however, the AAOL-T program has additional objectives that were not part ofAAOL: these specifically include aero-mechanical studies (i.e., aero-buffet of the turret andinduced jitter), more emphasis on mitigation approaches that include adaptive optics, andspecific emphasis on support of other programs.The laboratory Falcon 10 is owned by Notre Dame, N100ND, and was donated to theprogram by Mr. Matthew McDevitt. At least in the near term, a video of the Notre Dame openhouse for the AAOL-T can be viewed at: nation-enables-research-at-transonic-speeds/. The program uses two Falcon 10’s, the donatedFalcon and a second Falcon which prior to the ONR Grant was rented from Northern JetManagement; however, due to some FAA changes, Notre Dame ended up purchasing the secondFalcon 10, N349JC, so that Notre Dame now owns and maintains both aircraft. It should not beforgotten that the program also includes computational work and testing in wind tunnels.II. AAOL-T FLIGHT-TESTSIn a standard data-acquisition flight test, two Falcon 10s fly in formation at a nominal 50 mseparation as shown in Figure 1. A diverging small-aperture 0.532 µm laser is directed from thesource aircraft to the turret on the laboratory aircraft, diverging to over fill the turret aperture.3
Figure 1. Formation flight with nominal 50 m separation showing diverging source beamemanating from the source aircraft and overfilling turret aperture on laboratory aircraftFigure 2. View from inside the source aircraft.The baseline AAOL turret can be configured as either a hemisphere, a hemisphere with acylindrical base, a spherically-conformal window, a flat window and some geometry changes atthe base of the turret. All of these configurations were flown in the previous program at Machnumbers less than Mach 0.7 and these have all been re-flown at Mach Numbers up to Mach 0.8.In addition, the AAOL-T program supported testing of the Air Force Research Laboratory(AFRL/RD/DARPA) 40% ABC Turret. Figure 3 shows a typical setup for an AAOL-T flightexperiment. The upper right hand corner of the figure shows from right to left the optical box towhich the turret extends out of a newly-built door, designed to allow the turret to extend into theslip stream and form a pressure seal. Above the optical box is the turret control computer. Thebeam from the incoming laser from the chase plane is projected onto the optical bench to the finetrack PDS and FSM systems and then to the various instruments. In the lower right corner ofFigure 3 there is a schematic shown a setup used to gather wavefronts, usually at a frame rate offrom 30 – 50 kHz with subaperture resolutions from 33X33 to 64X64.4
Figure 3. Typical AAOL-T Flight Experiment Setup.The Flight Campaigns starting with the August 2015 ABC 40% Turret Support Throughthe August 2018 Campaign are listed in Table 1. It should be noted that these campaigns whichwill be describe in more detail later, cover research from basic to applied, the applied beingcovered under the objective to support other efforts for DoD research.As shown in Figure 4a, this supports our original mission statement for the originalAAOL and this AAOL-T program of developing a process to take concepts from ideas torelevant TRL levels that can find their way onto systems. This is demonstrated in Figure 4bexplaining the TRL levels. Notice under the Analysis/Simulation column our program raises theTRL level to 6 (wind tunnel) to 7 (flight) and in some cases as in the ONR/NAVAIR support(Table 1, item VI.) to level 8.Figure 4a. Original Mission Goal.5
Figure 4b. Description of TRL levels.TABLE 1AAOL-T Flight CampaignsI.II.III.IV.V.VI.VII.VIII.IX.X.ABC 40% Turret 9 Sorties, August 26 – 31, 2015HEL JTO MRI/ ABC Support Campaign 7 7 Sorties February 22 – 28, 2016ABC Support Campaign 8HEL JTO MRI Boundary-Layer Study 3 Sorties March 29 – 30, 2016HEL JTO MRI Global Fence 6 Sorties April 26 – May 2, 2016ONR / NAVAIR 4 Sorties June 26 – 29, 2016HEL JTO MRI Imaging 4 Sorties Sept 9 – 10, 2016Mitigation Study 4 Sorties Oct 16 – 21, 2016HEL JTO MRI 4 Sorties Oct 17 – 20, 2016 Imaging StudyHEL JTO MRI Imaging 4 sorties May 9 – 10 , 20176
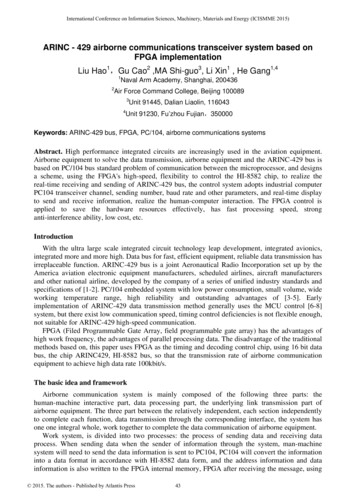
III.RESEARCH ASSOCIATED WITH FLIGHT EXPERIMENTSIt should be noted that results from our support efforts for ONR/NAVAIR andAFRL/DARPA along with some of the MRI work that later was determined to have limitedaccess are not included in this report. Rather, in this section the research performed that hasunlimited access will be described.Wavefront Contamination by Accoustic Disturbances. While analyzing wavefrontdata from the March 2016 Campaign, Dr. D.J. Whittich, AFRL/RD, noticed some periodicstructues in wavefronts for Az 87o, El 37o at Mach 0.5 in wavefronts that were expected to bevery quiet in the sense that it represented propagation through an attached turbulent boundarylayer. Furthermore, such structures were not representative of years of wavefront data taken forpropagation through attached turbulent boundary layers. Our initial reaction was to assume thatthese wavefront structures must be due to noise, i.e., contamination, or mechanical vibrations.Figure 5 is one wavefront frame from the campaign. The wavefront is from a turret viewingangle of angle of Az 87o, El 37o where 0.0 Az is looking directly into the oncoming flow.At these angles the flow is fully attached to the lens over the aperture. The flow is from left toright. Analysis of the time series from which the wavefront was taken showed that thedisturbance was moving upstream into the oncoming flow. Computation of the OPDrmsFigure 5. Wavefront showing the vertical stripes.showed that while the OPD was small, it was a bit larger than it should be. Interestingly as theAz was slewed off 87o 5o, the OPD dropped down to expected level and the stripes nolonger appeared in the wavefronts.The time series of wavefronts were then analyzed using Proper OrthogonalDecomposition (POD). This is done by decomposing the wavefront series into its fundamentalspatial modes as7
Where φn(x,y) are the POD modes and an(t) are the temporal eigenvalues. The POD modes arecomputed usingThis allowed us to examine the spectra of the temporal eigenvalues for specific modes andreconstruct a time series of using only those specific modes. Further we could examine therelative mode energy of the selected modes at different turret angles. The stripe characteristicswere found to be present primarily in Modes 2, 3 and 4. These Modes are shown in Figure 6.Figure 6. Spatial POD Modes for Modes 2,3 and 4 also showing the energy contained in thosemodes as a present of energy in all modes and the typical structure size in Mode 3 in actual spaceIt can be seen that these three modes contain 40% of the total wavefront distortion energy. Theeigenvalue for a3(t) is shown in Figure 7 along with its spectra. Notice that the frequency peaksat 4.717 kHz. Similar analysis performed at only a few degrees off still showed similar modeswith similar frequencies, but at much lower mode energy, eventually dropping to 3% and less ofthe total wavefront energy by 5o off angle dropping off to nearly 0% by 10o.Figure 7. Geometry of engine and turret8
All these characteristics suggested that the wavefronts were imprinting acousticdisturbances from the turbofan engine whose inlet was 4.35 m downstream from the turretcenterline. Figure 7 shows the geometric association of the turret location with the turret alongwith the rationale for why the imprinting was only pronounced at 90o. When off angle thewaves would tend to cancel.The waves would propagate at the speed of sound into the incoming flow so that thewaves convective speed would bewhere Uc is the convective velocity, c is the speed of should and U is the incoming flow speed.Given the OPD of the wavefronts it was possible to estimate the engines sound pressure level,SPL. Referring to Figure 8, the OPD was obtained by integrating through the acousticdisturbance some length L. Based on the fall off of energy determined from different slewangles, L was estimated to be 0.4 m; then the SPL was estimated to be 115dB, as follows:Based on SPL measurements on the ground, 115dB was a reasonable SPL [6].Wind-Tunnel Boundary-Layer Study. From a basic research point of view, large scalestructures in a turbulent boundary layer have long been of research interest [See Ref 7, forexample]. Large scale structures are also the most optically active. Adaptive-Optic systems canbe tuned to correct distortions caused by large scale structures [8]. Once the large scalestructures have been studied, their convective nature can be leveraged to develop latency tolerantAdaptive-Optic controllers. Further, wavefront sensors now offer a way to study these structuresthat has not been available with other instruments.A wind-tunnel experiment was performed with an experimental set up shown in Fig. 8. Itshows a double-pass through two boundary layers, one on each side of the Notre Dame TrisonicWind Tunnel facility. At the interrogation point the Reynolds number based on the boundarylayers’ momentum thicknesses was Reθ 15,500, Reynolds number based on skin-frictionvelocity, Reτ 4,780 and the Mach number was 0.5 and the boundary layer thicknesses were δ 15.6 mm. It should also be noted that the aperture is limited [9].9
Figure 8. Experimental setup for turbulent boundary-layer studyA companion experiment was also performed at Caltech in their turbulent boundary-layerfacility. In this experiment the structures could only be seen by slightly heating the flowupstream of the viewing port. Only one side was heated so although it was again double pass,only one boundary layer was interrogated. The boundary layers momentum thickness was Reθ 2,100, Reynolds number based on skin-friction velocity, Reτ 1,200 and the Mach number was0.03 and the boundary layer thicknesses were δ 35 mm. The setup is shown in Figure 9, noticethat in this experiment the aperture was again limited.Figure 9. Caltech SetupIn both experiments full 2D wavefronts were collected with varying spatial and temporalresolution. The relevant information on all the experiments is given in Table 2 and the resultsfrom these experiments are shown in Fig. 10.Table 2, Boundary Layer10
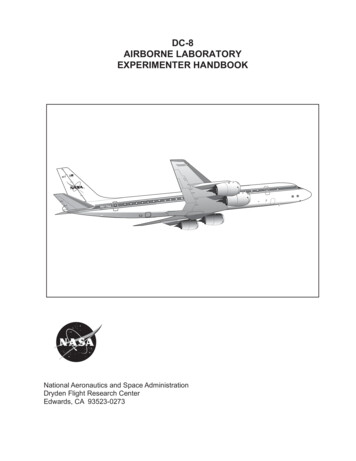
Figure 10. Spectrum of Deflection Angles in the streamwise direction from the subapertures in thewavefront sensor dataWhat is clear from Fig. 10 is that the high-frequency jitter due to the passing structures are allsimilar; however, the low-frequency, larger-structure spectra diverge based on aperture toboundary layer ratios shown in Table 2. The low-frequency spectra is lost since in processingthe wavefronts the overall tip-tilt is removed, leaving only the higher-order aberrationinformation for structures smaller than the aperture.It is clear that this low frequency tip-tilt information is important because it is directlyrelated to beam jitter which must be removed by a fast steering mirror, FSM. In this MRI, weresearched how this information might be recovered from wavefronts that have apertures smallerthan the largest aero-optic aberration through which the laser passes. This information isimportant to know independently because wavefronts collected either in the air or in windtunnels also have overall tip-tilt imposed by vibration and buffet which is why the overall tilt isremoved prior to processing the wavefronts. Our research was thus aimed at recovering only theaero-optic tilt.A wavefront can be broken down into higher-order wavefront, ω(x,y,t), overall Tip-Tiltand piston (also removed in processing) as follows:Furthermore, piston is an unknown quantity,. Although boundary-layer structuresevolve, the evolution is slow compared to the convection so that they primarily convect. Alonger than structure size can thus be well estimated by allowing them to convect and restoringpiston and tip-tilt to preserve smooth wavefront surfaces. Time can then be traded for space toconstruct a long wavefront “strip” from a time series of wavefront data taken at sufficient framerate to assure some overlap. Figure 11 shows two wavefront frames where the same structure ispresent in both frames, i.e., overlap.11
Figure 11. Two “overlapping” wavefront framesIn the overlapping region between frames the tip, tilt and piston is adjusted until a minimum inthe RMS error is found.Once the frames have been tip, tilt, and piston corrected they can be averaged together to formthe stitched wavefront. This process trades time for space and reveals large-scale structures thatwere not available in single aperture-restricted wavefronts, as shown in Fig. 12.Figure. 12. Stitched Wavefront, W(x,y) from two in Fig. 11A longer stitched strip is shown in Fig. 13, also highlighted in the Fig. 11 and 12 wavefronts.As can be seen long structures are now fully captured in the strip. Frequency spectra now showenergy in the low-frequency portion of the data, as shown in Fig. 14. Note that the peak energyfor Ap/δ of 3 and twenty are close indicating that the largest sturctures can be captured withAp/δ of from 3 – 5 [12].Figure 13. Longer Strip wavefront shown the large-scale structuresAs shown in Fig. nergy deficit and peak location shift can be attributed to tip/tilt removal12
Figure 14. Spectra based on generated Strip from Fig. 13Imaging Experiments. Toward the end of the Grant, we began performing imagingexperiments using the Falcon 10 aircraft. These experiments were motivated by the fact that partof any engagement requires target identification. As shown in Fig. 15, the aero-opticalaberrations will reduce the focus to below that of range through a vacuum, also shown.Figure 15. Effect of Aero-Optical on imagingBased on collected aero-optics wavefronts collected it is possible to compare the Point SpreadFunction (PSF) for a vacuum, as shown in Fig. 16, with PSF based on flight data. Figure 16shows the PSF for vacuum in the top at two ranges and the PSFs for a turret viewing angle of 89oat the same two ranges at lower left and at a view angle of 125o at the same two ranges in thelower right. At a viewing angle of 89o the aberration is due to an attached turbulent boundarylayer which has low OPDrms, but at 125o viewing angle the imaging is through a separated shearlayer which has large OPDrms.13
Figure 16. PSF for aero-optically-aberrated telescope, lower left through telescope at a viewingangle of 89o, lower right at a viewing angle of 125o, with that of a vacuum shown at the topThe CONF and HEMI in the image indicates the turret configuration. This work was carriedover into the follow-on DE-JTO MRI. The results from these and follow-on flight experimentsare to be reported under the new grant.High-Fidelity Computations. The high-fidelity computational work sponsored by thegrant was initially performed to answer the question of “how good is good enough.” The goalwas to use Computational Fluid Dynamics (CFD) to improve our understanding and predictivecapability of turret aero-optics at realistic Reynolds and Mach numbers. This last provision is nominor requirement because our work was actually the highest Reynolds and Mach numberscomputed using LES. The optical turret used on the AAOL was simulated using Wall-ModeledLarge-Eddy Simulation (WMLES) at the actual flight Reynolds number of 2,300,000 and Machnumber of 0.4. As it turned out, even the highest fidelity computations began to represent theflight data; however, even these did not fully validate using CFD to compute aero-optics. In theend we used Large-Eddy Simulation (LES) on more than 10,000 cores running for approximatelyone week. Even slight changes in turret geometry led to extensive modifications of the code;however, these computational studies were instructive in better understanding the flow fieldaround a turret and how small geometric characteristics of a turret configuration can affect theaero-optics. Shown here are some of the highlights of this work. The results are beingextensively reported in the literature and should be available within a few years.The solver domain is shown in Fig. 17. The LES code used was the compressible CharLEScode, developed at Cascade Technologies, Inc. It is a low-dissipative 2nd order finite volumecode for spatial discretization. It is third-order Runge-Kutta in time. It uses a Vreman model forthe subgrid-scale stress and an equilibrium stress-balanced wall model [13].14
Figure 17. Computational domain used for simulating TurretFigure 18 shows comparisons of the code results from separate measured flow parametersmeasured for the turret in our wind tunnel to validate the mesh insensitivity.Figure 18. Comparisons of code results with measured data to validate mesh independenceFurther results are shown in Figs. 19 -23. The mean surface streamlines are shown comparedto oil-flow visualization in Fig. 19. Unsteady pressures were calculated and compared toexperiments using pressure sensitive paint. Both computed unsteady pressure and experimentalpressures were reduced to POD modes, as shown in Fig. 20. Several modes are common forexperimental and computational results. In Fig. 21, compares OPDrms along the centerline of theturret from simulations with different mesh grids compared to wind-tunnel experimentsmeasuring OPDrms using various sensors. Along the centerline the comparisons are the best we15
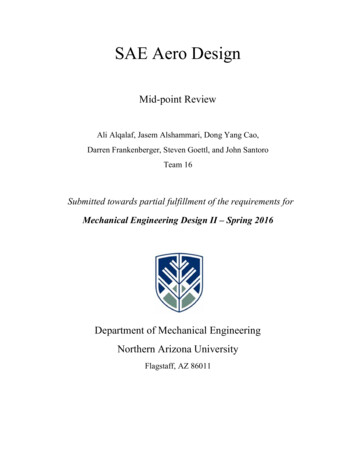
have seen from any other type computations; however moving off centerline the OPDrmsamplitudes were under predicted from those of the experiments.Figure 19. Computed mean surface flow lines (left) compared to oil-flow visualization (right)Figure 20. Joint POD modes from simulations (top) and from experiment (bottom)Figure 21. Comparison of OPDrms between computations and experiment16
One thing that is interesting about having a computed flow over a smooth turret is that it ispossible to compute OPDrms at any Az vs El position of interest. This was done for an Ap/D of0.333 with the points indicating the center of the aperture. The locations and OPDrms are shownin Fig. 22. The effect of the separation and horn vortex in the separated flow can be easily seen.Figure 21. Normalized OPDrms vs Az and El position on turret.When these data are recast as normalized OPDrms vs viewing angle a number of things jumpout. First of all it is clear why the data diverges from a nice viewing/lookback angle, α, curveshown in green with is universal over a fairly large range of modified elevation angle, β, as theaperture begins to encounter the horn vortices. It is in these regions that the computations underpredict the amplitude of OPDrms, whereas in the region where the curve collapses to the greencurve the simulation does a fair job in matching experiment. While these were done for an Ap/Dof 0.333, it was done for a number of aperture sizes to develop a relation as a function ofaperture size.Figure 22. Relationship for viewing angle, α, and modified elevation angle, β, as a function ofAz and El (left) and normalized viewing angle for α and β17
References[1] E Jumper, M Zenk, S Gordeyev, D Cavalieri and M. Whiteley, "Airborne Aero-OpticsLaboratory”, Journal of Optical Engineering, 52(7), 071408, 2013.[2] C. Porter, S. Gordeyev, M. Zenk and E. Jumper, "Flight Measurements of the Aero-OpticalEnvironment around a Flat-Windowed Turret”, AIAA Journal, Vol. 51, No. 6, Jun. 2013, pp.1394-1403.[3] N. De Lucca, S. Gordeyev and E.J. Jumper, "In-flight aero-optics of turrets”, Journal ofOptical Engineering, 52(7), 071405, 2013.[4] R. Burns, S. Gordeyev, E. Jumper, S. Gogineni, M. Paul and D.J. Wittich, “Estimation ofAero-Optical Wavefronts Using Optical and Non-Optical Measurements ”, AIAA Paper2014-0319, 2014.[5] A. Vorobiev, S. Gordeyev, E. Jumper, S. Gogineni, A. Marruffo and D.J. Wittich, ”LowDimensional Dynamics and Modeling of Shock-Separation Interaction over Turrets atTransonic Speeds”, AIAA Paper 2014-2357, 2014.[6] N. De Lucca, S. Gordeyev, E. Jumper and D.J. Wittich, " Effects of engine acoustic waves onoptical environment around turrets in-flight on AAOL-T", Optical Engineering, 57(6),064107, June 2018.[7] Dennis, D. J. C. and Nickels, T. B., “Experimental measurement of large-scale threedimensional structures in a turbulent boundary layer. Part 1. Vortex packets,” Journal ofFluid Mechanics, Vol. 673, 2011, pp. 180–217.[8] W.R. Burns, E.J. Jumper and S. Gordeyev, " A Latency-Tolerant Architecture for AirborneAdaptive Optic Systems ", AIAA Paper 2015-0679, 2015.[9] S. Gordeyev, A. E. Smith, J.A. Cress and E.J. Jumper, " Experimental studies of aero-opticalproperties of subsonic turbulent boundary layers", Journal of Fluid Mechanics, 740, pp. 214253, 2014.[10] ] S. Gordeyev, J.A. Cress, A Smith and E.J. Jumper, " Aero-optical measurements in asubsonic, turbulent boundary layer with non-adiabatic walls", Physics of Fluids, 27, 045110,2015.[11] S. Gordeyev, A.E. Smith, T Saxton-Fox and B. McKeon, " Studies of the large-scalestructure in adiabatic and moderately-wall-heated subsonic boundary layers ", Paper 7A-3,9th International Symposium on Turbulence and Shear Flow Phenomena (TSFP-9), 2015.[12] M.R. Kemnetz and S. Gordeyev, “Optical Investigation of Large-Scale Boundary-LayerStructures,” AIAA Paper 2016-1460, 2016.[13] Mathews E., Wang K., Wang M., and Jumper E.J., "A Spectral Description of Aero-OpticalPhase Distortions and the Effects of Turbulent Flow Scales," AIAA Aviation Meeting, 2017.18
Appendix A -- Final Report 2016Airborne Aero-Optical Laboratory - TransonicFA9550-13-1-0001Eric J. JumperProfessor, University of Notre DameDepartment of Aerospace and Mechanical EngineeringUniversity of Notre DameNotre Dame, IN 465563 October, 20161
AbstractThis report covers the third year of the Airborne Aero-Optics Laboratory-Transonic (AAOLT) program. Aero-optics severely limits an airborne directed-energy system’s lethal field of regard;aero-optics refers to the deleterious effect that the density fluctuations in the flow have on anairborne optical system. The AAOL-T program studies aero-optical aberration problems fromexperimental, theoretical and computational approaches; the most unique part of the program is thatwe also perform flight tests using Falcon 10’s, capable of testing at greater than Mach 0.8. Theprogram makes use of two aircraft, one to project a small-aperture, diverging beam toward anoptical turret on the second, laboratory aircraft. The third year of the program has been productivewith thirty-one flights flown in support of both the baseline program and to support AFRL/DARPA40% ABC Turret testing, of which 5 flights plus seven at the end of September 2014 were under thebaseline program. During the baseline program, extensive measurements of aero-opticalenvironment around both hemisphere-on-cylinder and hemisphere-only turrets were performed forMach range between 0.5 and 0.8. Fluidic environment was also studied in-flight by collectingsimultaneous unsteady pressure data over an array of pressure sensors on the surface of these turretsfor Mach between 0.5 and 0.8. In addition to collecting the aero-optical data in flight, the baselinedata was used in a wide range of analysis of these data and using the data to explore advancedtechniques in adaptive optics. The report describes mainly analysis of data and the computationalwork done in year three of the program.2
Airborne Aero-Optics Laboratory-Transonic (AAOL-T) Progress ReportI. INTRODUCTIONThis report covers the third year of the Airborne Aero-Optics Laboratory-Transonic (AAOLT) Program. The partners in the program are Notre Dame, the Air Force Institute of Technologyand MZA. Aero-optics severely limits an airborne directed-energy system’s lethal field of regard;in its most restrictive definition, aero-optics refers to the deleterious effect that the densityfluctuations in the flow over the exit or receiving pupil have on an airborne optical system, thus thename “aero-optics.” Except for some wavefront gathering on the AirBorne Laser, ABL, near theend of its program to assess aero-optic scaling laws, the AAOL [1] and present AAOL-T programsare the only programs to collect high-quality, aero-optically-aberrated wavefront data in flight[2,3,4]. Both programs deal with aero effects on the optical beam control systems of airborneoptical systems. Because AAOL-T is a continuation of AAOL many of the original objectives ofthe AAOL program are also part of the objectives of the present AAOL-T program. The AAOL-Tprogram continues to include Aero-Optics as its primary focus but now at higher Mach numbers [5];however, the new program has additional objectives that were not part of AAOL: these specificallyinclude aero-mechanical studies, more emphasis on mitigation approaches that include adaptiveoptics, and specific emphasis on support of other programs. In the year-one annual report, wereported on approaches in understanding unsteady pressure data collected on the Cessna Citationversion of the AAOL continued from the end of the AAOL program into the AAOL-T program. Aswill be described below, in our first safety-of-flight campaign using the new (Falcon 10) aircraft weflew the same pressure turret used in the Citation in conjunction with our first safety-of-flightcampaign in February 2014. Also, our support of flight tests for the AFRL/DARPA 40% scaleABC turret began in year-two and is continuing as the report is being written.Like the AAOL program, AAOL-T program makes use of two aircraft, one to project asmall-aperture, diverging beam toward an optical turret on the second, laboratory aircraft. The titleof the present grant ends with the word “Transonic;” and required that the program migrate from theCessna Citation Bravos, which were limited to Mach 0.7, to the Falcon 10 that can cruise aboveMach 0.8. By February 2014, all of the modifications of the new Falcon 10 were complete and bothbaseline aero-optic data and unsteady pressure data have been taken and analyzed; our high-fidelityCFD effort has also continued. As in year two, this year has also been productive in producingjournal articles and meeting papers.The laboratory Falcon 10 is owned by Notre Dame and was donated to the program by Mr.Matthew McDevitt. At least in the near term, a video of the Notre Dame open house for the AAOLT can be viewed at: onation-enables-researchat-transonic-speeds/ .II. AAOL-T FLIGHT-TESTSIn a standard data-acquisition flight test, two Falcon 10s fly in formation at a nominal 50 mseparation as shown in Figure 1. A diverging small-aperture 0.532 µm laser is directed from thesource aircraft to the turret on the laboratory aircraft, diverging to over fill the turret aperture.1
Figure 1. Formation flight with nominal 50 m separation showing diverging source beam emanatingfrom the source aircraft and overfilling turret aperture on laboratory aircraftFigure 2. View from inside the source aircraft.The baseline AAOL turret can be configured as either a hemisphere, a hemisphere with acylindrical base, a spherically-conformal window, a flat window and some geometry changes at thebase of the turret. All of these configurations were flown in the previous program at Mach numbersless than Mach 0.7
of the Airborne Aero-Optics Laboratory-Transonic (AAOL-T) program, whose first three years were under an AFOSR grant. Aero-optics severely limits an airborne directed-energy system's . track PDS and FSM systems and then to the various instruments. In the lower right corner of Figure 3 there is a schematic shown a setup used to gather .