Transcription
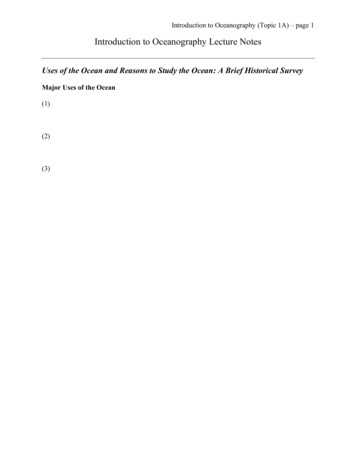
Notes on the Oceanographyof d’Iberville FiordR. A. LAKE and E. R. WALKER]ABSTRACT. The oceanography of a smallarctic fiord has been studied over aperiod of three years. The shallow water structure is determined by convection inthe fiord, asisshown by temperature-time series and budget studies. The fiordcontains temperature inversions at shallow depths which have been present inobservations over several years. The deeper water structure is determined by thesill across the fiord mouth and similar sills in Nansen Sound which restrict freeaccess at depth of water layers from theArctic Ocean.RkSUMk. Notes sur l‘octanographie du fjord d’lberville. Les auteurs ont CtudiCl’oc6anographie d‘un petit fjord arctique pendant trois ans. Comme le montrent lessCries tempbature-temps et les Ctudes de bilan, la structure de l’eau peu profondeest dCtermin6e par la convection B I’intCrieur du fjord. Celui-ci montre des inversionsde temp6rature B faible profondeur qui sont prksentes dans les observations portantsur plusiews annCes. La structure del’eau en profondeur est dCterminCe par le seuilB travers l’entrh du fjord et par les seuils semblables dans le dCtroit de Nansen, quirkduisent le libre accBs des couches d‘eau profondes de l’ocbn Arctique.INTRODUCTIONA number of papers have been written on the overall oceanographic features ofthe Canadian Archipelago(Collin 1963; Collin andDunbar1964;Pelletier1966), whereas others have dealt in more detail with particular regions (Barber1968, Ford and Hattersley-Smith 1965; Keys et al. 1969). This paper is in thelatter category, describing oceanographic features of d’Iberville Fiord (Fig. 1).D’Iberville Fiord, an appendage to the Nansen Sound - Greely Fiord system, isapproximately 35 km. in length and 6 km. in width, having an area of 213 km.*Soundings show that the fiord has a sill extending across its mouth with a maximum depth of 330 m. while the maximum depth in the fiord is 560 m. The fiordwas probably subject to glacial over-deepening during the Pleistocene period asdescribed by Pelletier (1962).One tongue of the large glacier capping the Victoria and Albert Mountainsterminates at the head of the fiord. During the summer icebergs calvingfrom thisglacier make their way down d’lberville Fiord provided that the sea-ice cover is1FrozenSea Research Group, Marine Sciences Directorate, Pacific Region, Departmentof the Environment, Canada.
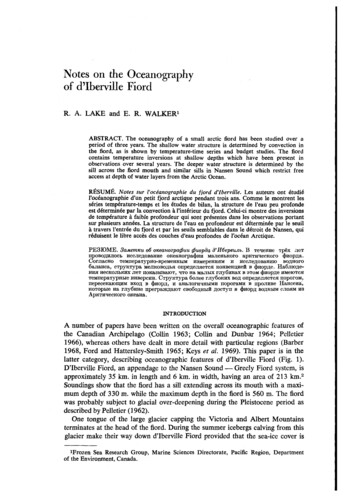
OCEANOGRAPHY OF D'IBERVILLE FIORD223FIG. 1. DIbervilleFiord, Ellesmere Island,N.W.T. Experimentalsites spring 1969, 1970,1971 and summer 1969,1970. Summer sites arethe two closest to thenorth shore.A 196919700 1971sufficiently removed. In 1969 and 1971 the fiord was ice free, except for manyicebergs, during the entire month of August. In the summer of 1970 the fiordremained covered with sea ice and the icebergs were retained at the head of thefiord. The depth of fresh water laid down on the fiord from summer runoff in ayear of average precipitation is about 1.0 m. This amount is estimated from theaverage precipitation overthe fiord drainage area with allowance for evaporation.We estimate that as much as one third of this fresh water input can be derivedfrom icebergs melting inthe fiord, in a quantity varying from year to year.Oceanographic observation periods included March and April in 1969, 1970,and 1971, and August and September in 1969 and 1970. Most of the spring andall of the summer data were collected within 3 km. of the base. During the springtrips additional information was collected at various points along the length ofthe fiord.Observations were made of the salinity and temperature of the water, sea icethickness and growth rates, currents, tides and meteorology. In spring seasons aGuildline C.T.D. in situ instrument providedconductivity, temperature andpressure information from which salinity, density and depth were derived. Thecalibration of this instrument was checked periodically with water sample bottlesand thermistors. Observations were taken at depth intervals of 1 m. in 1969; in1970 and 1971 this interval wasdecreased to 0.25 m. above 30 m. Accuracyvaried from operation to operation but in all, absolute accuracy in salinity andtemperature lies within manufacturer's specifications of k .04%0and 2 0.02OC.respectively. Pressure readings agreed closely with metered cable lengths.In summer field seasons bottle samples provided salinity data and were taken in shallowdepths close to shore. In both 1969 periods and in spring 1970 temperature dataover a period of time were taken from an array of thermistors suspended from theice or, in the case of August 1969, suspended from a buoy just below the watersurface. The details of the methods used in obtaining the thermistor data havebeen reported by Lewis and Walker (1970). The thermistor data from the arrayshave an absolute accuracyof the order of 0.01OC.It was determined that currents to a 2-m. depth were below the 5-cm. sec.-lthreshold of the instrument available. Currents were estimated from dye plumesbut were limited to the first 2 m. beneath the ice sheet. Velocities in this region
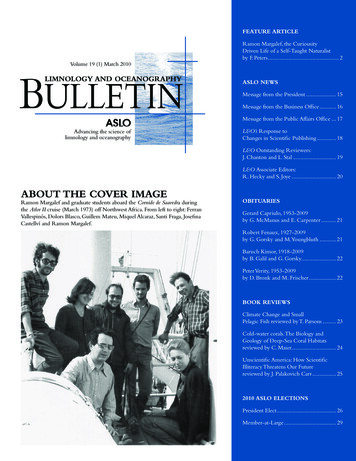
224OCEANOGRAPHY OF D'IBERVILLE FIORD1-2. Temperature,salinity curves to 300 and500 m., d'Iberville Fiord.April 1969, March 1970,March 197 1 and ArcticOcean ERATURE-1.51969-.*.1970I0u28323430"C-SALINITY1971 "io.A R C TOI CC E A Nranged from 0 to 3.5 cm. sec.-l. The scatter of velocities was too great to permitmeasurement of velocity profiles.From the summer of 1969 onward tide measurements weremade by diaphragm-operated Ottbororecorders off the beach adjacentto the base camp. Measurements of ice thickness and growth rates were madeduring spring field trips. Weather observations were routinely made at the base.WATER STRUCTURETemperature and salinitysamplingsduringeachspringseasonin d'IbervilleFiord are shown in Fig. 2 with a representative sounding from the Arctic Ocean(after Worthington 1959). The overall water structure is much the same fromyear to year. The temperature and salinity profiles in Fig. 2 agree closely withthe only other oceanographic stations in d'Iberville Fiord. These stations, at thehead and mouthof the fiord weretaken in May 1965 by Keys and Seibert (1969).Small scale details, not visible in Fig. 2, having a vertical extent of only a fewmetres, give an impression of extensive horizontal layering. No regular step-likeformations of temperature or salinity such as those observed by Neshyba et al.(1971) were found. As expected (Ford and Hattersley-Smith 1965, HattersleySmith and Serson 1966), the warm layer between 400 and 500 m. which existsin the Arctic Ocean off the western Archipelago (Collin 1963) is absent. Typicalwater of Atlantic origin found in the Arctic Ocean from below the surface layerto a depth of 900 m. has temperature and salinity values aboveOOC. and 34.92%0(Ostenso 1966). The water below about 250 m. in d'Iberville Fiord approachesa temperature value of 0 C. and a salinity value of 34.7%0.This difference inwater structure below 300 m. is almost certainly due to the shallowness of theshelf at the mouth of Nansen Sound (Crary and Goldstein 1957; Ford and Hattersley-Smith 1965).Above a depth of 250 m. the salinity decreases towards the surface (Fig. 2).The density is determined almost exclusively by the salinity so it is evident thaton the large scale the static stability increases upward to the isopycnic layer justbelow the ice. Small scale variations can occur in the static stability of the watermass. In the temperature plots the most outstanding feature is the warm layerwhich occurs in d'lbervilleFiord at all times above50 m.
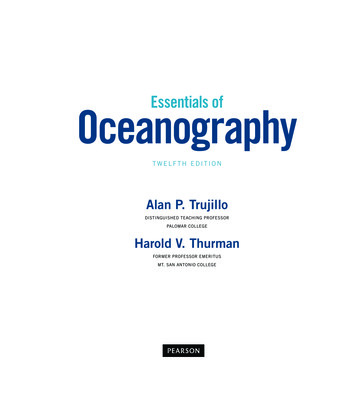
OCEANOGRAPHY OF D'IBERVILLEFIORD225A number of features which are not prominent on the temperature plots inFig. 2 proved to extend over wide areas of GreelyFiord andto be more prominentthere. These include the small feature, marked (a), appearing at a depth of 100 m.on the temperature curves. Some of the small features appearing on the 1970and 1971 temperature traces between 25 m. and 50 m., (b) and (c) for example,may be quite extensive. In a long trip down Greely Fiord in 1970 the feature (c),Fig. 2, hardly discernible in d'Iberville Fiord was continuous westward and verymuch stronger in Greely Fiord. This appears to be the same structure that attracted the attention of Ford and Hattersley-Smith (1965) in August 1962. Atthat time the warm layer extended some 100 miles from the head of TanquaryFiord. Work during 1963 and 1964, described by Hattersley-Smith and Serson(1966), confirmed that this layer also existed during the spring of those years.Evidentlythis feature has been present in observations over nine years. Thestabilityof the water structure, depending overridingly on salinity, preventsconvective dispersion of the warm layer. Molecular diffusion and a small degreeof turbulence should however be sufficientto disperse this layer in a fraction ofa period of nine years. We must conclude that the heat in the 25- to 50-m. layerisrenewed from time to time, probably annually. Ford and Hattersley-Smith(1965) suggest radiative heating as a possibility.In the spring of 1969 the isopycnic layer under the ice extended to a depth of10 m. In 1970 and 1971 this layer extended down only to 1 to 2 m. The causesof these differencesin the thickness of the isopycnic layer are complex. Causativefactors include differing amounts of ice cover in summer, wind effects in summer,variations in fresh water input and consequent variations of the estuarial circulation in the fiord. We are at present investigating the problem in detail.TEMPERATURE-TIME RECORDSTemperature-time records were obtained from strings of thermistors whichwere deployed in April and August 1969 and March to April 1970 at locationsfairly close to shore. Intensive recording at sampling intervals varying from 10seconds to 1 hour were conducted over a few days to a week of each field trip.Thermistor time constants permitted sampling that was effectively instantaneous.The thermistor strings reached from near the ice bottom to depths of 46 m. inApril 1969 and to 15 m. in April 1970. The magnitude of temperature changesobserved depends upon the mean temperature gradient at the appropriate levelinsofar as temperature changes are the result of vertical water motion.In Fig. 3 are shown brief portions of the temperature-time traces with samplingat 1-minute intervals. They are in three groups. In the upper group the tracesmade in April 1969 and April 1970 are from thermistors in the isothermal,isopycniclayerjustbelow the ice. The trace made in August 1969 is from athermistor in a fresh warm stable layer with the temperature decreasing downwards. In August 1969 open water caused very irregular temperature traces.In April 1969 small temperature variations were noted with periods of about 24hours, 8 hours, and 10 minutes. In April 1970 very little temperature variationwas notedat 2.0 m.
226OCEANOGRAPHY OF D'IBERVILLE FIORD- - APRIL,1969AUG. 1969""FIG. 3. Temperaturetime records, d'IbervilleFiord for April 1969;4,10,31 m.,August 1969;3,9,21 m.,April 1970;2,4, 10 m. See text forwater structuredescription. - - * A P R I L 1970""""C.1 . .e.1.***. L.0 .""C",""0"""I")""""/!2,TIME3(HOURS)In the middle group all thermistors were at depths where salinity, density andtemperature wereincreasing rapidly downward. In April 1969 temperaturevariations at near-tidal periods were evident. In August 1969 temperature oscillations were present at a wide range of frequencies some so high as to be unresolved by the fastest sampling rate of one reading per minute. In April 1970irregular oscillations weremarked.In the lower group all thermistors were at depths just below the temperaturemaximum with the temperatures decreasing downwards while salinity and densityincreased downwards. During April 1969 temperature variations of tidal periodswere present. During August 1969 temperature variations were irregular. In April1970 temperature oscillations at periods of 5 to 10 minutes were present.Consideration wasgiven to correlating variations of temperature with tidalcycles. The only period in which variations of near-tidal frequency were evidentin temperature records was in April 1969, but actual tidal records were notavailable for this period. In August 1969 the large variations in temperature,particularly the cooling which began during the experimental period, obscuredany easily identifiable correlation between tides and temperatures. In March toApril 1970 no correlation was evident. Perhaps this is not too surprising as thetemperature records weremade fairly close to shore where the actual watermovement may be irregular. A more subtle analysis with longer records will beundertaken in future.In the layer just above the temperature maximum in March 1970 the temperature at 3.25 m. decreased to form a marked temperature inversion, whichlasted for several hours until the former uniform gradient was re-established. Theexplanation for this record seems to be interleaving of cold and warm layers. Asimilar event occurred in April 1969. Temperatures at 7.0 m. went from temperatures typical of the isothermal layer (- 1.6"C.) to something in excess of- l.O C., then returned after 30 hours to the former cold temperatures. The smallvertical extent and rather lengthyexistence of these phenomena suggest the
227OCEANOGRAPHY OF D'IBERVILLE FIORDpresence of rather extensive horizontal, vertically thin patches.It maybe thatexchange of heat and salt with the under-ice layer is accomplished by mixing ofsuch patches.To sum up, the temperature-time records differ from year to year. In April1969 variations with tide periods were evident in the temperature records particularly in the upper layers, but were not in March to April 1970. The temperature variability below ice during winter was of course very much less than in theopen water of August 1969. The records have a completely different characterin winter from those in Cambridge Bay (Lewis and Walker 1970). The temperature and salinity-density structure is similarinupperlayersinboth locations,although the under-ice isopycnic layer is much deeperin Cambridge Bay, extending on occasion to a depth of 40 m. The temperature-time records atCambridge Bay have marked variability at frequencies of 1 to 10 cycles per hourlacking ind'Iberville Fiord.TABLE 1 . Saltchanges and rates of change, and sensible heat changesandrates of change, from 11 April 1969 to 13 August 1970 in a water column fromdepths of 1.5 m. to 35.0 m. in d'Iberville Fiord.RateI 1 April 19691969 August to 2323 August 1969Septemberto 5 19695 September 1969to 12 March 197012 March 1970I970to 13 AugustSaltGain ( )orLoss (-)gm.cm.-2cm.-2ofSalt Gain ( )Loss(-)lO-6 gm.set."Rate ofHeat Gain ( )HeatGainor Loss (-)( ) or Loss (10-3(cal. cm.-2)cal. cm-2 set.")-13.0 -13.8 4324 4.0 49.1 5.5-202-1.8-2649-1.5 2411 2.6 5.4-2.3 3.3-2.1SALT AND HEAT BUDGETSIIn Table 1 are salt and heat budgets for surface waters for the period April1969 through August 1970. These are incomplete in that only levels from 1.5 m.to 35 m. are available. The locations of observations differed. With these reservations the heat gain from April 1969 to August 1969 when the fiord was openwith very warm freshsurface water, is very large, compared to the heat gain fromspring to summer 1970. The decrease in salt inthe column springto summer 1969is large. The rate of salt gain, 23 August 1969 to 5 September 1969 must be dueto horizontal advection as ice did not form until 8 September 1969. The salt gainfrom autumn 1969 to spring 1970 is double that released by growing sea ice.A budget calculation from 5 September 1969 to 13 March 1970 indicated 800cal. cm.-2 released from cooling of sea ice, 8,200 cal. cm.-2 from ice formationand 2,600 cal. cm.-2 from cooling of the water column from 1.5 to 35.0 m. Thewater column heat loss would thus be over 30 per cent of the heat released by iceformation or double the percentage found in Cambridge Bay (Lewis and Walker1970). Again horizontal advection isindicated.
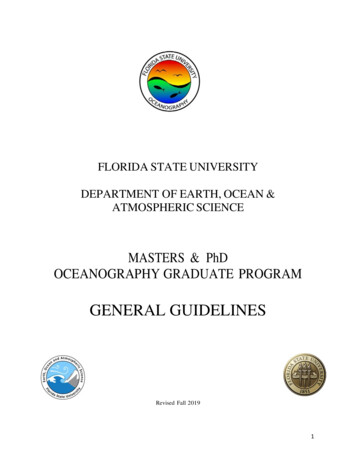
228OCEANOGRAPHY OF D'IBERVILLE FIORDTo complement heat budgets of the water columns, heat flows through theice were calculated using records from thermistors implanted in the ice and inthe snow on top of the ice. The heat flux calculations used the measured temperature gradients multiplied by values of thermal conductivity appropriate forice conditions (after Lewis 1967, Schwerdtfeger 1963) and for the measuredsnow densities (Abels'formula, Mellor 1964).In both April 1969 and April 1970 the calculations indicated near balanceof the heat flows through ice and snow, and the heat released by ice forming atthe rate we observed. While the errors maybesizable the calculations clearlyindicate that large water column heat losses are not present towards the end ofthe winter season.r6FIG. 4.WnAUG. 1969"OBSERVEDOBSERVED MAR. 1970FORECAST MAR. 1970" .301-I2I02TEMP.' .I4I8II1624SAL.%.I32Temperatureand salinity curves, to35 m. d'Iberville Fiord;observed 23 August,1969; observed 15 March,1970; and structureon15 March, 1970 forecastfrom water column on23 August, 1969, withone-dimensional heatloss, salt gain (afterZubov 1943).The seasonal change in a water column used in budget calculations is shownin Fig. 4. In comparison an energy balance calculation (Zubov 1943) using aclimatic heat loss of 16,000 cal. cm.-2 (Leahey 1966) is shown. The total heatfrom ice cooling, ice formation, and water column heat loss over the period wasabout 12,000 cal. cm.?. If this heat loss is accepted instead of the climatic loss,the calculated ice thicknesses and parameters of the under-ice layer still fail toagree withthose observed.From these calculations it is evident however that the budget of a water columnis determined by the estuarial circulation as well as the upper boundary conditionof ice formation. The large autumnal salt changes in 1969, and the late wirterbalance of heat from ice formation and heat flux upward suggest the estuarialcirculation has an annual variation, being larger in the autumn than in late winter.The isothermal, isohaline layer just below the ice bottom is undoubtedly a manifestation of the efficient transfer mechanism driven by salt release from growingice. The reason for the difference in thickness of this layer, say between spring1969 and spring 1970 is, as noted earlier, complex.REFERENCESOn the water of Tuktoyaktuk Harbour. Canada Department of Energy,9.Mines and Resources,Ottawa. MarineSciencesBranch.ManuscriptReportSeries,32 PP.*BARBER, F. G. 1968.1963. The waters of the CanadianArctic Archipelago. Proceedings,ArcticBasin Symposium, October 1962. pp. 120-28.COLLIN, A. E.J
229OCEANOGRAPHY OF D’IBERVILLE FIORDand M. J. DUNBAR. 1964. Physical oceanography in Arctic Canada. Oceanography and Marine Biology, Annual Review, 6. London: Allen and Unwin. pp. 11-46.COLLIN, A. E.P. and M. GOLDSTEIN. 1957. GeophysicalstudiesinSea Research, 4: 185-201.CRARY,A.the Arctic Ocean. Deepw. L. and G. HATTERSLEY-SMITH. 1965. On the oceanography of the NansenSoundFiord System. Arctic, 18: 158-71.FORD,and H. SERSON. 1966. Reconnaissance oceanography over the ice of theNansen Sound Fiord System. Defence Research Board of Canada, Ottawa, Directorate o fPhysical Research, Geophysics. Hazen, 28. 13 pp.HATTERSLEY-SMTH,G.E. and G. H. SEIBERT. 1969. Operation Tanquary, EllesmereIsland,N.W.T.1963-1966. Canadian Oceanographic Data Centre, 1969 Data Record Series No. 13, 1969.pp. 99-100.KEYS, J .and A. LONG. 1969. The oceanography of Disraeli Fiord,northern Ellesmere Island. Defence Research Board o f Canada, Ottawa. Defence ResearchTelecommunications Establishment,Geophysics. Hazen, 34.7 pp.KEYS, J., 0. M. JOHANNESSON1966. Heat exchange and sea ice growth in Arctic Canada. Arctic Meteorology Research Group, Dept. of Meteorology, McGill University, Montreal. Meteorology,82.48 pp.LEAHEY, D. M.1967. Heat flow through winter ice. Physics of snow and ice. Proceedingsof the International Conference on Low Temperature Sciences, 1966. Part 1. pp. 611-31.LEWIS,E.L.L. and E. R. WALKER. 1970. The waterstructure under a growing sea ice sheet.Journal of Geophysical Research, 75: 6836-45.LEWIS,E.1964. Properties of snow. CRREL Research Report169,Hanover,Hampshire, 105 pp.MELLOR, M.News., v. T. NEAL and w . DENNER. 1971. Temperatureand conductivity measurements under Ice Island T-3. Journal o f Geophysical Research, 76 (33): 8107-20.NESHYBA,1966. Arctic Ocean. In: R. W. Fairbridge, Editor, The Encyclopedia ofOceanography. New York: Van Nostrand Reinhold. pp. 49-55.OSTENSO, N. A .1962. Submarine geology program, polar continental shelf project,Isachen, District of Franklin. Canadian Geological Survey Paper No. 61-21, 10 pp.PELLETIER, B. R. 1966. Canadian ArcticArchipelago and BaffinBay. In: R. W. Fairbridge,Editor, The Encyclopedia of Oceanography. New York: VanNostrand Reinhold,pp.157-68.SCHWERDTFEGER,P. 1963.Thethermalproperties of sea ice. Journal o f Glaciology,4: 789-807.v. 1959. Oceanographicobservationsinscientific studies at Fletcher’sIce Island T-3, (1952, 1955). Geophysical Research Papers, Air Force Cambridge ResearchCenter, 1. pp. 31-35.WORTHINGTON, L.1943. Arctic Ice. Translated fromthe Russian by the U.S. Navy Oceanographic Office andthe American Meteorological Society. Published by the U.S. NavyElectronics Laboratory, San Diego. 491 pp.ZUBOV, N.N.
D'Iberville Fiord, an appendage to the Nansen Sound - Greely Fiord system, is approximately 35 km. in length and 6 km. in width, having an area of 213 km.* Soundings show that the fiord has a sill extending across its mouth with a maxi- mum depth of 330 m. while the maximum depth in the fiord is 560 m.