Transcription
Introduction ToPhysical OceanographyRobert H. StewartDepartment of OceanographyTexas A & M UniversityCopyright 2006September 2006 Edition
ii
ContentsPrefacevii1 A Voyage of Discovery1.1 Physics of the ocean1.2 Goals . . . . . . . .1.3 Organization . . . .1.4 The Big Picture . . .1.5 Further Reading . .1123352 The2.12.22.32.42.52.6Historical SettingDefinitions . . . . . . . . . . . . . . . . . . . .Eras of Oceanographic Exploration . . . . . .Milestones in the Understanding of the OceanEvolution of some Theoretical Ideas . . . . .The Role of Observations in Oceanography .Important Concepts . . . . . . . . . . . . . .788121516203 The3.13.23.33.43.53.63.7Physical SettingOcean and Seas . . . . . . . . . . .Dimensions of the ocean . . . . . .Sea-Floor Features . . . . . . . . .Measuring the Depth of the OceanSea Floor Charts and Data Sets . .Sound in the Ocean . . . . . . . .Important Concepts . . . . . . . .4 Atmospheric Influences4.1 The Earth in Space . . . . . . .4.2 Atmospheric Wind Systems . .4.3 The Planetary Boundary Layer4.4 Measurement of Wind . . . . .4.5 Calculations of Wind . . . . . .4.6 Wind Stress . . . . . . . . . . .4.7 Important Concepts . . . . . .iii.2122232529333437.3939414343464849
iv5 The5.15.25.35.45.55.65.75.85.9CONTENTSOceanic Heat BudgetThe Oceanic Heat Budget . . . . . . . . . . .Heat-Budget Terms . . . . . . . . . . . . . . .Direct Calculation of Fluxes . . . . . . . . . .Indirect Calculation of Fluxes: Bulk FormulasGlobal Data Sets for Fluxes . . . . . . . . . .Geographic Distribution of Terms . . . . . . .Meridional Heat Transport . . . . . . . . . .Variations in Solar Constant . . . . . . . . . .Important Concepts . . . . . . . . . . . . . .73. 73. 76. 79. 79. 83. 88. 92. 94. 95. 97. 100Equations of MotionDominant Forces for Ocean Dynamics . . . . . .Coordinate System . . . . . . . . . . . . . . . . .Types of Flow in the ocean . . . . . . . . . . . .Conservation of Mass and Salt . . . . . . . . . .The Total Derivative (D/Dt) . . . . . . . . . . .Momentum Equation . . . . . . . . . . . . . . . .Conservation of Mass: The Continuity EquationSolutions to the Equations of Motion . . . . . . .Important Concepts . . . . . . . . . . . . . . . 1326 Temperature, Salinity, and Density6.1 Definition of Salinity . . . . . . . . . . . . .6.2 Definition of Temperature . . . . . . . . . .6.3 Geographical Distribution . . . . . . . . . .6.4 The Oceanic Mixed Layer and Thermocline6.5 Density . . . . . . . . . . . . . . . . . . . .6.6 Measurement of Temperature . . . . . . . .6.7 Measurement of Conductivity or Salinity . .6.8 Measurement of Pressure . . . . . . . . . .6.9 Temperature and Salinity With Depth . . .6.10 Light in the Ocean and Absorption of Light6.11 Important Concepts . . . . . . . . . . . . .7 .8 Equations of Motion With Viscosity8.1 The Influence of Viscosity . . . . . .8.2 Turbulence . . . . . . . . . . . . . .8.3 Calculation of Reynolds Stress: . . .8.4 Mixing in the Ocean . . . . . . . . .8.5 Stability . . . . . . . . . . . . . . . .8.6 Important Concepts . . . . . . . . .
CONTENTSv9 Response of the Upper Ocean to Winds9.1 Inertial Motion . . . . . . . . . . . . . .9.2 Ekman Layer at the Sea Surface . . . .9.3 Ekman Mass Transport . . . . . . . . .9.4 Application of Ekman Theory . . . . . .9.5 Langmuir Circulation . . . . . . . . . .9.6 Important Concepts . . . . . . . . . . .13313313514314514714710 Geostrophic Currents10.1 Hydrostatic Equilibrium . . . . . . . . . . . .10.2 Geostrophic Equations . . . . . . . . . . . . .10.3 Surface Geostrophic Currents From Altimetry10.4 Geostrophic Currents From Hydrography . .10.5 An Example Using Hydrographic Data . . . .10.6 Comments on Geostrophic Currents . . . . .10.7 Currents From Hydrographic Sections . . . .10.8 Lagrangian Measurements of Currents . . . .10.9 Eulerian Measurements . . . . . . . . . . . .10.10Important Concepts . . . . . . . . . . . . . .15115115315515816416417117217918111 Wind Driven Ocean Circulation11.1 Sverdrup’s Theory of the Oceanic Circulation11.2 Western Boundary Currents . . . . . . . . . .11.3 Munk’s Solution . . . . . . . . . . . . . . . .11.4 Observed Circulation in the Atlantic . . . . .11.5 Important Concepts . . . . . . . . . . . . . .18318318919019219712 Vorticity in the Ocean12.1 Definitions of Vorticity . . . . .12.2 Conservation of Vorticity . . .12.3 Influence of Vorticity . . . . . .12.4 Vorticity and Ekman Pumping12.5 Important Concepts . . . . . .199199202204205210.211211212218222229232.13 Deep Circulation in the Ocean13.1 Defining the Deep Circulation . . . .13.2 Importance of the Deep Circulation .13.3 Theory for the Deep Circulation . .13.4 Observations of the Deep Circulation13.5 Antarctic Circumpolar Current . . .13.6 Important Concepts . . . . . . . . .14 Equatorial Processes23314.1 Equatorial Processes . . . . . . . . . . . . . . . . . . . . . . . . . 23414.2 El Niño . . . . . . . . . . . . . . . . . . . . . . . . . . . . . . . . 23814.3 El Niño Teleconnections . . . . . . . . . . . . . . . . . . . . . . . 246
viCONTENTS14.4 Observing El Niño . . . . . . . . . . . . . . . . . . . . . . . . . . 24814.5 Forecasting El Niño . . . . . . . . . . . . . . . . . . . . . . . . . 24914.6 Important Concepts . . . . . . . . . . . . . . . . . . . . . . . . . 25215 Numerical Models15.1 Introduction–Some Words of Caution . .15.2 Numerical Models in Oceanography . .15.3 Global Ocean Models . . . . . . . . . . .15.4 Coastal Models . . . . . . . . . . . . . .15.5 Assimilation Models . . . . . . . . . . .15.6 Coupled Ocean and Atmosphere Models15.7 Important Concepts . . . . . . . . . . .25325325525626026426626916 Ocean Waves16.1 Linear Theory of Ocean Surface Waves . . . .16.2 Nonlinear waves . . . . . . . . . . . . . . . .16.3 Waves and the Concept of a Wave Spectrum16.4 Ocean-Wave Spectra . . . . . . . . . . . . . .16.5 Wave Forecasting . . . . . . . . . . . . . . . .16.6 Measurement of Waves . . . . . . . . . . . . .16.7 Important Concepts . . . . . . . . . . . . . .27127127627728328728929117 Coastal Processes and Tides17.1 Shoaling Waves and Coastal17.2 Tsunamis . . . . . . . . . .17.3 Storm Surges . . . . . . . .17.4 Theory of Ocean Tides . . .17.5 Tidal Prediction . . . . . .17.6 Important Concepts . . . .293293297298300308312ReferencesProcesses. . . . . . . . . . . . . . . . . . . . . . . . . .313
PrefaceThis book is written for upper-division undergraduates and new graduate students in meteorology, ocean engineering, and oceanography. Because these students have a diverse background, I have emphasized ideas and concepts morethan mathematical derivations.Unlike most books, I am distributing this book for free in digital format viathe world-wide web. I am doing this for two reasons:1. Textbooks are usually out of date by the time they are published, usuallya year or two after the author finishes writing the book. Randol Larson,writing in Syllabus, states: “In my opinion, technology textbooks are awaste of natural resources. They’re out of date the moment they arepublished. Because of their short shelf life, students don’t even want tohold on to them”—(Larson, 2002). By publishing in electronic form, I canmake revisions every year, keeping the book current.2. Many students, especially in less-developed countries cannot afford thehigh cost of textbooks from the developed world. This then is a giftfrom the US National Aeronautics and Space Administration nasa to thestudents of the world.AcknowledgementsI have taught from the book for several years, and I thank the many studentsin my classes and throughout the world who have pointed out poorly writtensections, ambiguous text, conflicting notation, and other errors. I also thankProfessor Fred Schlemmer at Texas A&M Galveston who, after using the bookfor his classes, has provided extensive comments about the material.I also wish to thank many colleagues for providing figures, comments, andhelpful information. I especially wish to thank Aanderaa Instruments, KevinBartlett, Don Chambers, Gerben de Boer, Daniel Bourgault, Richard Eanes,Gregg Foti, Nevin S. Fučkar, Luiz Alexandre de Araujo Guerra, Hazel Jenkins,Judith Lean, Christian LeProvost, Brooks Martner, Nikolai Maximenko, KevinMcKone, Mike McPhaden, Pim van Meurs, Gary Mitchum, Peter Niiler, Ismael Núñez-Riboni, Alex Orsi, Mark Powell, Richard Ray, Joachim Ribbe, WillSager, David Sandwell, Sea-Bird Electronics, Achim Stoessel, David Stooksbury,Tom Whitworth, Carl Wunsch and many others.vii
viiiPREFACEOf course, I accept responsibility for all mistakes in the book. Please sendme your comments and suggestions for improvement.Figures in the book came from many sources. I particularly wish to thankLink Ji for many global maps, and colleagues at the University of Texas Centerfor Space Research. Don Johnson redrew many figures and turned sketches intofigures. Trey Morris tagged the words used in the index.I especially thank nasa’s Jet Propulsion Laboratory and the Topex/Poseidonand Jason Projects for their support of the book through contracts 960887 and1205046.Cover photograph of an island in the Maldives was taken by Jagdish Agara(copyright Corbis). Cover design is by Don Johnson.The book was produced in LATEX 2ε using TeXShop 2.03 on a dual-processorMacintosh G4 computer running OS-X 10.4. I especially wish to thank GerbenWierda for his very useful i-Installer package that made it all possible, andRichard Koch, Dirk Olmes and many others for writing the TeXShop softwarepackage. Their software is a pleasure to use. All figures were drawn in AdobeIllustrator.
Chapter 1A Voyage of DiscoveryThe role of the ocean on weather and climate is often discussed in the news.Who has not heard of El Niño and changing weather patterns, the Atlantichurricane season and storm surges? Yet, what exactly is the role of the ocean?And, why do we care?1.1Why study the Physics of the ocean?The answer depends on our interests, which devolve from our use of theocean. Three broad themes are important:1. We get food from the ocean. Hence we may be interested in processeswhich influence the sea just as farmers are interested in the weather andclimate. The ocean not only has weather such as temperature changesand currents, but the oceanic weather fertilizes the sea. The atmosphericweather seldom fertilizes fields except for the small amount of nitrogenfixed by lightning.2. We use the ocean. We build structures on the shore or just offshore. Weuse the ocean for transport. We obtain oil and gas below the ocean. And,we use the ocean for recreation, swimming, boating, fishing, surfing, anddiving. Hence we are interested in processes that influence these activities,especially waves, winds, currents, and temperature.3. The ocean influence the atmospheric weather and climate. The oceaninfluence the distribution of rainfall, droughts, floods, regional climate,and the development of storms, hurricanes, and typhoons. Hence we areinterested in air-sea interactions, especially the fluxes of heat and wateracross the sea surface, the transport of heat by the ocean, and the influenceof the ocean on climate and weather patterns.These themes influence our selection of topics to study. The topics then determine what we measure, how the measurements are made, and the geographicareas of interest. Some processes are local, such as the breaking of waves on abeach, some are regional, such as the influence of the North Pacific on Alaskan1
2CHAPTER 1. A VOYAGE OF DISCOVERYweather, and some are global, such as the influence of the ocean on changingclimate and global warming.If indeed, these reasons for the study of the ocean are important, lets begina voyage of discovery. Any voyage needs a destination. What is ours?1.2GoalsAt the most basic level, I hope you, the students who are reading this text,will become aware of some of the major conceptual schemes (or theories) thatform the foundation of physical oceanography, how they were arrived at, andwhy they are widely accepted, how oceanographers achieve order out of a random ocean, and the role of experiment in oceanography (to paraphrase Shamos,1995: p. 89).More particularly, I expect you will be able to describe physical processesinfluencing the ocean and coastal regions: the interaction of the ocean with theatmosphere, and the distribution of oceanic winds, currents, heat fluxes, andwater masses. The text emphasizes ideas rather than mathematical techniques.We will try to answer such questions as:1. What is the basis of our understanding of physics of the ocean?(a) What are the physical properties of sea water?(b) What are the important thermodynamic and dynamic processes influencing the ocean?(c) What equations describe the processes and how were they derived?(d) What approximations were used in the derivation?(e) Do the equations have useful solutions?(f) How well do the solutions describe the process? That is, what is theexperimental basis for the theories?(g) Which processes are poorly understood? Which are well understood?2. What are the sources of information about physical variables?(a)(b)(c)(d)WhatWhatWhatWhatinstruments are used for measuring each variable?are their accuracy and limitations?historic data exist?platforms are used? Satellites, ships, drifters, moorings?3. What processes are important? Some important process we will studyinclude:(a) Heat storage and transport in the ocean.(b) The exchange of heat with the atmosphere and the role of the oceanin climate.(c) Wind and thermal forcing of the surface mixed layer.(d) The wind-driven circulation including the Ekman circulation, Ekmanpumping of the deeper circulation, and upwelling.
1.3. ORGANIZATION3(e) The dynamics of ocean currents, including geostrophic currents andthe role of vorticity.(f) The formation of water types and masses.(g) The deep circulation of the ocean.(h) Equatorial dynamics, El Niño, and the role of the ocean in weather.(i) Numerical models of the circulation.(j) Waves in the ocean including surface waves, inertial oscillations,tides, and tsunamis.(k) Waves in shallow water, coastal processes, and tide predictions.4. What are a few of the major currents and water masses in the ocean, andwhat governs their distribution?1.3OrganizationBefore beginning a voyage, we usually try to learn about the places we willvisit. We look at maps and we consult travel guides. In this book, our guide willbe the papers and books published by oceanographers. We begin with a briefoverview of what is known about the ocean. We then proceed to a descriptionof the ocean basins, for the shape of the seas influences the physical processesin the water. Next, we study the external forces, wind and heat, acting onthe ocean, and the ocean’s response. As we proceed, I bring in theory andobservations as necessary.By the time we reach chapter 7, we will need to understand the equationsdescribing dynamic response of the ocean. So we consider the equations ofmotion, the influence of Earth’s rotation, and viscosity. This leads to a study ofwind-driven ocean currents, the geostrophic approximation, and the usefulnessof conservation of vorticity.Toward the end, we consider some particular examples: the deep circulation,the equatorial ocean and El Niño, and the circulation of particular areas of theocean. Next we look at the role of numerical models in describing the ocean.At the end, we study coastal processes, waves, tides, wave and tidal forecasting,tsunamis, and storm surges.1.4The Big PictureThe ocean is one part of the earth system. It mediates processes in theatmosphere by the transfers of mass, momentum, and energy through the seasurface. It receives water and dissolved substances from the land. And, it laysdown sediments that eventually become rocks on land. Hence an understandingof the ocean is important for understanding the earth as a system, especially forunderstanding important problems such as global change or global warming. Ata lower level, physical oceanography and meteorology are merging. The oceanprovides the feedback leading to slow changes in the atmosphere.As we study the ocean, I hope you will notice that we use theory, observations, and numerical models to describe ocean dynamics. Neither is sufficientby itself.
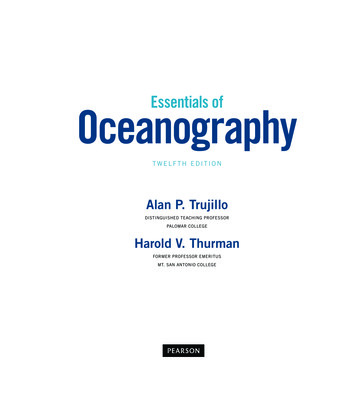
4CHAPTER 1. A VOYAGE OF DISCOVERY1. Ocean processes are nonlinear and turbulent. Yet we don’t really understand the theory of non-linear, turbulent flow in complex basins. Theoriesused to describe the ocean are much simplified approximations to reality.2. Observations are sparse in time and space. They provide a rough description of the time-averaged flow, but many processes in many regions arepoorly observed.3. Numerical models include much-more-realistic theoretical ideas, they canhelp interpolate oceanic observations in time and space, and they are usedto forecast climate change, currents, and waves. Nonetheless, the numerical equations are approximations to the continuous analytic equationsthat describe fluid flow, they contain no information about flow betweengrid points, and they cannot yet be used to describe fully the turbulentflow seen in the ocean.By combining theory and observations in numerical models we avoid some ofthe difficulties associated with each approach used separately (figure 1.1). Continued refinements of the combined approach are leading to ever-more-precisedescriptions of the ocean. The ultimate goal is to know the ocean well enoughto predict the future changes in the environment, including climate change orthe response of fisheries to over TheoryFigure 1.1 Data, numerical models, and theory are all necessary to understand the ocean.Eventually, an understanding of the ocean-atmosphere-land system will lead to predictionsof future states of the system.The combination of theory, observations, and computer models is relativelynew. Four decades of exponential growth in computing power has made available desktop computers capable of simulating important physical processes andoceanic dynamics.All of us who are involved in the sciences know that the computer has become an essential tool for research . . . scientific computation has reachedthe point where it is on a par with laboratory experiment and mathematical theory as a tool for research in science and engineering—Langer(1999).The combination of theory, observations, and computer models also impliesa new way of doing oceanography. In the past, an oceanographer would devise
1.5. FURTHER READING5a theory, collect data to test the theory, and publish the results. Now, the taskshave become so specialized that few can do it all. Few excel in theory, collectingdata, and numerical simulations. Instead, the work is done more and more byteams of scientists and engineers.1.5Further ReadingIf you know little about the ocean and oceanography, I suggest you beginby reading MacLeish’s (1989) book The Gulf Stream: Encounters With theBlue God, especially his Chapter 4 on “Reading the ocean.” In my opinion, itis the best overall, non-technical, description of how oceanographers came tounderstand the ocean.You may also benefit from reading pertinent chapters from any introductoryoceanographic textbook. Those by Gross, Pinet, or Thurman are especiallyuseful. The three texts produced by the Open University provide a slightlymore advanced treatment.Gross, M. Grant and Elizabeth Gross (1996) oceanography—A View of Earth.7th Edition. Upper Saddle River, New Jersey: Prentice Hall.MacLeish, William (1989) The Gulf Stream: Encounters With the Blue God.Boston: Houghton Mifflin Company.Pinet, Paul R. (2000) Invitation to oceanography. 2nd Edition. Sudbury, Massachusetts: Jones and Bartlett Publishers.Open University (1989a) Ocean Circulation. Oxford: Pergamon Press.Open University (1989b) Seawater: Its Composition, Properties and Behavior. Oxford: Pergamon Press.Open University (1989c) Waves, Tides and Shallow-Water Processes. Oxford: Pergamon Press.Thurman, Harold V. and Elizabeth A. Burton (2001) Introductory oceanography. 9th Edition. Upper Saddle River, New Jersey: Prentice Hall.
6CHAPTER 1. A VOYAGE OF DISCOVERY
Chapter 2The Historical SettingOur knowledge of oceanic currents, winds, waves, and tides goes back thousandsof years. Polynesian navigators traded over long distances in the Pacific as earlyas 4000 bc (Service, 1996). Pytheas explored the Atlantic from Italy to Norwayin 325 bc. Arabic traders used their knowledge of the reversing winds andcurrents in the Indian Ocean to establish trade routes to China in the MiddleAges and later to Zanzibar on the African coast. And, the connection betweentides and the sun and moon was described in the Samaveda of the Indian Vedicperiod extending from 2000 to 1400 bc (Pugh, 1987). Those oceanographerswho tend to accept as true only that which has been measured by instruments,have much to learn from those who earned their living on the ocean.Modern European knowledge of the ocean began with voyages of discovery byBartholomew Dias (1487–1488), Christopher Columbus (1492–1494), Vasco daGama (1497–1499), Ferdinand Magellan (1519–1522), and many others. Theylaid the foundation for global trade routes stretching from Spain to the Philippines in the early 16th century. The routes were based on a good workingknowledge of trade winds, the westerlies, and western boundary currents in theAtlantic and Pacific (Couper, 1983: 192–193).The early European explorers were soon followed by scientific voyages ofdiscovery led by (among many others) James Cook (1728–1779) on the Endeavour, Resolution, and Adventure, Charles Darwin (1809–1882) on the Beagle,Sir James Clark Ross and Sir John Ross who surveyed the Arctic and Antarctic regions from the Victory, the Isabella, and the Erebus, and Edward Forbes(1815–1854) who studied the vertical distribution of life in the ocean. Otherscollected oceanic observations and produced useful charts, including EdmondHalley who charted the trade winds and monsoons and Benjamin Franklin whocharted the Gulf Stream.Slow ships of the 19th and 20th centuries gave way to satellites, drifters,and autonomous instruments toward the end of the 20th century. Satellitesnow observe the ocean, air, and land. Thousands of drifters observe the uppertwo kilometers of the ocean. Data from these systems, when fed into numerical models allows the study of earth as a system. For the first time, we can7
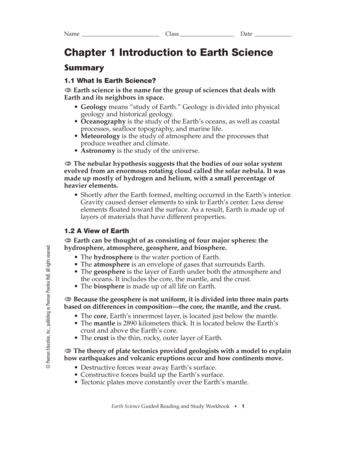
8CHAPTER 2. THE HISTORICAL SETTING60 o40 o20 o0o-20 o-40 o-60 o-60 o0o60 o120 o180 o-120 oFigure 2.1 Example from the era of deep-sea exploration: Track of H.M.S. Challengerduring the British Challenger Expedition 1872–1876. After Wust (1964).study how biological, chemical, and physical systems interact to influence ourenvironment.2.1DefinitionsThe long history of the study of the ocean has led to the development ofvarious, specialized disciplines each with its own interests and vocabulary. Themore important disciplines include:Oceanography is the study of the ocean, with emphasis on its character asan environment. The goal is to obtain a description sufficiently quantitative tobe used for predicting the future with some certainty.Geophysics is the study of the physics of the Earth.Physical Oceanography is the study of physical properties and dynamics ofthe ocean. The primary interests are the interaction of the ocean with the atmosphere, the oceanic heat budget, water mass formation, currents, and coastaldynamics. Physical Oceanography is considered by many to be a subdisciplineof geophysics.Geophysical Fluid Dynamics is the study of the dynamics of fluid motion onscales influenced by the rotation of the Earth. Meteorology and oceanographyuse geophysical fluid dynamics to calculate planetary flow fields.Hydrography is the preparation of nautical charts, including charts of oceandepths, currents, internal density field of the ocean, and tides.Earth-system Science is the study of earth as a single system comprisingmany interacting subsystems including the ocean, atmosphere, cryosphere, andbiosphere, and changes in these systems due to human activity.2.2Eras of Oceanographic ExplorationThe exploration of the sea can be divided, somewhat arbitrarily, into variouseras (Wust, 1964). I have extended his divisions through the end of the 20thcentury.
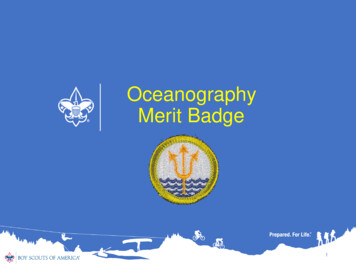
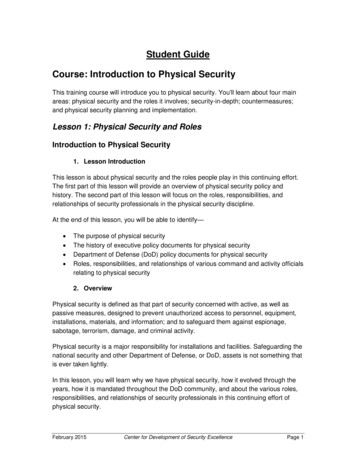
2.2. ERAS OF OCEANOGRAPHIC EXPLORATION960 o40 o20 oXIIXIVXII0oXIXXIVIIVI-20 oVIIIIIV-40 oIStationsIIIAnchoredStationsV-60 oMeteor1925–1927-80 o-60 o-40 o-20 o0o20 o40 oFigure 2.2 Example of a survey from the era of national systematic surveys. Track of theR/V Meteor during the German Meteor Expedition. Redrawn from Wust (1964).1. Era of Surface Oceanography: Earliest times to 1873. The era is characterized by systematic collection of mariners’ observations of winds, currents,waves, temperature, and other phenomena observable from the deck ofsailing ships. Notable examples include Halley’s charts of the trade winds,Franklin’s map of the Gulf Stream, and Matthew Fontaine Maury’s Physical Geography of the Sea.2. Era of Deep-Sea Exploration: 1873–1914. Characterized by a few, wideranging oceanographic expeditions to survey surface and subsurface condi-
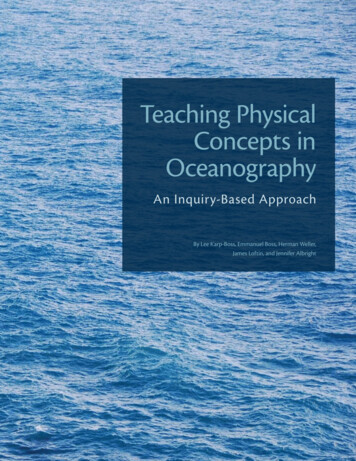
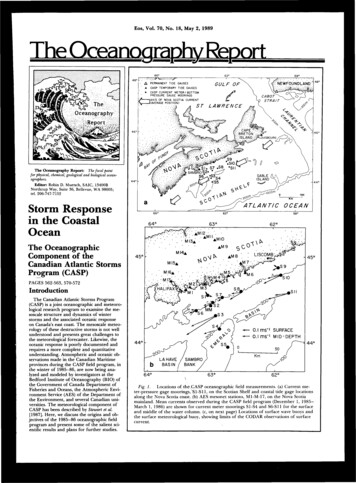
10CHAPTER 2. THE HISTORICAL SETTING60 o40 o20 o0o-20 o-40 o-100 o-80 o-60 o-40 o-20 o0o20 oFigure 2.3 Example from the era of new methods. The cruises of the R/V Atlantis out ofWoods Hole Oceanographic Institution. After Wust (1964).tions, especially near colonial claims. The major example is the ChallengerExpedition (figure 2.1), but also the Gazelle and Fram Expeditions.3. Era of National Systematic Surveys: 1925–1940. Characterized by detailedsurveys of colonial areas. Examples include Meteor surveys of the Atlantic(figure 2.2), and the Discovery Expeditions.4. Era of New Methods: 1947–1956. Characterized by long surveys usingnew instruments (figure 2.3). Examples include seismic surveys of theAtlantic by Vema leading to Heezen’s maps of the sea floor.5. Era of International Cooperation: 1957–1978. Characterized by multinational surveys of ocean and studies of oceanic processes. Examples includethe Atlantic Polar Front Program, the norpac cruises, the InternationalGeophysical Year cruises, and the International Decade of Ocean Exploration (figure 2.4). Multiship studies of oceanic processes include mode,polymode, norpax, and jasin experiments.
2.2. ERAS OF OCEANOGRAPHIC EXPLORATION1160 oDiscovDiscoveryeryIIIIery IIDiscov40 oCrawfordChainDiscovery IIAtlantisDiscovery IIAtlantis20 d-20 oCrawfordAtlantis-40oCapt. CanepaAtlanticI.G.Y.Program1957–1959Capt. Canepa-60 o-80 o-60 o-40 o-20 o-0 o20 o40 oFigure 2.4 Example from the era of international cooperation . Sections measured by theInternational Geophysical Year Atlantic Program 1957-1959. After Wust (1964).6. Era of Satellites: 1978–1995. Characterized by global surveys of oceanicprocesses from space. Examples include Seasat, noaa 6–10, nimbus–7,Geosat, Topex/Poseidon, and ers–1 & 2.7. Era of Earth System Science: 1995– Characterized by global studies ofthe interaction of biological, chemical, and physical processes in the oceanand atmosphere and on land using in situ (which means from measurements made in the water) and space data in numerical models. Oceanicexamples include the World Ocean Circulation Experiment (woce) (fig-
12CHAPTER 2. THE HISTORICAL SETTINGIndianAtlantic80Pacifico1160 o240 o3452220 o200o6789-20 o118 16115 147N1341017-40 o-8028N 9N316 1731568S7S20 o181921611S11231221S4-80 o -40 o 0 o-60 o2252632728 8 9 10 11 134293014 15510209SS4S4o60 o 1001214S140 oo717o180 o -140 o -100Committed/completedFigure 2.5 World Ocean Circulation Experiment: Tracks of research ships making a one-timeglobal survey of the ocean of the world. From World Ocean Circulation Experiment.ure 2.5) and Topex/Poseidon (figure 2.6), the Joint Global Ocean FluxStudy (jgofs), the Global Ocean Data Assimilation Experiment (godae,and the SeaWiFS, Aqua, and Terra satellites.2.3Milestones in the Understanding of the OceanWhat have all these programs and expeditions taught us about the ocean?Let’s look at some milestones in our ever increasing understanding of the ocean60 o40 o20 o0o-20 o-40 o-60 o120 o160 o180 o-160 o-120 o-80 o-40 oFigure 2.6 Example from the era of satellites. Topex/Poseidon tracks in the PacificOcean during a 10-day
form the foundation of physical oceanography, how they were arrived at, and why they are widely accepted, how oceanographers achieve order out of a ran-dom ocean, and the role of experiment in oceanography (to paraphrase Shamos, 1995: p. 89). More particularly, I expect you wil