Transcription
Physical OceanographyIESO Preparation Material
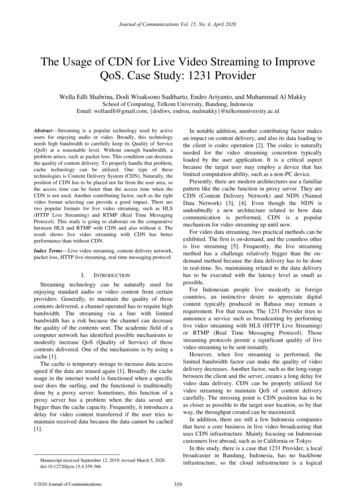
PHYSICAL OCEANOGRAPHYbyTor GammelsrødFebruary - March 2001.Revised 2002.Revised 2003.The material is collected from different sources. The most important are:Garrison,T: “OCEANOGRAPHY. An Invitation to Ocean Sciences.1996. (Wadsford)Hartmann, D.L. Global Physical Climatology. Academic Press 1994Hayes and Laevastu: "Fisheries Oceanography and ecology" (Farnham)Pickard and Emery: "Descriptive physical oceanography". 1970 (Pergamon)Pinet, P.R. “Invitation to Oceanography” Jones and Barlett, 1998Pond and Pickard: "Introductory Dynamical Oceanography". 1983 (Pergamon)Bakun: Patterns in the Ocean. Ocean processes and marine population dynamics.1996 (California Sea Grant/CIB)Segar, D.A. Introduction to Ocean Sciences. Wadsworth, 1997Stowe, K.: Essentials of Ocean Science, John Wiley & Sons 1987Tomczac, M.& S.Godfrey: Regional Oceanography,An Introduction. Pergamon, 1993se also: http://gaea.es.flinders.edu.au/ mattom/IntroOc/The Open University/Pergamon press:Ocean CirculationWaves, Tides and shallow water processes.http://gaea.es.flinders.edu.au/ mattom/IntroOc/
1TABLE OF CONTENTS1.HOW EVERYTHING IS DRIVEN. . . . 22.STATICS3.GLOBAL T AND S DISTRIBUTIONS. . . 9Light, oxygen and nutrient profiles. . .164.DYNAMICS (Ocean currents). . .18Horizontal and vertical currents. . . 18Convergence and divergence . . . . 19Forces driving the ocean currents. . . . 19(Ocean at rest) . . . . 5Hydrostatic pressure and pressure force . . 21Coriolis force. . . . .23Geostrophic currents. . . . 25Friction. . . . .27Wind driven currents. . .275.WAVES. . . . . . 34Superposition . . . . . . 35Deep (short) and shallow (long) water waves. 35Energy spectrum. . . .36Internal waves. . . . . 37Langmuir Circulation6. TIDES. . . . .38. . . . . . .397. THE BENGUELA SYSTEM. . . .45Upwelling cells. . . . .50Benguela Niños. . . . 538. ENVIRONMENTAL CONDITIONS AND FISHERIES.54Global variations and climate . 54Micro-scale environmental window. . .55Ocean triads . . . . . . 59Other environmental-fish relationships. . .61River run-off . .61Tides .62
21.HOW EVERYTHING IS DRIVENThe basic for all life on the earth is the sun. Also all winds and currents except for thetides) are indirectly driven by the sun. The fact that the radiation from the sun not isevenly distributed by latitude, time (annual and diurnal) gives rise to a variety ofmotions and processes.Fig.1.1 indicates the average radiation balance over the globe as a whole. Theincoming solar radiation, which at the top of the atmosphere in average is 341W/m2 isset to 100 units. Some of the short-wave (visible) radiation from the sun is reflectedfrom clouds and the surface of the earth. The reflection properties of the surface mayvary and is called albedo. The white snow and desert sand has a high albedo, whileblack soil has a low albedo. Note that only a small fraction of solar radiation isabsorbed in the atmosphere. The sun is warming up the ground, which in turn warmsthe atmosphere. If we did not have the atmosphere, the surface of the earth wouldhave an average temperature of -19 C, in contrast to the present average temperatureof about 13 C. This is because the ability of the atmosphere to absorb long waveradiation (infrared) from the surface of the earth. This is called the greenhouse effect.(Do you know two important greenhouse gases?) The variation of the solar radiationversus time and latitude is illustrated in Fig. 1.2 a and b.Fig.1.3 shows how the radiation imbalance is distributed versus latitude. As aconsequence, heat must be transported pole-wards by the atmosphere and the ocean.How the atmospheric circulation is organised is illustrated in Fig. 1.4.Fig.1.1 Radiation balance for the atmospheric atmosphere. 100 340 W/m2 (FromGill, 1982)
3Fig.1.2 a Contour graph of the daily average insolation at the top of the atmosphere asa function of season and latitude. The contour interval is 50 W m-2 . The heavy dashedline indicates the latitude of the sub-solar point at noon.Fig.1.2 b Annual mean and solstice insolation as a function of latitude
4Fig.1.3 Averaged radiation flux by latitude, calculated from satellite data over theperiod 1974 – 1978. The latitude scale simulates the amount of surface area betweenlatitude bands. Incoming radiation is the shortwave solar radiation absorbed by theearth and atmosphere. Outgoing radiation is the longwave radiation leaving theatmosphere.Fig.1.4 Sketch of the general atmospheric circulation, composed of direct (Hadley)and indirect (Ferrel) cells in the meridional direction and of alternating winds in thezonal direction.
52.STATICS(Ocean at rest)We consider 1 litre of water from the tab. The mass is about 1 kg.Density (ρ) is defined as mass per volume:[kg/m3]ρ mass/volumeWe heat the water in our 1 litre tank. If we heat the water the volume of the water willincrease, while the mass is conserved. Thus the density is decreasing.It makes a different if we heat the tank from above, or from below. Heating it frombelow will induce a convection and therefore vertical mixing, so the temperature willnot vary with depth. But if we heat from above, the top layer will be less dense, andtherefore it may stay put at the surface. In this case we will have a temperaturestratification (variation with depth). The region where the temperature stratification ismaximum is called the thermocline.zHeating fromaboveThermoclinezHeating frombelowPycnoclineTemperature (T)density (ρ)Fig. 2.1 Temperature in a tank of water heated from below or from above. Thecorresponding density profile if heated from below is seen on the right hand side. Themaximum downward increase on density is called the pycnocline. What does thedensity stratification look like in the case where it is heated from below?We may also cool the water in our tank. It is possible to create a temperature (andtherefore density) stratification by cooling as well. How?As you know the water in the ocean is saline. So if we add some salt in our tank, andlet it dissolve, the density of the water will increase. A salinity and density
6stratification is obtained if we put the salt into the bottom of the tank and let itdissolve there.If we dissolve 35g salt into the 1 kg of fresh water in the tank the concentration of saltwill be 35g/kg or 35g/1000g 35/1000 35 per mille 35·10-3Usually we say that the salinity in this case is 35 psu (Practical Salinity Units)What is the density of he ocean water?Of course this will vary with T and S, a few values are given in Table 2.I.For convenience a quantity called σt is introduced:σt ρ –1000 [kg/m3]Density at atmospheric pressure for some temperatures and --------------------------Table IStability.If σt increases with depth, we say that the stratification is stable.σt decreases with depth: unstableσt constant with depth: neutral or indifferentIn the stable case a vertically displaced particle is forced back towards its initialposition (Archimedes' principle). This explains how internal waves may occur in theocean.As a measure of stability we use σt/ zAtmospheric processes which may influence the density:Evaporation/precipitationcooling/heating
7Exercise 2.1 T – S diagram.a) Table II shows temperature and salinity observations from a hydrographicalstation. Plot the vertical profiles of temperature and salinity.b) Fig. 2.2 shows a diagram where the isopycnal σt is marked. Based on the valuesshown on the Figure you may also draw the lines for σt 25, 26, 27 and 28.c) Plot the pair of T,S values from each depth in Table II on the T-S diagram anddraw a line to connect the points.d) Use the T-S diagram to roughly estimate the density at the different depths, andplot the density profile.e) Discuss the stability of the water column, at which depth is the stratification moststable? Least stable?f) We will now see what happens if we mix two water masses of different origin: If awater-mass m1 with temperature T1 and salinity S1mixes with a water mass m2with temperature T2 and salinity S2 the temperature T and the salinity S of themixture is given by:T (m1T1 m2T2)/(m1 m2)S (m1S1 m2S2)/(m1 m2)A water mass with temperature 2 C and salinity 35 mixes with another water masswith temperature 8.7 C and salinity 36. Calculate the T and S values of the mixtures ifthey mix in the ratio1:2, 1:1 and 2:1. Plot the “parent” water masses and the values forthe different mixtures on the T-S diagram. Compare the density of the mixturescompared to the original water masses.Table IIDepthmetersTemperature 7200734.1300634.2400534.2
8Fig.2.2 T-S diagram.
93.GLOBAL T AND S DISTRIBUTIONSConsidering what we know about the radiation distribution, it is not surprising that theSea Surface Temperature (SST) is distributed with latitude as demonstrated in Fig.3.1. Note that SST in the Polar Regions is lower than 0 C, the freezing point of freshwater. This is possible because the freezing point of seawater with a salinity of 34 psuis about –1.9 C.Fig.3.1 Variation with latitude of surface temperature, salinity and density (σt )average for all oceans.Fig.3.2. Plot of evaporation E and precipitation P as a function of latitude. Thedifference (E-P) and the surface salinity is given in the lower graph.
10The Sea Surface Salinity (SSS) has a more complicated structure, showing a localminimum just north of the Equator. However, this structure in salinity does notchange the appearance of the density distribution (σt ). The SSS structure may beexplained by studying the distribution of precipitation and evaporation, see Fig.3.2.Temperature 0Depth500Low LatitudesMid LatitudesHigh LatitudesFig.3.3 Typical vertical temperature profiles in the ocean. Note the deep mixed layerand strong thermocline at low latitudes. The seasonal thermocline is apparent at MidLatitudes. In Polar Regions T is low at the surface, and does not vary much withdepth.Typical profiles of salinity are shown in Fig. 3.4. Try to identify at which latitudes thedifferent curves belong.
11Salinity320 33 34 35 36 37 Exercise:Label thecurvescorrectly:1000mDepthHigh ?LatitudeLow?Equator ?“Fig. 3.4 Typical mean salinity profiles in the ocean.Exercise: Which atmospheric processes tend to decrease the stability in the ocean?In Fig.3.5 typical vertical profiles of density are shown. Note that the stability is verylow at high latitudes. This means that deep- and bottom water is formed in PolarRegions. This is in fact a very important driving mechanism of the global circulation;it is called the thermo-haline circulation.Fig.3.5 Typical density - depth profiles at low and high latitude.
12An illustration of the growth and decay of the seasonal thermocline from weather shipstation MIKE (66 N, E) is shown in Fig.3.6. We note how the amplitude of thetemperature signal decreases and is delayed with depth.Fig.3.6a. Monthly averages of temperature at different levels at MIKEFig 3.6b. Same as a) but as an isopleth diagram
13Fig.3.6c Same as b) but the average temperature profile subtracted.Fig. 3.7 shows the global distribution of SST in August and February. Notethe shift in the maximum temperatures with season. Also note the local temperatureminimum near Equator in the Eastern Pacific. Namibia seems to be a harsh area, asSST along the coast remains low even in February.The mean SSS is shown in Fig.3.8. Note the salinity maxima away fromEquator. Why is the salinity so low in the Bay of Guinea? Where do you find theabsolute maximum SSS?Vertical N-S sections of T, S and O2 are shown in Fig.3.9. Note how the dense waterformed in the Arctic is flowing southwards as a deep current, characterized by anoxygen maximum. The water formed in the Antarctic is even denser, underlying thewater from the north.
14Fig.3.7 Sea Surface Temperature (SST) for August and FebruaryFig.3.8 Sea Surface Salinity (SSS) of the oceans in August
15Fig. 3.9 A section through the western basins of the Atlantic Ocean. a) Temperature( C) b) Salinity , c) oxygen (ml/l). AABW: Antarctic Bottom water, AAIW:Antarctic Intermediate Water, NADW: North Atlantic Deep Water originating fromthe Labrador Sea (LS) or the Greenland Sea (GS) or containing a contribution ofEurafrican Mediterranean Water (EMW).
16Light, oxygen and nutrient profilesWe will finish this chapter by having a short look at the absorption of light, and thevertical distribution of oxygen and nutrients in the ocean.About 50% of the incoming visible light is absorbed in the upper meter of the ocean,see Fig.3.1020406080100Energy (%)010Depth (m)20304050Fig.3.10 Percentage of solar radiation energy reaching different depths (pure water)Typical profiles of oxygen and nutrients are shown in Fig. 3.11. Note the nutrientdepletion in the surface layer, and the O2 minimum below.
17Fig.3.11. Plots of nutrient and oxygen concentration as a function of depth for theNorth Pacific off Southern California. The effect of the plants depleting the nutrientsand enriching the oxygen in the surface waters is clearly displayed. Also, the oxygenminimum region testifies to the animal activity there.
184. DYNAMICS(Ocean currents)Horizontal and vertical currentsLet us as consider a model of the ocean as a rectangular basin (Fig.4.1). The typicalwidth of the ocean L 1000km, and a typical depth D 1km.z huDwx2LFig.4.1. Model of an ocean basinIf we measure currents in the ocean, we find that a typical velocity would beu 10cm/s, but stronger currents up to 1m/s is occasionally found in the upper layer,while deep currents seldom exceed 1 cm/s.What is the typical vertical velocity?From continuity considerations (Fig.4.1) we note thatu·D w·Lsow u·D/L u·10-3 10-2 cm/sTherefore: Ocean currents are mainly horizontal. Vertical velocities are weak, but stillvery important for biological production. (Why?)
19Convergence and divergenceVertical velocities are usually associated with convergence or divergence, see Fig.4.2ConvergenceDivergencetop viewside viewDownwellingUpwellingFig. 4.2. Downwelling is associated with convergence, and upwelling by divergenceForces driving the ocean currentsCurrents in the ocean obey Newtons 1st and 2nd law of motion:Newtons 2nd law:The sum of forces ( K ) acting on a body with mass m gives an acceleration ( a )according to the formula:K ma
20Newtons 1st law: If the sum of forces is zero;K 0Then the motion will continue at a constant speed and direction ( v const. )For the large scale ocean currents the acceleration is usually small, so the sum offorces add up to zero ( K 0 ).Important forces are:Pressure force:PFriction:FFriction is due to turbulence. Friction only occureswhen the water is moving. No motion; no friction. (Secondaryforce)CoriolisCDue to the rotation of the earth. No motion no Coriolisforce. (Secondary force)Only vertical component. g 9.81m/s2g gkGravitySo in the ocean we usually haveP F C 0PCFFig. 4.3. Illustrating the balance between 3 forces.As the currents are mainly horizontal, these are horizontal forces.
21Hydrostatic pressure and pressure forcePressure mean force per unit area. It may be calculated as follows: Consider a columnof water with density ρ , heigth h and area A. See Fig.4.4AhρFig. 4.4 Concidering a column of waterThe weight of the water column is mass x gravity: mgThe mass is m ρhAso the weight becomes ρhAgSo this is the force due to the weight of the water at depth hAs pressure (p) is the force per unit area, it may be calculated as:p ρhgThis is called the hydrostatic equation and is used to calculate the hydrostaticpressure.Pressure forces arise when the pressure varies horizontally. Let us go back to theocean basin, Fig.4.1, and consider the pressure at the horizontal bottom when thesurface is tilting:The pressure at the bottom in the centre (x L) is:p(x L) ρgDwhile the pressure at western coast p(x 0) isp(x 0) ρg(D h)
22Thus the difference in the pressure over the distance L is p p(x 0) – p(x L) ρg(D h) – ρgD ρg hand the pressure gradient is (defining L x): p/ x (p(x L) – p(x 0))/L ρg h/ x.The water is pushed from high pressure to low pressure and the pressure force isproportional (but opposite direction) to the horizontal pressure gradient. So for thisexample the pressure force will yield an acceleration given by:P 1 p hi giρ x xwhere i is the unit vector along the x-axes.Note that for this model, when we have a constant density, the same pressure forcewill be obtained at any level. Try for instance to calculate the pressure gradient at thelevel z D/2 (half way down, and at z 0 (the surface). This means that the pressureforce is constant through the depth, and is only due to the tilt of the surface. This willthen give the same acceleration at all depths, as indicated on Fig. 4.1.We will now consider an ocean where the surface is horizontal, but the density isvarying horizontally, see Fig. 4.5.zDρ00PρLL xFig. 4.5. An ocen model where the density varies horizontally (with the distance x).
23Let us assume that the density at the western coast (x 0 ) is higher than at the easterncoast (x L);ρ0 ρLWe now calculate the pressure at the bottom at x 0 and at x Lp(x 0) p0 ρ0gDandp(x L) pL ρLgDThe pressure difference becomesp0 – pL p (ρ0 – ρL)gDIn this case the pressure force becomes:P ρ ρ L gD ρ gD1 pi 0ii xρ xρ x ρSo the pressure force is proportional (but opposite direction) to the horizontal densitygradient.Note that in this case the depth D comes into play. Which means that at the depthz D/2 we will only have half the pressure force, and at the surface there is no pressureforce, see Fig.4.5Coriolis forceAccording to Newton’s first law an object continues at constant speed if there is noforces acting on it. Imagine you are in the centre of a merry-go-round and you roll aball outwards. Disregarding friction the ball will follow a straight line, but for youwho are sitting in the centre and rotating with the merry-go-round it will appear likethe ball is deflected, see Fig.4.6. This apparent force deflecting it is called the Coriolisforce. If there is no motion, there is no Coriolis force, (secondary force). The Coriolisforce acts perpendicular to the velocity.If we consider a plane on the rotating earth we notice that on the Poles a plane makesone full rotation in 24 hours, but at the Equator it does not rotate at all. Let Ω be therotation rate of the planet:Ω 360 /24hours 2π/24h
24Trajectory of ball:Apparent observed from therotating platformTrue, as observed from spaceFig.4.6. The Coriolis force demonstrated at a rotating plane.The rotation rate of the plane on the planet will vary with latitude (φ) and the localrotation rate is given as Ώsin(φ). The Coriolis force is proportional to two times thelocal rotation rate, which is called the Coriolis parameter f:f 2Ώsin(φ).Thus the magnitude of the Coriolis force proportional to the speed (v), and dependingof the sign of sin(φ) it is directed to the right of the velocity at the northernhemisphere, and to the left at the southern hemisphere(see Fig.4.7):C fvCvFig. 4.7. Illustrating the Coriolis force at the Southern hemisphereThe Coriolis term is important for motions with large time- (a few days ore more) andspace- (10 – 50km or more) scales.
25
26Geostrophic currentsMeasurements show that for large-scale, deep ocean currents only the pressure forceand the Coriolis force are important. So the large scale ocean current are described bythe geostrophic balance:P C 0and the resulting velocity given by v C/f is called the geostrophic velocity.CPFig.4.8. The geostrophic balanceThe Coriolis force as illustrated in Fig.4.8 is created by a velocity into the paper plane(southern hemisphere).Going back to our model ocean basin let us consider the ocean with constant densityand a tilting surface:z hDCPx2LFig.4.9. Geostrophic model in a constant density ocean.In an ocean with constant density and a tilting surface, the pressure force, andtherefore the associated Coriolis force according to the Geostrophic model, areconstant with depth. If the coordinate x is east, then the geostrophic current in Fig.4.9is northwards (along positive y-axis): see Fig.4.10.
27zvDyFig. 4.10. The geostrophic velocity associated with the model in Fig.4.9The corresponding geostrophic balance and the geostrophic velocity associated withthe model with horizontal surface and a horizontal density gradient are illustrated inFig.4.11 and 4.12.zDρ0CρLP0L xFig. 4.11. The geostrophic balance in an ocean with a horizontal density gradient.zDv0yFig. 4.12. The geostrophic velocity associated with the model in Fig.4.11
28FrictionWind driven currents.Friction only occurs when there is motion. The friction is directed opposite to thecurrent velocity. Consider a water layer near the surface of the ocean, or more easy toimagine: an ice floe with wind blowing above (Ft) and friction is felt from the waterlayer below (Fb ), see Fig. 4.13.FtvCWindFba)FtvCFbb)Fig. 4.13 Wind driven ice floe. A balance is possible when the ice moves at an angleto the right of the wind (Northern hemisphere)From Fig.4.13 a) we note there is no force to balance the Coriolis force. A balance isonly possible if the ice floe moves at angle to the wind, to the right on the northernhemisphere. So for wind-driven currents the balance of forces is:
29Ft Fb C 0A theoretical model called the Ekman model shows that the mass transport in thewind-influence layer is directed perpendicular to the wind, to the right (left) on thenorthern (southern) hemisphere. This is called the Ekman Transport (ME), seeFig.4.14WindEkman TransportMEFig 4.14 The Ekman Transport on the Northern Hemisphere.This has an important implication: when the wind is blowing parallel to thecoast it will give up- or down-welling.Exercise: Which wind direction would cause up-welling near the Namibian coast?The Mozambican coast? The Norwegian coast?The ocean surface currents are mainly wind-driven. The currents will be modified bycontinents, bottom topography, heating/cooling and tides.In Fig.4.15 a very simple wind driven ocean model is shown. We assume straightnorth – south oriented coasts, and we simplify the wind patterns, compare Fig.1.4.The results of this model indicate that near Equator where the Coriolis parameter issmall and therefore the Coriolis force weak, the currents follow mainly the winddirection. When it hits the western coast, it is split in a northern and a southernbranch. But as we now are going away from Equator, the current tends to be bent backeastwards because of the Coriolis force. On its way eastwards, the Coriolis force isstill strong, such that a return flow towards the Equator is taking place along thewhole track, leading to a much weaker boundary current at the east coast than thewest coast. This is called westward intensification. In summary, the solution is biggyres at both sides of Equator and a strong western boundary current.
30What does the real world look like? In Fig. 4.16 a more realistic wind patternand sea level pressure map is given, and in Fig. 4.17 and 4.18 the surface circulationof the AtlanticFig.4.15. Wind and ocean circulation patterns in an idealised ocean basin. Because theCoriolis force is stronger at higher latitudes, the eastward flowing waters are stronglydeflected back toward the equator. Consequently, surface waters tend to flow towardthe equator everywhere except along the western edge of the ocean.Fig.4.16. Yearly averaged sea level pressures, indicating the regions of high and lowpressures and the general pattern of the surface winds.
31and the Pacific oceans are given. We recognise both in the Atlantic and in the Pacificsome of the main features of our simple model, indicating that the basic physics weassumed is correct.Fig.4.17. Atlantic Ocean – surface circulationIn Fig. 4.19 the surface circulation of the Indian Ocean is shown. It has beennecessary to show this on two maps, because the currents reverse with the season.These are known as Monsoon Currents. In November – March (northern hemispherewinter) the earth cools down much faster than the ocean. Thus the air has a tendencyto rise above the ocean and leading to winds from the land towards the ocean.Because of the Coriolis force the current tends to go to the right of the wind, leadingto a westward current during this season. In the summer the situation is opposite.
32Exercise: Mention some reasons why the land warms up faster than the ocean in thesummer.The surface current systems in the Antarctic and the Arctic are shown in Figs.4.20 and 4.21.Before we end this chapter let us have a look at the distribution of phosphaticdeposits, an indicator of primary production, see Fig.4.22. Compare the surfacepressure map and associated winds in Fig.4.16. Note that the Benguela is one of the 4major upwelling systems.Exercise: Point out and name the other 3.Fig. 4.18. Pacific Ocean – surface circulation.
33Fig.4.19 Indian Ocean – surface circulationFig.4.20 Antarctic Ocean – surface circulation
34Fig.4.21 Arctic Ocean – surface circulationFig.4.22 Distribution of phosphatic deposits, as an indicator for the major upwellingsystems
355.WAVESWaves are characterized as periodic in space: Fig.5.1,Crest1y asin (2πx/L)0.5ac0x1x L/4x L/2x 3L/4X L-0.5-1TroughLFig.5.1 Showing wave periodicity in spaceand time Fig.5.2Crest1y asin (2πx/T)a0.5x01x T/4x T/2x 3T/4x T-0.5-1TroughTFig.5.2 Showing wave periodicity in timeHere is a : amplitude, L: wavelength and T: period. Frequency is defined as 2π/T andthe speed of the wave (phase speed c) is given as c L/T.
36SuperpositionOne interesting feature of waves is that the travel of any one wave train is completelyindependent of the motion of any other. Even when two or more different wave trainhappens to be passing through the same region at the same time, each continues on itsway as if the others were not there. Any portion of the real ocean surface is a collageof many different wave trains of all shapes and sizes and going many differentdirections. Each of these continues on its way across the ocean, unaffected by theothers.Superposition31 2221101-1-2-3Fig.5.3. In the superposition of waves, the resulting displacement is the sum of thetwo others.Deep (short) and shallow (long) water wavesWaves are called long or short if the wavelength is long or short compared to thewater depth. Short waves have maximum amplitudes near the surface, and theamplitude vanishes a few wavelengths down in the ocean, while long waves havemore or less constant amplitude with depth, see Fig.5.4For long waves the phase speed is given by c gh , where h is the oceandepth. Remember this formula only applies for waves which are long compared to theocean depth where they occur.
37Fig.5.4. Deep and shallow water wavesEnergy spectrumWaves are classified according to their wavelengths and periods. An example ofrelative energy of various wave types is shown in Fig 5.5. Note that the highestenergy is found for wind waves. At low frequencies, the period (and wavelength) is solong that the rotation of the earth have importance (planetary waves). One example ofa planetary wave is the equatorial Kelvin wave, which is believed to cause the El Niñophenomenon.
38Fig.5.5 Energy spectrum for surface wavesInternal wavesThe reason that waves occure at air – ocean interface is the large difference in density.However, in the ocean we find density differences, although much smaller, betweenthe upper layer and the layer below the thermocline. Also on this density interfacewaves may occur, these are called internal waves. They usually have periods of a fewminutes, and may have amplitudes of several meters. These motions may thereforebring nutrients from below the thermocline to the photic zone. These waves are sometimes referred to as “nutrient pump”. An example of observation of internal waves isshown in Fig.5.6.
39Fig.5.6 Observations of internal waves by an echo-sounder on board R/V “DR. Fridtjof Nansen”outside the Angolan coast in March 1995. The undulating structure between 0 and 30 m depth is due toreflection from phytoplankton in the halocline. After about 20 minutes when the ship was movingparallel to the wave crests, the ship turned left heading into the waves. The corresponding shift infrequency is clearly seen. Inserted the density profile obtained using a CTD.Langmuir CirculationThese are not waves, as they do not have any phese speed, but they are organized ashelical motions with scal
Garrison,T: OCEANOGRAPHY. An Invitatio n to Ocean Sciences.1996. (Wadsford) Hartmann, D.L. Global Physical Climatology. Academic Press 1994 Hayes and Laevastu: "Fisheries Oceanography and ecology" (Farnham) Pickard and Emery: "Descriptive physical oceanography". 1970 (Pergamon) Pinet, P.R. Invitation to Oceanography Jones and Barlett, 1998