Transcription
Teaching PhysicalConcepts inOceanographyAn Inquiry-Based ApproachBy Lee Karp-Boss, Emmanuel Boss, Herman Weller,James Loftin, and Jennifer Albright
ContentsIntroduction. 1Chapter 1. Density. 4Encouraging Students to Ask Questions:A Walk Through a Rich Environment.12Chapter 2. Pressure.14Discrepant Events: Awakening Students’ Curiosity.24Chapter 3. Buoyancy.25Assessing Student Learning.31Chapter 4. Heat and Temperature.32Team-Based Learning.42Chapter 5. Gravity Waves.44Lee Karp-Boss, Emmanuel Boss, and James Loftin are at the School of MarineSciences, University of Maine, Orono, ME, USA. Herman Weller and JenniferAlbright are at the College of Education and Human Development, Universityof Maine, Orono, ME, USA. The authors are affiliated with the Center for OceanSciences Education Excellence-Ocean Systems (COSEE-OS), Darling MarineCenter, University of Maine, Walpole, ME, USA.Support for this project was provided by the National Science Foundation’sDivision of Ocean Sciences Centers for Ocean Sciences Education Excellence(COSEE), grant number OCE-0528702. Any opinions, findings, conclusions, orrecommendations expressed in this publication do not necessarily reflect theviews of NSF. A pdf of this document is available on The Oceanography SocietyWeb site at http://www.tos.org/hands on. Single printed copies are availableupon request from info@tos.org. 2009 The Oceanography SocietyEditors: Ellen Kappel and Vicky CullenLayout and design: Johanna AdamsPermission is granted to reprint in whole or in part for anynoncommercial, educational uses. The Oceanography Society requeststhat the original source be credited.
INTRODUCTIONmaterial, resulted in the transfer of science facts but did not reflectthe way science is done. In our usual approach, students weretypically passive observers with very little engagement or use ofinquiry. Science, however, is not only about “bodies of knowledge”; science is a way of thinking and doing, where inquiry is aninherent process. When we “do” science, we make predictions,generate questions and falsifiable hypotheses, take measurements, make generalizations, and test concepts by application.According to the National Science Education Standards (NationalResearch Council, 1996), “In the same way that scientists developtheir knowledge and understanding as they seek answers to questions about the natural world, students develop an understandingof the natural world when they are actively engaged in scientificinquiry—alone and with others.” Students do not engage ininquiry when they are taught about the products of science(e.g., facts, concepts, principles, laws, and theories) and the techniques used by scientists. In our usual way of teaching science,labs were often used for science verification. In that mode, thelaws of physics were first introduced and the lab was then usedto illustrate them. Emphasis was on data collection, plotting,and the writing of reports. Such exercises most often lacked theelement of exploration.We have come to understand that inquiry and exploration areessential to exciting students’ curiosity and interest in science.Outliers in experimental data are often more interesting than thepoints that fit theory, as they require an explanation beyond thematerial available in textbooks. The explorative approach canprovide students with a deeper understanding of the scientificprocess and can help develop critical thinking skills—skills thatare rarely called for in the verification approach.Our second realization was that a student’s ability to recitetextbook content and formulas does not necessarily indicate anunderstanding of the underlying physical principles. Physics canbe taught using mathematical descriptions. Students can learnwhich equations will yield which quantities, and this knowledgecan be readily assessed in written exams. However, this approachdoes not necessarily develop a student’s ability to recognizewhen fundamental principles might be applied to slightlydifferent problems. We “discovered” that our students achieveddeeper learning and a more profound understanding of physicalconcepts when they took an active part in learning—for example,This supplement to Oceanography magazine focuses on educational approaches to help engage students in learning and offers acollection of hands-on/minds-on activities for teaching physicalconcepts that are fundamental in oceanography. These keyconcepts include density, pressure, buoyancy, heat and temperature, and gravity waves. We focus on physical concepts for tworeasons. First, students whose attraction to marine science stemsfrom an interest in ocean organisms are typically unaware thatphysics is fundamental to understanding how the ocean, and allthe organisms that inhabit it, function. Second, existing marineeducation and outreach programs tend to emphasize the biological aspects of marine sciences. While many K–12 activities focuson marine biology, comparatively few have been developed forteaching about the physical and chemical aspects of the marineenvironment (e.g., Ford and Smith, 2000, and a collection ofactivities on the Digital Library for Earth System Education Website [DLESE; http://www.dlese.org/library/index.jsp]). The oceanprovides an exciting context for science education in general andphysics in particular. Using the ocean as a platform to whichspecific physical concepts can be related helps to provide theenvironmental relevance that science students are often seeking.The activities described in this supplement were developedas part of a Centers for Ocean Sciences Education Excellence(COSEE) collaboration between scientists and education specialists, and they were implemented in two undergraduate coursesthat targeted sophomores, juniors, and seniors (one for marinescience majors and one including both science and educationmajors) and in four, week-long workshops for middle- and highschool science teachers. Below, we summarize our educationalapproach and discuss the organization of this volume.Verification or Discovery?Our approach to teaching science has its basis in three important“discoveries” we made. We put discoveries in quotation marksbecause many people discovered them before us. However, untilwe “discovered” them ourselves, we did not realize their significance. This process is similar to the experiences of our students,who discover for themselves how physics can help explain theenvironment in which they live.Our first realization was that our usual way of teaching scienceat the university level, through delivery and recitation of textbook1
when they performed hands-on experiments that gave them anopportunity to “see/feel” for themselves what the mathematicaldescriptions model.and learning are occurring. For example, traditional laboratoryexercises, in which students are asked to follow step-by-step,cookbook-style instructions, can illustrate a scientific principle orconcept, teach students laboratory skills, and provide some handson experience—but they do not provide the “minds-on” aspect ofinquiry. For the “hands-on/minds-on” approach to be successfulin terms of fostering inquiry, students should be encouraged toask questions, make predictions and test them, formulate possibleexplanations, and apply their knowledge in a variety of contexts.Students do not enter our classes as blank slates ready toabsorb new information. Rather, they arrive in class with adiverse set of conceptions (and sometimes misconceptions)based on their previous experiences. Inquiry-based approachesallow instructors to probe students’ knowledge and identifymisconceptions that may interfere with learning. Inquiry helpsstudents understand science as a way of thinking and doing,encourages them to challenge their assumptions, and createsan environment in which they seek alternative solutions andexplanations. Broadly applicable skills developed in the inquiryprocess—reasoning, problem-solving, and communication—willbe useful to students throughout their lives.One barrier to our application of an inquiry-based teachingapproach was a concern that this instructional method wouldnot allow us to cover all the curriculum material within theprescribed time. This worry is valid, considering our limitedclassroom time. We felt, however, that if the purpose of teachingis to promote meaningful learning experiences in which studentsnot only gain foundational knowledge but also learn to applyand integrate concepts, as well as grow towards becoming selfdirected learners, we had to consider an inquiry-based approach.Given students’ feedback on how beneficial this approach wasto their learning, we came to realize that less is often more. Weadvocate for inquiry-based teaching, but we do not believe thatall subject matter should always be taught through inquiry orthat all elements of inquiry (generating questions, gatheringevidence, formulating explanations, applying knowledge toother situations, and communicating and justifying explanations[National Research Council, 2000]) must be present at all times.Effective teaching requires the use of a variety of strategies andapproaches (e.g., Feller and Lotter, 2009) that should be adaptedto the individual classroom, the individual learners, the size anddynamics of each class, and immediate and long-term learningobjectives, among other factors.Creating MeaningfulLearning ExperiencesOur third realization was that each student has a different setof predominant learning modalities—that is, some combinationof learning by listening, reading or viewing, touching, or doing(Dunn and Dunn, 1993). The assumption that “if this teachingapproach worked for me, it must be good for my students” maynot fit all students; after all, we in academia are the minority whothrived in this educational system. We have “discovered” thatteaching that accommodates a variety of learning modalitiesmakes our instruction more effective and improves our students’learning. It was also crucial to become aware that not everystudent is a young version of us. Some will simply not possess thecuriosity, interest, and attitudes that motivate scientists. Onlya minority of our students will continue in scientific research.However, all of them will eventually be consumers of scientificknowledge, taxpayers who fund our research, and decisionmakers in voting booths and public offices. We therefore have aresponsibility to improve our students’ general scientific literacyand ocean literacy in particular. We need to help them developthe knowledge and skills required by citizens who will inevitablyface scientific, environmental, and technological challenges.Inquiry-Based Learning and TeachingIn science teaching, inquiry refers to a way in which learnersbecome engaged in scientific questions or problems—trying tosolve them by making predictions and testing them, seekingevidence and information, formulating possible explanations,evaluating them in light of alternative explanations, and communicating their understanding (National Research Council, 2000).Inquiry “is far more flexible than the rigid sequence of stepscommonly depicted in textbooks as the ‘scientific method.’ It ismuch more than just ‘doing experiments,’ and it is not confinedto laboratories” (AAAS, 1993). There are several models ofinquiry-based teaching and learning (e.g., Hassard, 2005). In ourteaching, we use hands-on/minds-on laboratory activities anddemonstrations, but other effective, inquiry-friendly approachesthat we do not discuss here include the use of case studies,project-based assignments, and service learning.We caution that just providing students with laboratoryexperiences does not necessarily imply that inquiry teaching2
How To Use This DOCUMENTconnections to ocean processes are highlighted during thediscussion and through homework assignments.A 90-minute class period is typically sufficient for studentsto complete four to six activities during the first hour, leavingapproximately 30 minutes for group discussion. Note that eachof these activities can stand alone or can be presented as a classdemonstration. Most require simple and affordable equipmentthat is generally available in classrooms or homes. We purchasedsome equipment at specialized science education stores (e.g.,sciencekit.com), and we constructed some equipment ourselves.This document is comprised of five chapters, each focusingon one of the following physical concepts—density, pressure,buoyancy, heat and temperature, and gravity waves. For each,we provide background information followed by detaileddescriptions and explanations of hands-on activities. The activities emphasize different aspects of each concept. This approachallows students to examine each concept from a variety ofangles, apply what they have learned to new situations, andchallenge their understanding. In addition, we point out severalpedagogical approaches that can improve teaching and fosterlearning (see also Feller and Lotter, 2009).The hands-on activities are presented here in the formats weuse in our college-level classes, which are composed mostly ofsophomore, junior, and senior science and education majorswho have previously taken an introductory oceanographycourse. Graduate students and our colleagues also found someof these activities challenging. For other settings (e.g., studentswith different backgrounds) and other curricula, these activities can and should be adapted, with appropriate changes in thebackground material, class discussions, activity descriptions, andexplanations. Science teachers who participated in our workshops have successfully adapted some of the activities to theirmiddle- and high-school classes.In our classes, activities are most often conducted at classroomstations through which teams of three to four members rotate. Attimes, we present them as a sequence of activities or demonstrations that the class follows collectively, with students seated insmall groups to facilitate discussion. Working in small groupsfosters collaborative thinking and learning. Often, we encouragea healthy competition among groups (e.g., with group quizzes)to add a level of excitement and challenge. During class, weuse a Socratic teaching approach in the sense that students arepresented with guiding questions. Students’ questions during theactivities are not always addressed by answers. Rather, we askadditional questions that lead them to examine their ideas andviews. Students are asked to make predictions, conduct measurements, and find possible explanations for the phenomena theyobserve. Once students complete the activities, the class gathersfor a summary discussion during which each group is asked tooffer an explanation for a given activity. Providing students withtime to verbally communicate their views and understandingis an essential part of our approach. It ensures that misconceptions or difficulties with concepts are identified, discussed,and ultimately resolved. The applications of a concept and itsReferences and OtherRecommended ReadingAmerican Association for the Advancement of Science (AAAS). 1993. Benchmarksfor Science Literacy: Project 2061. Oxford University Press, New York,NY, 448 pp.Driver, R., A. Squires, P. Rushworth, and V. Wood-Robinson. 1994. Making Senseof Secondary Science: Research into Children’s Ideas. Routledge, New York,NY, 224 pp.Dunn, R., and K. Dunn. 1993. Teaching Secondary Students Through Their IndividualLearning Styles: Practical Approaches for Grades 7–12. Allyn and Bacon, Boston,MA, 496 pp.Duschl, R.A. 1990. Restructuring Science Education: The Importance of Theories andTheir Development. Teachers College Press, New York, NY, 155 pp.Feller, R.J., and C.R. Lotter. 2009. Teaching strategies that hook classroom learners.Oceanography 22(1):234–237. Available online at: http://tos.org/oceanography/issues/issue archive/22 1.html (accessed August 18, 2009).Ford, B.A., and P.S. Smith. 2000. Project Earth Science: Physical Oceanography.National Science Teachers Association, Arlington, VA, 220 pp.Hassard, J. 2005. The Art of Teaching Science: Inquiry and Innovation in MiddleSchool and High School. Oxford University Press, 476 pp.Hazen, R.M., and J. Trefil. 2009. Science Matters: Achieving Scientific Literacy.Anchor Books, New York, NY, 320 pp.McManus, D.A. 2005. Leaving the Lectern: Cooperative Learning and theCritical First Days of Students Working in Groups. Anker PublishingCompany Inc., 210 pp.National Research Council. 1996. National Science Education Standards. NationalAcademy Press, Washington, DC, 262 pp.National Research Council. 2000. Inquiry and the National Science EducationStandards: A Guide for Teaching and Learning. National Academy Press,Washington, DC, 202 pp.Related Web Sites 3Cooperative Institute for Research in Environmental Science (CIRES):Resources for Scientists in Partnership with Education spectives of Hands-On Science tent/cntareas/science/eric/eric-toc.htmTeaching Science Through Science as Inquiryhttp://www2.gsu.edu/ mstjrh/mindsonscience.htmlScience Education Resource Center (SERC), Pedagogy in Action,Teaching ies.html
Chapter 1. DENSITYPURPOSE OF ACTIVITIESfluid parcel to increase and its density to decrease (its mass doesnot change). Cooling reduces the distance between molecules,causing the volume of the fluid parcel to decrease and its densityto increase. The relationship between temperature and densityis not linear, and the maximum density of pure water is reachednear 4 C (see Denny, 2007; Garrison, 2007; or any other generaloceanography textbook).Density is a fundamental property of matter, and although it istaught in secondary school physical science, not all universitylevel students have a good grasp of the concept. Most studentsmemorize the definition without giving much attention to itsphysical meaning, and many forget it shortly after the exam. Inoceanography, density is used to characterize and follow watermasses as a means to study ocean circulation. Many processesare caused by or reflect differences in the densities of adjacentwater masses or differences in densities between fluids andsolids. Plate tectonics and ocean basin formation, deep-waterformation and thermohaline circulation, and carbon transportby particles sinking from surface waters to depth are a fewexamples of density-driven processes. The following set of activities is designed to review density, practice density calculations,and highlight links to oceanic processes.Density, Stratification, and MixingStratification refers to the arrangement of water masses in layersaccording to their densities. Water density increases with depth,but not at a constant rate. In open ocean regions (with theexception of polar seas), the water column is generally characterized by three distinct layers: an upper mixed layer (a layer ofwarm, less-dense water with temperature constant as a functionof depth), the thermocline (a region in which the temperature decreases and density increases rapidly with increasingdepth), and a deep zone of dense, colder water in which densityincreases slowly with depth. Salinity variations in open oceanregions generally have a smaller effect on density than dotemperature variations. In other words, open-ocean seawaterdensity is largely controlled by temperature. In contrast, incoastal regions affected by large riverine input and in polarregions where ice forms and melts, salinity plays an importantrole in determining water density and stratification.Stratification forms an effective barrier for the exchange ofnutrients and dissolved gases between the top, illuminated surfacelayer where phytoplankton can thrive, and the deep, nutrientrich waters. Stratification therefore has important implicationsfor biological and biogeochemical processes in the ocean. Forexample, periods of increased ocean stratification have beenassociated with decreases in surface phytoplankton biomass,most likely due to the suppression of upward nutrient transport(Behrenfeld et al., 2006; Doney, 2006). In coastal waters, wherethe flux of settling organic matter is high, prolonged periods ofstratification can lead to hypoxia (low oxygen), causing mortalityof fish, crabs, and other marine organisms.Mixing of stratified layers requires work. As an analogy, thinkabout how hard you need to shake a bottle of salad dressing tomix the oil and vinegar. Without energetic mixing (e.g., dueto wind or breaking waves), the exchanges of gases and nutrients between surface and deep layers will occur by molecularBACKGROUNDDensity (noted as ρ) is a measure of the compactness ofmaterial—in other words, how much mass is “packed” into agiven space. It is the mass per unit volume ( ρ m ; units inVkg/m3 or g/cm3), a property that is independent of the amountof material at hand. The density of water is about a thousandtimes greater than that of air. The density of water ranges from998 kg/m3 for freshwater at room temperature (e.g., see SC/Waterdensity Pipet Calibration Data.pdf) to nearly 1,250 kg/m3 insalt lakes. The majority of ocean waters have a density rangeof 1,020–1,030 kg/m3. The density of seawater is not measureddirectly; instead, it is calculated from measurements of watertemperature, salinity, and pressure. Given the small rangeof density changes in the ocean, for convenience, seawater’sdensity is expressed by the quantity sigma-t (σ t ), which isdefined as σ t ρ 1000.Most of the variability in seawater density is due to changesin salinity and temperature. A change in salinity reflects a changein the mass of dissolved salts in a given volume of water. Assalinity increases, due to evaporation or salt rejection duringice formation, the fluid’s density increases, too. A change intemperature results in a change in the volume of a parcel of water.An increase in the temperature of a fluid results in an increasein the distance between molecules, causing the volume of the4
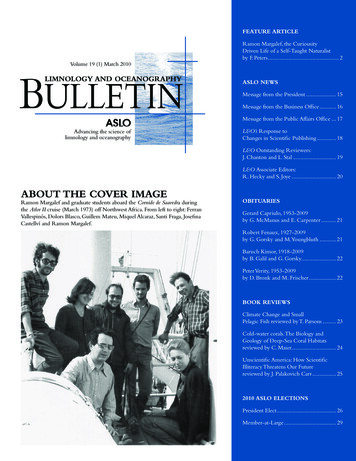
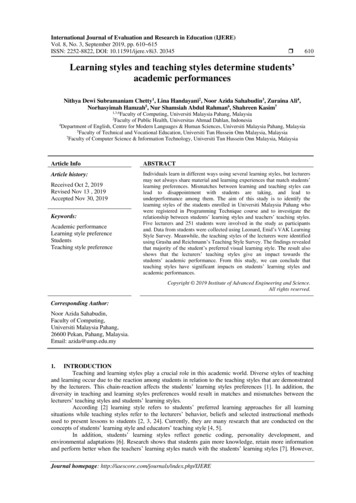
DESCRIPTION OF ACTIVITIESdiffusion and local stirring by organisms, which are slow, ineffective modes of transfer (Visser, 2007). The energy neededfor mixing is, at a minimum, the difference in potential energybetween the mixed and stratified fluids. (Some of the energy,most often the majority, is lost to heat.) Therefore, the morestratified the water column, the higher the energy needed forvertical mixing. (Advanced students can be asked to computethis energy requirement, using the concept that the fluid’s centerof gravity is higher in the mixed fluid relative to the stratified one[e.g., Denny, 1993]).Density is fundamentally important to large-scale oceancirculation. An increase in the density of surface water, througha decrease in temperature (cooling) or an increase in salinity (iceformation and evaporation), results in gravitational instability(i.e., dense water overlying less-dense water) and sinking ofsurface waters to depth. Once a sinking water mass reaches adepth at which its density matches the ambient density, the massflows horizontally, along “surfaces” of equal density. This processof dense-water formation and subsequent sinking is the driverof thermohaline circulation in the ocean. It is observed in lowlatitudes (e.g., the Gulf of Aqaba in the Red Sea, the Gulf of Lionsin the Mediterranean Sea) as well as in high latitudes (e.g., deepwater formation in the North Atlantic). Within the upper mixedlayer, convective mixing occurs due to heat loss from surfacewaters (density driven) and due to wind and wave forcing(mechanically driven).Density is also fundamentally important to lake processes.As winter approaches in high latitudes, for example, lake watersare cooled from the top. As the surface water’s temperaturedecreases, its density increases, and when the upper watersbecome denser than the waters below, they sink. The warmer,less-dense water underneath the surface layer then upwells toreplace the sinking water. If low air temperatures persist, thesecooling and convective processes will eventually cool the entirelake to 4 C (the temperature of maximum density for freshwaterat sea level). With yet further surface cooling, the density of theupper waters will decrease. The lake then becomes stably stratified, with denser water at the bottom and colder but less-densewater above. When surface waters further cool to 0 C, they beginto freeze. With continued cooling, the frozen layer deepens.Activities 1.1–1.3 are used to review density, and Activities1.4–1.6 highlight links to oceanic processes. Activities 1.1–1.3emphasize the relationship between an object’s mass, volume,and density and its sinking or floating behavior. Theseactivities also allow students to practice measurement skills.Measurements and related concepts such as precision andaccuracy, and statistical concepts such as average and standarddeviation, can be introduced during class and/or provided ashomework. In Activities 1.4–1.6, students examine relationshipsamong density, stratification, and mixing, and then discussapplications to ocean processes.Activities are set up at stations prior to class (typically fourto five stations per 90-minute class period, with the choice ofactivities, level of difficulty, and depth of discussion dependenton the students’ backgrounds). Students are asked to rotateamong stations to complete the assignments. During this time,instructors move among the groups and guide students by askingprobing questions. The last 30 minutes of class are used forsummary and discussion.Activity 1.1. Will It Float? (Figure 1.1)Materials Two solid, approximately equal-volume woodencubes, one made of balsa and the other of lignum vitae(from sciencekit.com)Large, hollow metal ball (from sciencekit.com)Figure 1.1. Materials for Activity 1.1.5
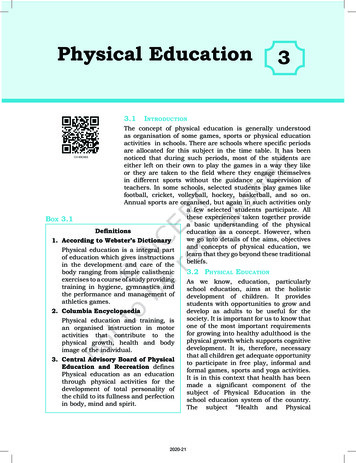
We discuss the commonly used phrase “heavy things sink, lightthings float” and point out the potential misconception thatcould arise. (2) The floating or sinking behavior of an object doesnot depend only on the material from which the object is made(e.g., addressing the common misconception that wood alwaysfloats). If time allows, a discussion on volume measurements(based on measured dimensions or volume displacement) can bebrought in, leading to the concept of buoyancy, which is introduced in Chapter 3.Small Delrin ball or other solid plastic sphere (availableat any hardware store)Container filled with room-temperature tap waterRuler or caliperBalanceInstructions to the Students1. Make a list of properties that you think determine whether anobject sinks or floats.2. Feel the objects provided and predict which will float inwater and which will sink. What is the reasoning behind yourprediction? Discuss your prediction with your group.3. Test your prediction. Do your observations support yourprediction? If not, how can you explain it?4. Based on your observations, how would you revise your list ofproperties from Step 1?5. Determine the mass and volume for each cube and ball. Canyou suggest more than one method to obtain the volumesof the cubes and balls? (If time allows: How do the densitiesobtained by the different methods compare?)6. What is the relationship, if any, between the masses of theobjects and the sinking/floating behaviors you observed?What is the relationship, if any, between the volumes of theobjects and the sinking/floating behaviors you observed?7. Calculate the densities of the cubes, balls, and tap water. Whatis the relationship, if any, between the densities you calculatedand the sinking/floating behaviors you observed?Activity 1.2. Can a Can Float? (Figure 1.2)Materials A can of Mountain Dew and a can of Diet Mountain DewLarge container filled with room-temperature tap waterCaliper or rulerBalance2-liter graduated cylinderInstructions to the Students1. Examine the two cans. List similarities and differencesbetween them.2. What do you think the floating/sinking behavior of each canwill be when placed in room-temperature tap water? Write thereasoning for your prediction.3. Place the two cans in the tank. Be sure no bubbles cling to thecans. Does your observation agree with your prediction? Howwould you explain this observation?4. How would you determine the density of each can? Try yourapproach. How do the densities of the cans compare to thedensity of tap water?5. Are your density measurements in agreement with your observations? Why might there be a difference in density betweenthe cans and/or between the cans and the water?ExplanationIn this activity, students experiment with four objects—twotypes of solid wooden cubes, a hollow metal ball, and a solidplastic sphere. We use two types of wood that differ greatlyin density: balsa, with a density range of 0.1–0.17 g/cm3 (thespecific cube we use has a mass of 2.25 g and a volume of16.7 cm3, hence a density of 0.13 g/cm3), and lignum vitae, witha density range of 1.17–1.29 g/cm3 (the specific cube we usehas a mass of
A pdf of this document is available on The Oceanography Society . This supplement to Oceanography magazine focuses on educa- . at the university level, through delivery and recitation of textbook material, resu