Transcription
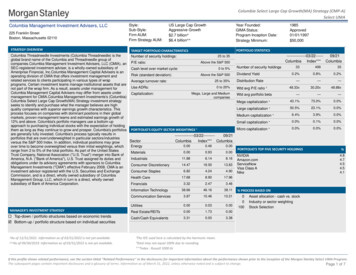
Columbia Select Large Cap Growth(MA) Strategy (CMP-A)Select UMAColumbia Management Investment Advisers, LLC225 Franklin StreetBoston, Massachusetts 02110Style:Sub-Style:Firm AUM:Firm Strategy AUM:US Large Cap GrowthAggressive Growth 2.7 billion 6.4 billion Year Founded:GIMA Status:Program Inception Date:Strategy Minimum:1985Approved01/01/1997 50,000STRATEGY OVERVIEWPORTFOLIO STATISTICSTARGET PORTFOLIO CHARACTERISTICSColumbia Threadneedle Investments (Columbia Threadneedle) is the---------------03/22-----09/2125 to 35Number of security holdings:global brand name of the Columbia and Threadneedle group of---------ColumbiaColumbiaIndex***Above the S&P 500companies.Columbia Management Investment Advisers, LLC (CMIA), an P/E ratio:3349935Number of security holdingsSEC-registered investment adviser, is a wholly-owned subsidiary of0 to 5%Cash level over market cycle:Ameriprise Financial, Inc.Columbia Management Capital Advisers is an0.2%0.8%0.2%Dividend YieldAbove the S&P 500Risk (standard deviation):operating division of CMIA that offers investment management andrelated services to clients participating in various types of wrap———Distribution Rate25 to 35%Average turnover rate:programs. Certain investment teams manage institutional assets that are0 to 20%Use ADRs:48.33x30.20x48.88xWtd avg P/E ratio ¹not part of the wrap firm. As a result, assets under management forColumbia Management Capital Advisers may differ from assets underMega, Large and MediumCapitalization:———Wtd avg portfolio betamanagement for CMIA.Columbia Management Investments's (Columbia)companiesColumbia Select Large Cap Growth(MA) Strategy investment strategy43.1%73.0%0.0%Mega capitalization seeks to identify and purchase what the manager believes are high50.5%23.1%0.0%Large capitalization quality companies with superior earnings growth characteristics. Thisprocess focuses on companies with dominant positions in their global6.4%3.9%0.0%Medium capitalization markets, proven management teams and estimated earnings growth of0.0%0.1%0.0%12% and above. Columbia's portfolio managers use a bottom-upSmall capitalization approach to purchasing individual stocks with the expectation of holding0.0%0.0%0.0%Micro capitalization them as long as they continue to grow and prosper. Columbia's portfolios PORTFOLIO'S EQUITY SECTOR WEIGHTINGS are generally fully invested. Columbia's process typically results in---------------03/22--------09/21portfolios that are over/underweighted in particular sectors/industriesSectorColumbia-------Index*** Columbiaversus the S&P 500 Index. In addition, individual positions may grow0.000.460.00Energyover time to become overweighted versus their initial weightings, whichPORTFOLIO'S TOP FIVE SECURITY HOLDINGS%range from 2 to 5% of the total portfolio. As part of the United States0.000.930.00MaterialsTrust Company, National Association ("U.S. Trust") merger into Bank of4.8NVIDIA11.886.148.16 Amazon.comIndustrialsAmerica, N.A. ("Bank of America"), U.S. Trust assigned its duties and4.7obligations under its advisory agreements with sponsors to Columbia4.514.4718.5013.83 ServiceNowConsumer DiscretionaryManagement Investments ("CMA") effective February 2008. CMA is an4.5Visa Class A6.824.244.90 Nikeinvestment advisor registered with the U.S. Securities and ExchangeConsumer Staples4.1Commission, and is a direct, wholly owned subsidiary of Columbia17.688.9017.96Health CareManagement Group, LLC, which in turn is a direct, wholly ownedsubsidiary of Bank of America Corporation.3.322.473.46Financials38.6646.1638.11% PROCESS BASED ONCommunication al Estate/REITs0.001.730.00Cash/Cash Equivalents3.310.003.38Information TechnologyMANAGER'S INVESTMENT STRATEGY Top-down / portfolio structures based on economic trends Bottom-up / portfolio structure based on individual securities As of 12/31/2021. Information as of 03/31/2022 is not yet available. As of 09/30/2019. Information as of 03/31/2022 is not yet available.Asset allocation - cash vs. stockIndustry or sector weightingStock Selection¹The P/E used here is calculated by the harmonic mean. Total may not equal 100% due to rounding.***Index : Russell 1000 GrIf this profile shows related performance, see the section titled "Related Performance" in the disclosures for important information about the performance shown prior to the inception of the Morgan Stanley Select UMA Program.The subsequent pages contain important disclosures and a glossary of terms. Information as of March 31, 2022, unless otherwise noted and is subject to change.Page 1 of 7
Columbia Select Large Cap Growth(MA) Strategy (CMP-A)Select UMAMANAGER'S INVESTMENT PROCESSRISK CONSIDERATIONS Through fundamental research, the manager seeks companies whichmeet growth, profitability and quality criteria Global companies which are technologically innovative are attractive tothe manager The manager looks for dominant companies in growth industries The manager seeks to maintain concentrated, low-turnover portfolioswhich can enhance returns and reduce taxes The manager will sell securities when long-term fundamentalsdeteriorate, or when they believe they have become unattractive relativeto other alternativesInvesting in securities entails risks, including: Equity portfoliosare subject to the basic stock market risk that a particularsecurity, or securities in general, may decrease in value. Growthinvesting does not guarantee a profit or eliminate risk. Thestocks of these companies can have relatively high valuations.Because of these high valuations, an investment in a growthstock can be more risky than an investment in a company withmore modest growth expectations. Value investing does notguarantee a profit or eliminate risk. Not all companies whosestocks are considered to be value stocks are able to turn theirbusiness around or successfully employ corrective strategieswhich would result in stock prices that do not rise as initiallyexpected. Bonds rated below investment grade may havespeculative characteristics and present significant risks beyondthose of other securities, including greater credit risk and pricevolatility in the secondary market. Investors should be careful toconsider these risks alongside their individual circumstances,objectives and risk tolerance before investing in high-yieldbonds. If a strategy expects to hold a concentrated portfolio of alimited number of securities, it should be noted that a decline inthe value of these investments would cause the portfolio’soverall value to decline to a greater degree than that of a lessconcentrated portfolio. As of 12/31/2021. Information as of 03/31/2022 is not yet available. As of 09/30/2019. Information as of 03/31/2022 is not yet available.PORTFOLIO'S ALLOCATION HISTORY (%) U.S. StocksNon-U.S. StocksCash/Cash he P/E used here is calculated by the harmonic mean. Total may not equal 100% due to rounding.***Index : Russell 1000 GrIf this profile shows related performance, see the section titled "Related Performance" in the disclosures for important information about the performance shown prior to the inception of the Morgan Stanley Select UMA Program.The subsequent pages contain important disclosures and a glossary of terms. Information as of March 31, 2022, unless otherwise noted and is subject to change.Page 2 of 7
Columbia Select Large Cap Growth(MA) Strategy (CMP-A)Select UMAMorgan Stanley Composite Start Date:Strategy Inception Date:06/2011 ³—AVERAGE ANNUAL TOTAL RETURN (%) - PERIODS ENDING 03/31/22RateRISK/RETURN ANALYSIS - 5 YEARS ENDING 03/31/22RateofReturnsofReturnsStandard Deviation (%)INVESTMENT RESULTSColumbia (Gross)Columbia (Net)Russell 1000 Gr90-Day 9RISK VOLATALITY (%)Columbia (Gross)Columbia (Net)Russell 1000 GrAnnual Rates of Return (%)2014 2015 2016 2017 TFOLIO'S QUARTERLY RETURNS (%)Quarter1Quarter2Quarter3Gross Net Gross Net Gross 2ofReturns19.91 19.26 -11.69 -12.2011.31 10.70 -0.54-1.12-0.32 -0.911.570.955.895.272.321.73-11.50 -12.104.784.1915.56 14.937.406.796.175.605.264.6522.08 21.464.503.92-15.26 -15.75 32.53 31.86-1.84 -2.4313.86 13.23-14.65 -15.21Related*04/01/17-12/31/179.428.77 -0.96 -1.5718.45 17.82 10.109.472.642.054.363.78-9.77 -10.289.929.327.737.15 -8.51 -9.084.293.704.934.327.386.76 -19.91 -20.44-5.47 -6.0214.64 14.0015.43 14.81 14.01 13.33-1.90 -2.460.680.13Select UMA**01/01/22-03/31/22Number OfColumbia (Gross)Columbia (Net)Russell 1000 GrQuarter4Gross NetUp Qtrs.141417Down Qtrs.663PORTFOLIO DIVERSIFICATION - R²(INCEPTION THROUGH 12/14) Columbia vs. Russell 1000 Gr Statistics are calculated using gross of fee performance only.R²0.8310 Year - Ending 03/31/222021 Annual Std. 7PORTFOLIO'S RISK STATISTICS - “ PERIODS ENDING03/31/22 ¹ ²3 Year5 YearStandard DeviationStandard Deviation of PrimaryBenchmarkSharpe RatioSharpe Ratio of PrimaryBenchmarkAlphaBetaDownside RiskR-SquaredTracking ErrorInformation .471. Statistics are calculated using gross of feeperformance only.2. Russell 1000 Gr was used as the primarybenchmark and the 90-Day T-Bills Index as therisk-free benchmark.3. For more information on these dates please seethe glossary of term sectionSee important notes and disclosures pages for a discussion of the sources of the performance data used to calculate the performance results and related analyses shown above.If this profile shows related performance, see the section titled "Related Performance" in the disclosures for important information about the performance shown prior to the inception of the Morgan Stanley Select UMA Program.The subsequent pages contain important disclosures and a glossary of terms. Information as of March 31, 2022, unless otherwise noted and is subject to change.Page 3 of 7
Columbia Select Large Cap Growth(MA) Strategy (CMP-A)Select UMACOMPOSITE DISCLOSURESThe disclosures provided below apply to performance information in this profile, if any. Pastperformance is not a guarantee of future results. Actual individual account results may differfrom the performance shown in this profile. There is no guarantee that this investment strategywill achieve its intended results under all market conditions. Do not rely upon this profile as thesole basis for your investment decisions.Performance results in this profile are calculated assuming reinvestment of dividends and income.Returns for more than one calendar year are annualized and based on quarterly data. Returns forperiods of less than a calendar year show the total return for the period and are not annualized. Norepresentation is being made that any portfolio will or is likely to achieve profits or losses similar tothose shown. Returns will fluctuate and an investment upon redemption may be worth more or lessthan its original value. Performance shown does not reflect the impact of fees and expenses of theunderlying mutual fund and ETFs, as applicable.Sources of Performance Results and Other Data: The performance data and certain otherinformation for this strategy (including the data on page 1 of this profile) may include one or more ofthe following: (i) the performance results of a composite of Morgan Stanley accounts managed by thethird party investment manager, (ii) the performance results for accounts and investment productsmanaged by the third party investment manager, in the same or a substantially similar investmentstrategy outside of the applicable Morgan Stanley program, and/or (iii) in the case of Model PortfolioStrategies, the Model Portfolio Provider’s results in managing accounts outside of the Morgan StanleySelect UMA program prior to Model Portfolio Strategy’s inception in the Morgan Stanley Select UMAprogram . For periods through June 2012, the Fiduciary Services program operated through twochannels – the Morgan Stanley channel and the Smith Barney channel and any performance andother data relating to Fiduciary Services accounts shown here for these periods is calculated usingaccounts in only one of these channels.) Please note that the Fiduciary Services program was closedon January 2, 2018. Although the Fiduciary Services and Select UMA programs are both MorganStanley managed account programs, the performance results and other features of similar investmentstrategies in the two programs may differ due to investment and operational differences. Performancein one program is not indicative of potential performance in the other. For example, the individualinvestment strategies in Select UMA program accounts may contain fewer securities, which would leadto a more concentrated portfolio. The automatic rebalancing, wash sale loss and tax harvestingfeatures of the Select UMA program, which are not available in Fiduciary Services, also could causedifferences in performance. In addition, any performance results included in this profile that are basedon a third party investment manager’s accounts that are not part of the Morgan Stanley programaccounts or institutional accounts that are part of the Model Portfolio strategy may differ due toinvestment and operational differences as well. As such, performance results of the third partyinvestment manager's composites and the third party Model Portfolio Strategies may differ from thoseof Select UMA accounts managed in the same or a substantially similar investment strategy. Forexample, in the case of Model Portfolio Strategies, Morgan Stanley, as the investment manager, maydeviate from the Third Party Model Portfolios.Related Performance:Columbia Management Investments's (Columbia) select large cap growth equity performance prior to4/1/1997 represents a composite of all fully discretionary, fee-paying select large cap growth equityaccounts that have a minimum of 250,000 in market value. Results have been calculated on atime-weighted basis and are weighted for the size of each portfolio. From 1/1/1996 to 3/31/1997, allresults include the cash and cash equivalents portion of the portfolios. From 1/1/1995 to 12/31/1995,the performance results shown represent only the equity portion of the portfolios included in the growthequity composite. The composite consisted of 170 accounts with a market value of 600.0 million as of3/31/1997.Morgan Stanley Performance:The composite consists of 275 account(s) with a market value of 40.4 million as of 03/31/2022. Inthis profile, the performance from July 1, 2011 through June 30, 2012 consists of accounts managedby the investment manager in this strategy in either the Morgan Stanley or the Smith Barney form ofthe Fiduciary Services program. From July 1, 2012 through December 31, 2015, performance consistsof all Fiduciary Services (FS) accounts managed by the investment manager in this strategy, subject toany other limitations stated in this profile. From January 1, 2016, performance consists of theperformance of all FS accounts (as described in the previous sentence) as well as the performance ofall single style Select UMA accounts managed by the investment manager in this strategy, subject toany other limitations stated in this profile. Performance composites calculated by Morgan Stanleyinclude all fee-paying portfolios with no investment restrictions. New accounts are included beginningwith the second full calendar month of performance. Terminated accounts are removed in the month inwhich they terminate (but prior performance of terminated accounts is retained). Performance iscalculated on a total return basis and by asset weighting the individual portfolio returns using thebeginning of period values.Gross Performance: Columbia’s gross results do not reflect a deduction of any investment advisoryfees or program fees, charged by Columbia or Morgan Stanley, but are net of commissions charged onsecurities transactions.Net Performance for all Periods: Net performance results reflect a deduction of 0.585% quarterly.This consists of three components: 0.5% maximum quarterly MS Advisory Fee and 0.0175% maximumquarterly Program Overlay Fee (which, together cover the services provided by Morgan Stanley), plus0.0675% quarterly SMA Manager Fees (being the fee currently charged by Columbia to new clients formanaging their assets in the Select UMA program). The SMA Manager Fees may differ from managerto manager, and managers may change their fee to new clients from time to time. If you select thismanager for your account, check the SMA Manager Fees specified in the written client agreement, incase these have changed since you received this profile. Historical net fees reflect the Advisory FeeSchedule as of October 1, 2018. Morgan Stanley program fees are calculated quarterly for theperformance illustrated in this profile, and have a compounding effect on performance. The MorganStanley program fee, which differs among programs and clients, is described in the applicable MorganStanley ADV brochure, which is available at www.morganstanley.com/ADV or on request from yourFinancial Advisor or Private Wealth Advisor. Document approval date February 2013.Focus List, Approved List, and Watch Status:If this profile shows related performance, see the section titled "Related Performance" in the disclosures for important information about the performance shown prior to the inception of the Morgan Stanley Select UMA Program.The subsequent pages contain important disclosures and a glossary of terms. Information as of March 31, 2022, unless otherwise noted and is subject to change.Page 4 of 7
Columbia Select Large Cap Growth(MA) Strategy (CMP-A)Select UMAGlobal Investment Manager Analysis ("GIMA") uses two methods to evaluate investment products inapplicable advisory programs. In general, strategies that have passed a more thorough evaluation maybe placed on the "Focus List", while strategies that have passed through a different and lesscomprehensive evaluation process may be placed on the "Approved List". Sometimes an investmentproduct may be evaluated using the Focus List process but then placed on the Approved List insteadof the Focus List.Investment products may move from the Focus List to the Approved List, or vice versa. GIMA may alsodetermine that an investment product no longer meets the criteria under either evaluation process andwill no longer be recommended in investment advisory programs (in which case the investmentproduct is given a "Not Approved" status).GIMA has a "Watch" policy and may describe a Focus List or Approved List investment product asbeing on "Watch" if GIMA identifies specific areas that (a) merit further evaluation by GIMA and (b)may, but are not certain to, result in the investment product becoming "Not Approved". The Watchperiod depends on the length of time needed for GIMA to conduct its evaluation and for the investmentmanager to address any concerns. GIMA may, but is not obligated to, note the Watch status in thisreport with a "W" or "Watch" on the cover page.For more information on the Focus List, Approved List, and Watch processes, please see theapplicable Morgan Stanley ADV brochure (www.ms.com/adv). Your Financial Advisor or Private WealthAdvisor can provide on request a copy of a paper entitled "GIMA: At A Glance ".ADDITIONAL DISCLOSURESActual account holdings, performance and other data will vary depending on the size of an account,cash flows within an account, and restrictions on an account. Holdings are subject to change daily. Theinformation in this profile is not a recommendation to buy, hold or sell securities.Actual portfolio statistics may vary from target portfolio characteristics.The Top Five Portfolio Holdings listed herein are provided for informational purposes only and shouldnot be deemed to be a recommendation to purchase or sell the securities mentioned. Portfoliocharacteristics in this profile are based on an allocation weight in the strategy model. There are noguarantees that any of the securities mentioned will be held in a client’s account. It should not beassumed that the securities transactions or holdings discussed were or will prove to be profitable.The Model Portfolio Provider or Investment Manager may use the same or substantially similarinvestment strategies, and may hold similar portfolios of investments, in other portfolios or products itmanages (including mutual funds). These may be available at Morgan Stanley or elsewhere, and maycost an investor more or less than this strategy in Morgan Stanley's Select UMA program.Overlay Managers or Executing Sub-Managers in some of Morgan Stanley’s Separately ManagedAccount programs may affect transactions through broker-dealers other than Morgan Stanley or ouraffiliates. If your manager trades with another firm, you may be assessed costs by the other firm inaddition to Morgan Stanley’s fees. Those costs will be included in the net price of the security, notseparately reported on trade confirmations or account statements. Certain managers have historicallydirected most, if not all, of their trades to outside firms. Information provided by managers concerningtrade execution away from Morgan Stanley is summarized s/pdfs/adv/sotresponse.pdf. For more informationon trading and costs, please refer to the ADV Brochure for your program(s), available atwww.morganstanley.com/ADV, or contact your Financial Advisor/Private Wealth Advisor.The portfolio may, at times, invest in exchange-traded funds (ETFs), which are a form of equitysecurity in seeking to maintain continued full exposure to the broad equity market.Morgan Stanley investment advisory programs may require a minimum asset level and, depending onyour specific investment objectives and financial position, may not be suitable for you. Investmentadvisory program accounts are opened pursuant to a written client agreement.Consulting Group’s unified managed account program, Select UMA, allows Financial Advisors tocombine separately managed accounts (SMAs), mutual funds and exchange-traded funds (ETFs)within a single investment advisory account for clients.Certain strategies managed or sub-advised by us or our affiliates, including but not limited to MorganStanley Investment Management and Eaton Vance Management and its investment affiliates, may beincluded in your account. Morgan Stanley Global Investment Manager Analysis evaluates certaininvestment products for the purposes of some – but not all – of Morgan Stanley Smith Barney LLC’sinvestment advisory programs. Please contact your Morgan Stanley team and/or see the applicableForm ADV, which can be accessed at www.morganstanley.com/adv, for information about affiliatedinvestment products that are not reviewed or evaluated by GIMA, as well as additional disclosuresapplicable to affiliated products, that could be included in this strategy.Diversification does not guarantee a profit or protect against a loss.No obligation to notifyMorgan Stanley has no obligation to notify you when information in this profile changes.Sources of informationMaterial in this profile has been obtained from sources that we believe to be reliable, but we do notguarantee its accuracy, completeness or timeliness. Third party data providers make no warranties orrepresentations relating to the accuracy, completeness or timeliness of the data they provide and arenot liable for any damages relating to this data.No tax adviceMorgan Stanley and its affiliates do not render advice on legal, tax and/or tax accounting matters toclients. Each client should consult his/her personal tax and/or legal advisor to learn about any potentialtax or other implications that may result from acting on a particular recommendation.Not an ERISA fiduciaryMorgan Stanley is not acting as a fiduciary under either the Employee Retirement Income Security Actof 1974, as amended, or under section 4975 of the Internal Revenue Code of 1986, as amended, inproviding the information in this profile. 2019 Morgan Stanley Smith Barney LLC Member SIPC.INDEX DESCRIPTIONSIf this profile shows related performance, see the section titled "Related Performance" in the disclosures for important information about the performance shown prior to the inception of the Morgan Stanley Select UMA Program.The subsequent pages contain important disclosures and a glossary of terms. Information as of March 31, 2022, unless otherwise noted and is subject to change.Page 5 of 7
Columbia Select Large Cap Growth(MA) Strategy (CMP-A)Select UMA90-Day T-BillsDividend a portion of a company's profit paid to common and preferred shareholders.The 90-Day Treasury Bill is a short-term obligation issued by the United States government. T-bills arepurchased at a discount to the full face value, and the investor receives the full value when theymature. The difference of discount is the interested earned. T-bills are issued in denominations of 10,000 auction and 1,000 increments thereafter.Dividend Yield annual dividend per share divided by price per share. Dividend Yield for the portfolio isa weighted average of the results for the individual stocks in the portfolio.Russell 1000 GrThe Russell 1000 Growth Index is representative of the U.S. market for large capitalization stockscontaining those companies in the Russell 1000 Index with higher price-to-book ratios and higherforecasted growth.Downside Risk is a measure of the risk associated with achieving a specific target return. Thisstatistic separates portfolio volatility into downside risk and upside uncertainty. The downsideconsiders all returns below the target return, while the upside considers all returns equal to or abovethe target return.Duration is a measure of price sensitivity expressed in years.S&P 500High Grade Corporate Bonds corporate bonds from issuers with credit ratings of AA or AAA.The S&P 500 Total Return has been widely regarded as the best single gauge of the large cap U.S.equities market since the index was first published in 1957. The index has over 5.58 trillionbenchmarked, with index assets comprising approximately 1.31 trillion of this total. The indexincludes 500 leading companies in leading industries of the U.S. economy, capturing 75% coverage ofU.S. equities. This index includes dividend reinvestment.Information Ratio is a measure of the investment manager's skill to add active value against a givenbenchmark relative to how stable that active return has been. Essentially, the information ratio explainshow significant a manager's alpha is. Therefore, the higher the information ratio, the more significantthe alpha.Indices are unmanaged and have no expenses. You cannot invest directly in an index.Investment Grade Bonds are those rated by Standard & Poor's AAA (highest rated), AA, A or BBB (orequivalent rating by other rating agencies or, in the case of securities not rated, by the investmentmanager).GLOSSARY OF TERMSAlpha is a mathematical estimate of risk-adjusted return expected from a portfolio above and beyondthe benchmark return at any point in time.Morgan Stanley Composite Start Date is the date when Morgan Stanley was able to start tocalculate the composite performance of the strategy using qualifying advisory accounts.American Depositary Receipts (ADRs) are receipts for shares of a foreign-based corporation held inthe vault of a U.S. bank.Performance Inception Date is the date that the Investment Advisor started to calculate theperformance of the strategy.Average Portfolio Beta is a measure of the sensitivity of a benchmark or portfolio's rates of return tochanges against a market return. The market return is the S&P 500 Index. It is the coefficientmeasuring a stock or a portfolio's relative volatility.Program Inception Date is the date that the strategy was launched into the Select UMA program.Beta is a measure of the sensitivity of a portfolio's rates of return to changes in the market return. It isthe coefficient measuring a stock or a portfolio's relative volatility.Bottom-Up Stock Selection Emphasis primarily on individual stock selection. Considerations ofeconomic and industry factors are of secondary importance in the investment decision-makingprocess.Capitalization is defined as the following: Mega (Above 100 billion), Large ( 12 to 100 billion),Medium ( 2.5 - 12 billion), Small ( .50 - 2.5 billion) and Micro (below .50 billion).Distribution Rate is defined as the most recent distribution paid, annualized, and then divided by thecurrent market price. Distribution rate may consist of investment income, short-term capital gains,long-term capital gains, and /or returns of capital.Price/Book Ratio (P/B) weighted average of the stocks' price divided by book value per share. Bookvalue per share is defined as common equity, including intangibles, divided by shares outstandingtimes the adjustment factor.Price/Cash Flow Ratio a ratio used to compare a company's market value to its cash flow. It iscalculated by dividing the company's market cap by the company' operating cash flow in the mostrecent fiscal year (or the most recent four fiscal quarters); or, equivalently, divide the per-share stockprice by the per-share operating cash flow.Price/Earnings Ratio (P/E Ratio) shows the multiple of earnings at which a stock sells. Determinedby dividing current stock price by current earnings per share (adjusted for stock splits). Earnings pershare for the P/E ratio are determined by dividing earnings for past 12 months by the number ofcommon shares outstanding. The P/E ratio shown here is calculated by the harmonic mean.If this profile shows related performance, see the section titled "Related Performance" in the disclosures for important information about the performance sh
Columbia Management Investment Advisers, LLC PORTFOLIO STATISTICSSTRATEGY OVERVIEW Columbia Index*** Columbia -----03/22----- 09/21 Number of security holdings 33 499 35 . Columbia Management Capital Advisers may differ from assets under management for CMIA.Columbia Management Investments's (Columbia) Columbia Select Large Cap Growth(MA .