Transcription
Marine Biology (2021) IGINAL PAPERDietary analysis of two sympatric marine turtle species in the easternMediterraneanJosie L. Palmer1 · Damla Beton2 · Burak A. Çiçek3,4 · Sophie Davey2 · Emily M. Duncan1 · Wayne J. Fuller1,2,5 ·Brendan J. Godley1 · Julia C. Haywood1 · Mehmet F. Hüseyinoğlu6 · Lucy C. M. Omeyer1 · M. Jesse Schneider1,7 ·Robin T. E. Snape1,2 · Annette C. Broderick1Received: 3 November 2020 / Accepted: 23 April 2021 / Published online: 25 May 2021 The Author(s) 2021AbstractDietary studies provide key insights into threats and changes within ecosystems and subsequent impacts on focal species. Dietis particularly challenging to study within marine environments and therefore is often poorly understood. Here, we examinedthe diet of stranded and bycaught loggerhead (Caretta caretta) and green turtles (Chelonia mydas) in North Cyprus (35.33 N,33.47 E) between 2011 and 2019. A total of 129 taxa were recorded in the diet of loggerhead turtles (n 45), which werepredominantly carnivorous (on average 72.1% of dietary biomass), foraging on a large variety of invertebrates, macroalgae, seagrasses and bony fish in low frequencies. Despite this opportunistic foraging strategy, one species was particularlydominant, the sponge Chondrosia reniformis (21.5%). Consumption of this sponge decreased with increasing turtle size. Agreater degree of herbivory was found in green turtles (n 40) which predominantly consumed seagrasses and macroalgae(88.8%) with a total of 101 taxa recorded. The most dominant species was a Lessepsian invasive seagrass, Halophila stipulacea (31.1%). This is the highest percentage recorded for this species in green turtle diet in the Mediterranean thus far. Withincreasing turtle size, the percentage of seagrass consumed increased with a concomitant decrease in macroalgae. Seagrasswas consumed year-round. Omnivory occurred in all green turtle size classes but reduced in larger turtles ( 75 cm CCL)suggesting a slow ontogenetic dietary shift. Macroplastic ingestion was more common in green (31.6% of individuals) thanloggerhead turtles (5.7%). This study provides the most complete dietary list for marine turtles in the eastern Mediterranean.Responsible Editor: L. Avens.Reviewers: Undisclosedexperts.* Josie L. Palmerjlp231@exeter.ac.uk1Marine Turtle Research Group, Centre for Ecologyand Conservation, University of Exeter, Penryn, UK2Society for Protection of Turtles, Levent Daire 1, UlusSokak, Gönyelli, North Cyprus3Underwater Research and Imaging Centre, BiologicalSciences Department, Eastern Mediterranean University,99628, Famagusta, North Cyprus4Department of Biological Sciences, Faculty of Artsand Sciences, Eastern Mediterranean University, 99628,Famagusta, North Cyprus5Faculty of Veterinary Medicine, Near East University,Nicosia, North Cyprus6Faculty of Maritime Studies, University of Kyrenia, ŞehitYahya Bakır Sokak, Karakum, Girne, North Cyprus7Abess Center for Ecosystem Science and Policy, Universityof Miami, Coral Gables, FL, USAIntroductionStudies into the foraging ecology of marine organismsare logistically difficult due to the challenges of samplinganimals in the marine environment (Newsome et al. 2010;Komoroske et al. 2017; Wildermann et al. 2018; Green et al.2020). Recent technological advancements, such as satellitetracking and stable isotope analysis, have allowed elusive lifestages to be studied over extended periods of time, providing valuable information, such as the location of foraginggrounds, trophic level, and timing of ontogenetic dietaryshifts (Cardona et al. 2010; Abascal et al. 2016; Haug et al.2017; Andrews-Gof et al. 2018; Haywood et al. 2019, 2020a,b). Direct methods, such as gut content analysis (Bowenand Iverson 2013) or DNA meta-barcoding (Schwarz et al.2018), enable a more detailed understanding of diet andaccount for variation within and among species and differentdemographics (Vander Zanden et al. 2010; Thomson et al.2018), which can highlight differential threats among thesegroups.13Vol.:(0123456789)
94 Page 2 of 16Although long-term conservation efforts have seenmarine turtle populations begin to recover from historicdeclines (Mazaris et al. 2017), the majority are still impactedby numerous threats and their long-term persistence remainsconservation-dependent (Casale et al. 2018). Interactionwith fisheries is a leading cause of mortality of marine turtles worldwide (Lewison et al. 2014), and differing habitatuse among demographic groups has been shown to influence susceptibility to some fishing techniques (Wallace et al.2008; Casale 2011; Snape et al. 2013). Monitoring theseresponses to environmental change along with others, suchas exposure to plastic ingestion (Duncan et al. 2019) andarrival and monitoring of invasive species (Özdilek et al.2015), can be achieved through long-term dietary studies.Indeed, marine turtles are now used as bio-indicators formonitoring plastic pollution across the Mediterranean Seathrough gut contents analysis (INDICIT Consortium 2018).The Mediterranean basin is a critical region for greenand loggerhead turtles, hosting one and two regional management units for each species, respectively (Wallace et al.2011). Yet, it is one of the most understudied areas in relation to marine turtle diet, particularly for green turtles(Casale et al. 2018). Typically, marine turtles first have anobligate epipelagic-oceanic stage for 3 to 10 years (Reichet al. 2007; Casale et al. 2008; Lazar et al. 2008a), followedby a transitional stage where habitat shifts are facultativebefore recruiting to neritic habitats (Casale et al. 2008). Loggerhead turtles are widely considered opportunistic foragers (Bjorndal and Jackson 2003; Casale et al. 2008; Lazaret al. 2008a) with increasing prevalence of benthic prey withbody size (Bjorndal 1997) due to improved diving capacity and buoyancy control (Musick and Limpus 1997) andincreased bite force allowing access to harder prey items(Marshall et al. 2012). Green turtles are omnivorous foragers in their early life stages and thereafter tend to undergoan ontogenetic dietary shift to a predominantly herbivorousdiet upon recruitment to neritic habitats (Reich et al. 2007;Arthur et al. 2008; Reisser et al. 2013; Stringell et al. 2013).However, recent research suggests levels of omnivory maybe influenced by sea surface temperatures, where dietaryanimal matter features prominently in colder temperaturesat higher latitudes ( 20 C for 6 months annually; Estebanet al. 2020) with the degree of omnivory varying spatiallyand seasonally by region.Loggerhead turtle diet varies markedly across the Mediterranean Sea (Laurent and Lescure 1994; Godley et al.1997; Tomás et al. 2001; Bentivegna et al. 2003; Lazar et al.2008a) and includes fish, crustaceans, pelagic tunicates,molluscs, anemones and sea urchins (Tomás et al. 2001;Casale et al. 2008; Lazar et al. 2008a). Mediterranean greenturtles have been reported to feed on the seagrass Cymodocea nodosa (Demetropoulus and Hadjichristophorou 1995;n 3), Posidonia oceanica and Zostera sp. (Durmuş 1998;13Marine Biology (2021) 168:94n 1) as well as Lessepsian invasives, namely the seagrassHalophila stipulacea, and the green algae Caulerpa taxifolia (Özdilek et al. 2015; n 1). These are just two of manyhundreds of Lessepsian invasive species already recorded inthe Mediterranean (Katsanevakis et al. 2014).Stranding and bycatch records in the eastern Mediterranean demonstrate the presence of widespread neriticforaging grounds for both loggerhead and green turtles,predominantly for juveniles, around North Cyprus (Snapeet al. 2013), Turkey (Başkale et al. 2018; Türkozan et al.2018), Israel (Tikochinski et al. 2019), Egypt (Clusa et al.2014) and Greece (Corsini-Foka et al. 2013). Although yearround strandings and bycatch occur in North Cyprus, thecoastline also supports major nesting beaches used by bothmarine turtle species (Stokes et al. 2014; Casale et al. 2018),resulting in seasonal peaks of adult strandings and bycatchin summer months (Snape et al. 2013). Owing to ongoingengagement with collaborating small-scale fishers, much ofthe bycatch is reported directly through the Society for theProtection of Turtles (SPOT), providing opportunities todirectly access diet of recently captured turtles, includinghighly understudied demographic groups. This study aimedto conduct a detailed gut contents analysis of marine turtlesacross North Cyprus to (1) quantify the relative contribution and variability of dietary taxa, (2) investigate dietarychange with body size (CCL), (3) assess the prevalence ofLessepsian invasives within diet and (4) quantify macroplastic presence.Materials and MethodsStrandings, Bycatch Collection, and NecropsyFrom June 2011 to August 2019, 47 beaches across NorthCyprus were monitored on foot for turtle strandings: every1–3 days during the turtle nesting season (May–October)and monthly otherwise. Strandings were also reported bymembers of the public and bycaught turtles by local fishermen through a bycatch monitoring initiative. All bycaughtturtles originated from within the EEZ of Cyprus. Livecaught turtles were immediately released if healthy; thosethat were already dead, or which died within 24 h of capture,and which received no feeding during rehabilitation werenecropsied. Curved carapace length (CCL; notch-to-notch,Bolten 1999) was measured with a flexible tape measureas an indication of body size; where notch-to-notch measurements were not available, notch-to-tip measurementswere converted using species-specific linear regressionscalculated from nesting females and strandings betweenMay and June 2018 (Supplementary Material S1). Bodydecomposition was assessed using a scale comprising thefollowing categories: alive, fresh, partial decomposition,
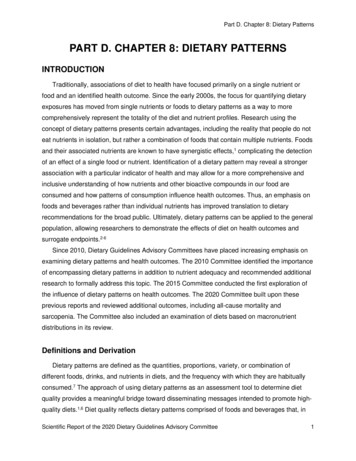
Page 3 of 16 94Marine Biology (2021) 168:94advanced decomposition, and mummified (INDICIT Consortium 2018); gut contents analysis was only conductedon individuals of fresh or partial body decomposition. Sexwas ascertained by tail length (Casale et al. 2005) and grossmorphology of the gonads (Lazar et al. 2008b).Gut Content Sample Collection and AnalysisGut contents of 46 loggerhead and 39 green turtles werecollected and analysed. Gastrointestinal tracts were removedand separated into three sections: oesophagus, stomach andintestine. Identifiable dietary content and macroplastics(those visible to the naked eye) were removed from eachsection. Ingesta was then filtered through a 1 mm sieve usingwater and remaining contents were collected for identification. Unidentifiable items within the intestines that couldnot be separated were combined, weighed and percentagecomposition estimated (Supplementary Material S2). Dietary items were categorised into nine taxonomic groups:seagrass, macroalgae, sponge, cnidaria, other invertebrates,bony fish, unknown biological matter, macroplastic, anddebris (only wood and sediment were identified). Dietaryitems were sorted and identified to the lowest taxonomiclevel possible within these taxonomic groups using a varietyof reference materials as well as consultation with specialists. As some items could not be identified to the same levelof accuracy, the term ‘taxa’ is used to refer to individualdietary items observed and encompasses items identifiedfrom phyla to species level throughout. Dietary items wereblotted, and wet mass of each taxa was measured to the nearest 0.1 g; 0.1 g was considered a trace amount. If present,macroplastics were cleaned, dried and dry mass recorded.This process was completed for all gastrointestinal sections.Dietary composition was compared between the oesophagus, stomach, and intestines for samples collected between2011 and 2018 to assess the inclusion of intestinal content infurther analyses. No difference in dietary composition wasfound among sections (Supplementary Material S3). Due tothe bias towards hard-bodied intestinal content and elevateddigestion state precluding correct identification, the intestines were excluded from all analyses except the analysis ofmacroplastics ingestion with size, as they are often found inthe largest quantities here (Matiddi et al. 2017) and persistin a non-degraded state (Clukey et al. 2017; Duncan et al.2019). As no differences were found in dietary compositionbetween gut sections, the oesophagus and stomach were subsequently combined for all further analyses. Reproductivestatus was not investigated due to the small sample size ofadult-sized individuals in both turtle species.Nine loggerhead and two green turtles had not beenforaging prior to death; the oesophagus and stomach wereeither empty or contained low levels of solid anthropogenicwaste only (Supplementary Material S4). These turtles wereexcluded from all dietary analyses as the cause for not foraging prior to death could not be established.Statistical AnalysesAll analyses were carried out in RStudio Desktop v.3.6.3 (R Core Team 2020) and the significance level wasalpha 0.05 throughout. For full details of statistical analyses and R-packages used, see Supplementary Material S5.While loggerhead and green turtles present markedly different size distributions, within species, most individualsare of a similar CCL, except for one small loggerhead turtle(Fig. 1a) and several large green turtles (Fig. 1b). To ensurethese individuals did not bias models investigating the relationship of CCL with main dietary groups, Z-scores werecalculated for all individuals to check for outliers in CCL.Only one loggerhead turtle had a Z-score of 4.88 exceeding the recommend threshold value of 3 (Shiffler 1988)and was subsequently removed from all further analyses.Loggerhead and green turtles were analysed separately dueto distinct differences in dietary composition and body sizeranges. Sample accumulation curves were plotted for bothturtle species (see Supplementary Material S5 and Fig. S5.1)to assess how representative dietary sampling was.Dietary taxa biomass was standardised by total oesophagus and stomach content mass (mean relative percentagebiomass) to account for differences in gastrointestinal fullness from turtles of varying body sizes. Frequency of occurrence (FO) was calculated as the percentage of individuals where a species or dietary group was present. Index ofRelative Importance (IRI) values (von Brandis et al. 2014)were calculated as a combined measure of mean biomassand frequency of occurrence (Supplementary Material S5).Ontogenetic dietary shifts were examined using CCLon a continuous scale throughout due to variability in sizeat sexual maturity across Mediterranean rookeries (Casaleet al. 2018). Indications of nesting female sizes for NorthCyprus are displayed in Fig. 1 for context.ResultsOf the 45 loggerhead turtles sampled, 21 were bycaughtand 24 were strandings and of the 40 green turtles, 19were bycaught and 21 were strandings. Of these, for loggerhead turtles, there were 20 females, 18 males and 7of undetermined sex and, for green turtles, there were 18females, 7 males and 15 of undetermined sex. Mean CCLwas X SD 63.4 9.3 cm for loggerhead turtles (range18.8–82.3, n 44, Fig. 1a), and X SD 38.5 17.1 cm forgreen turtles (range 26–89, n 40, Fig. 1b).A combined total of 202 dietary taxa were recordedincluding 38 species and 15 families (Supplementary13
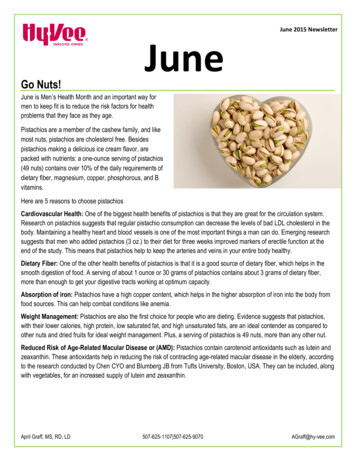
94 Page 4 of 16Marine Biology (2021) 168:94Fig. 1 Body size of studyanimals. Minimum curvedcarapace length (cm) ofstranded and bycaught (a) loggerhead (n 44) and (b) greenturtles (n 40) sampled forgut contents in North Cyprusbetween 2011–2019, in 5 cmincrements where for eachcategory, individuals includedare greater than or equal to thelower CCL boundary and lessthan the upper CCL boundary. Individuals found withmacroplastic in their gastrointestinal tract are coloured darkgrey. Dashed lines indicate theminimum (black) and mean(blue) nesting female size forAlagadi Beach, North Cyprusbetween 2011–2019; loggerhead (minimum: 59 cm;mean: X SD 71.8 4.0 cm,n 266) and green turtles(minimum: 73.3 cm; mean:X SD 87.5 5.7 cm, n 406)Material S6). Of the 38 species recorded, a total of 3 invasive species were identified, namely Halophila stipulacea,Caulerpa taxifolia and Caulerpa cylindracea which werefound in both turtle species. There was little overlap in dietbetween marine turtle species where only 23 taxa wereshared, including 12 species and 4 families. The diet of loggerhead turtles was more diverse with 129 different taxaobserved compared to 101 taxa in green turtles. All dietarygroups widely ranged in biomass in both turtle species,highlighting marked individual variation (Table 1), with themost diverse groups being macroalgae and miscellaneousinvertebrates.Dietary composition significantly differed between turtle species (ANOSIM, R 0.410, n 73, p 0.001; Fig. 2)which were 92.6% dissimilar. A SIMPER analysis showedthat seagrasses, macroalgae, miscellaneous invertebrates andsponges contributed the most to these differences explaining 30.1%, 16.8%, 19.7% and 12.5% of the dissimilarity,respectively. No differences were found between sexes ineither loggerhead (ANOSIM, R 0.01, n 29, p 0.29) orgreen turtles (ANOSIM, R 0.01, n 24, p 0.52). Therewas also no difference found in dietary composition betweenstranded and bycaught turtles for either loggerhead (ANOSIM, R 0.03, n 35, p 0.86) or green turtles (ANOSIM, R 0.02, n 38, p 0.20) and therefore stranded andbycaught turtles were analysed collectively throughout thestudy.13Loggerhead turtles exhibited a higher ingestion of debris(4.6% of biomass, predominantly wood) and omnivory(72.1% animal matter, 7.9% plant matter, 15.4% of unknownorigin, by biomass; Fig. 2a, b) than green turtles. The majority of dietary biomass consisted of invertebrates includingsponges, cnidarians, crustaceans, molluscs, echinoderms(e.g., Holothuria sp.), polychaetes, and sea cucumbers(62.2%). Piscivory was also observed in 5 individuals ranging from 58 to 72 cm CCL in size, 2 were stranded and3 were bycaught, contributing 9.6% to dietary biomass onaverage. Most loggerhead dietary items had low contributions to relative biomass as well as low consumption frequencies; only two taxa had IRI scores 1, namely Chondrosia reniformis, a sponge, and the seagrass Posidoniaoceanica with scores of 8 and 2, respectively. These alsohad the greatest contribution to overall biomass at 21.5%and 6.1%, respectively. A species of migratory butterfly, thepainted lady (Vanessa cardui), was also identified in oneindividual in trace amounts.Green turtle diet was predominantly herbivorous (88.8%plant matter, 9.8% animal matter, 1.3% of unknown originby biomass; Fig. 2c, d), however evidence of omnivory,particularly in smaller size classes, was observed wherebony fish were consumed (5.0%), as well as miscellaneousinvertebrates (2.4%), such as Ligia italica, sponges (2.2%)and cnidarians (0.2%) (Table 1). Bony fishes were foundexclusively in stranded green turtles (n 3), ranging in sizefrom 32 to 57 cm CCL. Overall, seagrasses were the most
Page 5 of 16 94Marine Biology (2021) 168:94Table 1 Dietary group composition of loggerhead (n 35) and green turtles (n 38) in North CyprusDietary groupLoggerhead turtleFOSeagrassMacroalgaeaSpongeCnidariabOther invertebratescBony 4.334.317.15.7IRI2 19 12324 1 1Taxa34128477182–Green turtleFO% of biomassMean 198.8*92.178.95.22.665.87.928.910.531.6IRI7313 1 1 1 1 1 1 1Taxa5412139381–% of biomassMean 0.8Percentage frequency of occurrence (FO), Index of Relative Importance (IRI), number of taxa (ranging from phylum to species level), meanrelative percentage of biomass SE, minimum and maximum values of dietary groups are shown (see Supplementary Table S3.1 for individualtaxa summaries)– NA values*Values 0.1abcChlorophyta, Ochrophyta, RhodophytaAnthozoa, gelatinous macroplanktonCrustacea, Mollusca, Polychaeta, Holothuroidea, Echinodermatadominant group, both collectively and individually, demonstrating both the highest percentage frequency of occurrence (92.1%) and mean percentage contribution to biomass(57.4%). A variety of macroalgae were consumed includingH. scoparia and the invasive algae C. cylindracea, as wellas Gelidium spinosum var hystrix being the most dominant(8.7%, 8.2%, and 6.3% of biomass, respectively). The seagrasses H. stipulacea and P. oceanica had both the highest contributions to overall biomass at 31.1% and 16.5%,respectively, as well as the highest IRI scores of 29 and10. Only two other dietary species had IRI scores 1, theseagrass Zostera noltii and the green algae C. cylindraceaboth with scores of 2 (Supplementary Material S6). Greenturtles also consumed terrestrial invertebrates with a grasshopper, a beetle and a black fly consumed in trace quantities (0.4%, 0.1%, 0.1% of biomass, respectively), eachobserved once in 3 different turtles, but were not identifiedto species level.Several breeding individuals were sampled across bothstudy species, 3 loggerhead and 2 green turtles. Of these,2 loggerhead turtles were female and 1 male with CCLs of67 cm, 67.4 cm, and 82.3 cm, respectively, and both greenturtles were female and were 86 cm and 89 cm CCL. Allloggerhead turtles showed little evidence of foraging priorto death with on average 0.22 0.34 g (range 0.00–0.61 g)of dietary content found. There was considerably more variation in the green turtles, with 1006 g and 281 g of dietarycontent found which predominantly consisted of seagrass(99.99% and 39.5%) and macroalgae (0.0% and 52.8%).Generally, no clear seasonal or annual trends wereobserved in the main dietary groups of loggerhead (Fig. 3a,c) or green turtles (Fig. 3b, d) when considering percentage consumption. This was also true in the case of annualvariation in both turtle species (Fig. 3c, d). The percentageof sponges consumed decreased in larger loggerhead turtles (GAM, F 1.40, n 34 p 0.16), whereas other invertebrates increased in larger-size classes (GAM, F 3.69,n 34, p 0.03; Fig. 3c; Supplementary Table S7.1). Thepercentage of seagrass consumption was greater in largergreen turtles (GAM, F 3.81, n 38, p 0.04), whilstmacroalgae decreased (GAMM, F 2.18, n 38, p 0.08;Fig. 3d) and bony fish consumption peaked in mid-sizeclasses (GAMM, F 5.19, n 38, p 0.02; SupplementaryTable S7.1).As changes in percentages of one group may be confounded by another, the previous analyses were repeatedusing mass (g). Some seasonal variation is shown in alldietary groups across both turtle species (SupplementaryFig. S7.1A, B) with increases in the summer months. Massof seagrass consumed in green turtles significantly increasedwith CCL (GAM, F 170.72, n 38, p 0.001) as did otherinvertebrates in loggerhead turtles (GAM, F 13.82, n 34,p 0.001; Supplementary Table S7.2; Supplementary Fig.S7.1).As a dominant dietary item as well as an invasive species, H. stipulacea was examined separately in green turtlesagainst month, year and CCL to identify any associationswith certain life stages or temporal trends. No discernible13
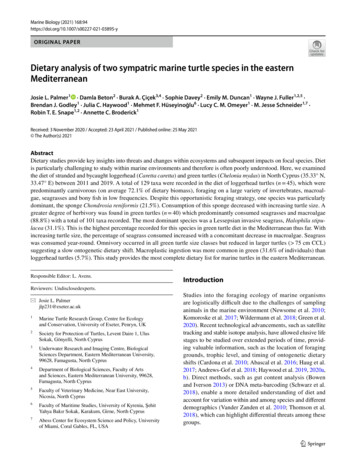
94 Page 6 of 16Marine Biology (2021) 168:94Fig. 2 Dietary composition of loggerhead and green turtles. Meanrelative percentage contribution of each dietary group to biomass ofeach species is shown. For clarity, an enlargement of (a) loggerhead(n 35) and (c) green turtles (n 38) between 0–10% is shown in (b)and (d), respectively. Images of main, and noteworthy dietary speciesare shown. Note the different y axes scalespatterns were observed with month with either percentageor mass of H. stipulacea consumed (Supplementary Fig.S7.2A, B). There was a decreasing annual trend when bothpercentage and mass were examined (Supplemental Fig.S7.2C, D). No effect was observed between CCL and percentage (GLM, F 0.003, n 20, p 0.96; SupplementaryFig. S7.2E) but there was a positive effect between CCLand mass (GLM, F 35.80, n 20, p 0.001; Supplementary Fig. S7.2F).Neither species richness nor Simpsons Diversity Index ofdietary content was influenced by CCL in loggerhead (GLM,𝜒 21 0.66, n 34, p 0.42, Fig. 4a; GLM, F 0.90, n 34,p 0.35; Fig. 4c) or green turtles (GLM, 𝜒 21 1.58, n 38,p 0.21, Fig. 4b; GLM, F 0.09, n 38, p 0.76; Fig. 4d).Macroplastic ingestion was more common in green(31.6%) than loggerhead turtles (5.7%) and was also foundin larger quantities, whilst accounting for differences dueto CCL (X SD 0.72 2.21 g, range: 0–12.3 g, andX SD 0.02 0.13 g, range: 0–0.8 g, respectively; GLM,F 14.88, n 73, p 0.001). Although a positive correlationwas observed between plastic ingestion and cnidaria in loggerhead turtles (RS 0.53, n 35, p 0.001; SupplementaryMaterial S8), visual examination confirmed this relationshipwas unclear and centred around two individuals. All othertaxonomic groups showed no correlations with plastic ineither turtle species.13DiscussionThis study provides the most detailed dietary informationon marine turtles in the eastern Mediterranean thus far andis the first to compare the diet of the two sympatric species in the region. Dietary composition was significantlydifferent between loggerhead and green turtles, confirmingniche separation. A wide diversity of taxa were recorded
Page 7 of 16 94Marine Biology (2021) 168:94including those that were unique to one and common to bothspecies. High consumption of Lessepsian invasive speciesand a greater rate of plastic ingestion was shown in greenturtles. Diet varied markedly from previous studies andother regions of the Mediterranean, highlighting the needfor long-term local studies to monitor change and informmanagement.Loggerhead Turtle DietLoggerhead turtles were found to have an omnivorous andmore varied diet than green turtles, foraging on predominantly benthic items, such as the sponge Chondrosia reniformis and the bivalve Spondylus gaederopus, occurringfrom the surface down to 60 m (Bavestrello et al. 1996) andfrom 4 to 200 m depth (Demir 2003), respectively. Markedindividual variation between loggerhead turtles was evidentfrom low IRI scores. This supports the well-establishedtheory of opportunistic foraging (Casale et al. 2008) andlarge isotopic niches found in regional stable isotope analysis(Haywood et al. 2020a). Studies in other regions of the Mediterranean Sea show some similarity, but the main constituent dietary groups vary (Laurent and Lescure 1994; Godley et al. 1997; Tomás et al. 2001; Bentivegna et al. 2003;Lazar et al. 2008a). Sponges and other invertebrates weredominant in the present study compared with crustaceans,gastropods and sea urchins in the central Mediterranean(Casale et al. 2008), sponges and sea urchins in the northern Adriatic (Lazar et al. 2002), and fish, pelagic tunicates,crustaceans, molluscs and other invertebrates in the westernMediterranean (Tomás et al. 2001). Percentage consumptionof sponges consumed seemed to vary seasonally, decreasing between April-September, possibly driving the seasonalshifts in carbon stable isotope ratios found in this region(Haywood et al. 2020a). In the North Adriatic, percentagecover of C. reniformis is highest in autumn months and lowest in spring (Di Camillo et al. 2011) and although furthernorth than the current study, supports seasonal abundance asan explanation of the peaks in sponge consumption observedhere.Sponges, and more specifically C. reniformis, have previously been identified as a major component of loggerheadturtle diet in the Mediterranean but were similarly found inan undigested state throughout the gut (Steuer 1905; Laurentand Lescure 1994; Lazar et al. 2002; Casale et al. 2008).Loggerhead turtle stomach morphology differs to that ofhawksbill turtles, a well-known sponge specialist (Meylan1988; Stringell et al. 2016), and it has been suggested thatthey are unlikely to obtain much nutrition from sponges,likely obtaining bacterial fauna or trace elements instead(Laurent and Lescure 1994; Casale et al. 2008). Similarly,Posidonia oceanica was another dominant species found inloggerhead turtle gut contents. Whilst P. oceanica beds areclearly frequented, its presence in their gut contents doesnot necessarily indicate that it is a dietary item. The gutmicrobiome of loggerhead turtles does contain anaerobicbacteria capable of fermenting carbohydrates (Arizza et al.2019), such as Ruminococcacea and Lachnospiracea (Boutard et al. 2014) which are also found within green turtleguts (Ahasan et al. 2018; Campos et al. 2018). However,digestibility of structural carbohydrates in loggerhead turtlesis largely unknown requiring further experimental work toclarify. Considering the undigested state of P. oceanica inthe present study as well as in others (Casale et al. 2008),alternative explanations for its presence such as incidentalingestion while feeding on other animal prey species aremore likely.Green Turtle DietGreen turtles were predominantly herbivorous where agreater incidence of omnivory was observed in juveniles—some had solely fed on animal matter—which shifted tonear exclusive herbivory in adults as has been previouslyshown in the Mediterranean (Özdilek and Aureggi 2006;Lazar et al. 2010; Karaa et al. 2012). Throughout all-sizeclasses, green turtles exhibited higher levels of herbivorythan loggerhead turtles. Seagrass consumption was consistent throughout the year suggesting year-round dependencewith potential seasonal peaks during summer months. Thehighest percentage cover and above-ground biomass of Halophila stipulacea, occurs in autumn around Cyprus (Nguyenet al. 2020) which coincides with a summer peak.Dietary preferences of green turtles are known to varyregionally, with some populations specia
1 Marine Turtle Research Group, Centre for Ecology and Conservation, University of Exeter, Penryn, UK 2 Society for Protection of Turtles, Levent Daire 1, Ulus Sokak, Gönyelli, North Cyprus 3 Underwater Research and Imaging Centre, Biological Sciences Department, Eastern Mediterranean University, 99628, Famagusta, North Cyprus