Transcription
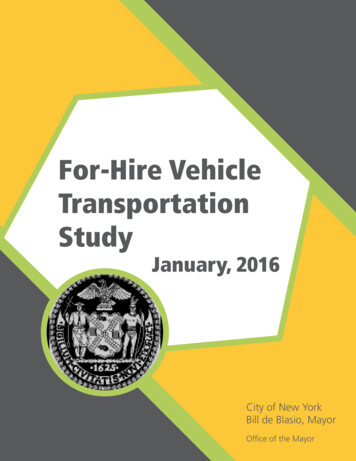
For-Hire VehicleTransportationStudyJanuary, 2016City of New YorkBill de Blasio, MayorOffice of the Mayor
I. INTRODUCTIONIn the last several years, the ubiquity of mobile phones,and the rise of new platforms for getting and givingrides have increased the complexity of New York’stransportation system. With the arrival and rapid growthof new types of on-demand for-hire vehicle services,the City has sought to answer fundamental questionsabout the potential impact of these changes on keypriorities: managing the efficient movement of goodsand services across the City, particularly in Manhattan’scongested Central Business District (CBD), supporting acomprehensive and sustainable transportation system,promoting equitable growth, and ensuring safety fordrivers and passengers.New York City is committed to offering a reliable, safe,accessible, and comprehensive transportation systemthat promotes the public good and meets the needsof all New Yorkers across all five boroughs. The Citymust make sure that residents and visitors have arange of appealing transportation options, that thestreets are safe, that passengers are protected fromfraud and abuse, and that those who work to providetransportation have fair and sustainable workingconditions and income opportunities. While doing so,the City must take steps to ensure that its transportationsystem is accessible to all, regardless of individual ability.For-Hire Vehicles are a Vital Part of NewYork City’s Transportation MixFor-hire vehicles (FHVs) -- yellow and green taxis,livery cars, traditional black car services, and the fastgrowing app-based car services like Uber and Lyft -are an important part of the City’s transportation mix.Paid transportation market snapshotAnnual paid trips by modeMillions of trips, 2014Most New Yorkers get around using subways orbuses. Public transit makes up the largest part of ourtransportation system by ridership, but taxi and liveryservices have long played a significant role. New YorkCity has the lowest rate of private car ownership in thenation and the highest utilization of for-hire services.Every day hundreds of thousands of New Yorkers andtourists take trips in for-hire vehicles, relying on them toget to work, school, medical appointments, to and fromthe airports, and other destinations.From the iconic yellow medallion taxis clustered incentral Manhattan, to neighborhood car services foundin communities across the Bronx, Brooklyn, Queens, andStaten Island, the industry has grown and changed tomeet a wide range of customer needs. At the highend, there are limousines and premium black car servicesthat largely work for corporate accounts. In the midrange value are yellow and green cabs, hailed on thestreet throughout the five boroughs. There are also smallneighborhood livery companies, whose costs are oftenlowest and conduct many of their transactions in cash.In the last three years, the landscape of for-hire servicehas changed considerably due to the rise of app-basedelectronic dispatch (or e-dispatch) services, such as Uberand Lyft, that allow customers to request vehicles ontheir smartphones.The City’s Regulation of For-Hire VehiclesFor-hireservices235Bus793Although subway and bus trips significantly outnumberfor-hire vehicle trips, for-hire vehicles provide someservices that the mass transit system cannot. ManyNew Yorkers use for-hire vehicles when subway or buslines are too far away from their home or destination orwhen mass transit is perceived as too slow or requirestoo long a wait. In addition to convenience and speed,passengers may also select for-hire vehicles for comfort,privacy, and the relative ease of transporting bulk itemsand packages.Subway1,750SOURCE: TLC 2014 data; MTA annual reportsThe City regulates for-hire vehicle services through theTaxi and Limousine Commission (TLC) to promote thepublic interest. The rise of e-dispatch services haveblurred the traditional line between medallion cabs,which can offer street-hail service, and non-taxi for-hirevehicles that offer pre-arranged service. With the quickarrival of a car at the tap of a button, the distinctionsthat yielded differential regulatory treatment acrossblack and yellow cars are less relevant, and the Citymust adapt its traditional frameworks to support thenew entrants that do not squarely fit into traditionalcategories. E-dispatch providers have worked with theTLC to meet requirements for existing categories, butFOR-HIRE VEHICLE TRANSPORTATION STUDY PAGE 1
Due to technological advances, once-distinct regulatory categories are blurringFHV Ecosystem, pre-electronic dispatch FHV growthHighFHV Ecosystem, 2015HighBlack carsYellow cabsYellow andgreen cabsGreen cabsLowPrice pointPrice pointBlack car1Yellow cabsGreen cabsLowLiveryLiveryTraditionalE-hail / e-dispatchStreet hailPre-arrangedAccess typeTraditionalE-hail / e-dispatchStreet hailPre-arrangedAccess typeIn NYC, Uber and Lyft are categorized as black cars, not as a separate categoryInterviews with industry players, experts, consumers, and TLC, and review of TLC regulationstheir rapid growth has stressed the regulatory frameworkand is upending traditional categories, prompting theCity to review the for-hire vehicle industry and lay outfour priority areas for study and reform:1. Supporting a comprehensive transportationsystem (including the provision of transit choices,geographic coverage, accessibility, and the financialhealth of the system as a whole);2. Promoting equitable growth (including consumerprotections around pricing and other issues, labormarket impact and job quality);3. Managing mobility impacts in the CentralBusiness District of Manhattan (assessing theability of people and goods to travel into, out of,and around Manhattan, the volume of vehicle trafficon the roads, the capacity of the roads themselves,and assessing any environmental impact); and4. Ensuring safety (for drivers, passengers, and otherusers of New York City streets).In the FHV industry, as in other economic sectors, whensudden changes in market activity produce outcomesthat might be counter to the public interest, governmentmust evaluate the rapid changes and take strategicsteps to promote a vibrant marketplace while craftingreasonable regulations to promote the public good. InPAGE 2 OFFICE OF THE MAYORthis report, we set forth facts and findings that providea basis for the future regulation of New York City’s forhire vehicle market.This report is a product of months of analysis andevaluation, drawing upon the City’s internal agencyexpertise, along with the assistance of outsideconsultants, to provide the fact basis on the currentbaseline conditions in the Manhattan core. Dataprovided in this report was collected during the studyperiod (August through October, 2015).II. THE REGULATION OFAPP-BASED “E-DISPATCH”SERVICESNew York City has a long tradition of adapting its rulesand regulatory structures to the changing needs ofthe for-hire vehicle industry and its passengers. Theseregulations have generally occurred in reaction tomarket behavior and conditions rather than as part of aproactive vision for the transportation industry. The City’sregulation of the industry has adapted with changingtimes – from the cap on taxi medallions imposed duringthe Great Depression, to the creation of the Taxi andLimousine Commission in the early 1970s.Jurisdictions across the U.S. and the world have adapteddifferent models of regulation for e-dispatch operators
Regulation has evolved to recognize four types of FHVsHaas Act caps thetaxicab industryat 13,595 inresponse tooversupply duringthe GreatDepressionCity establishesTLC to regulatemedallion taxis andinvestigate theincreasing problemof “gypsy” cabs19371960Radio calls make upan increasinglylarge part of yellowtaxi dispatches asbusiness accountsgrow, frustratingstreet hailersTLC requiresmedallion ownersto transfer theirradios to nonmedallion vehicles,creating the"black car"industry1971Unregulatedneighborhood carservices become theprimary means offor-hire transport inunderserved areas,particularly outerboroughs1980 1982TLC gainsjurisdiction over all"for-hire vehicles“,legitimizingneighborhood carservices for thefirst timeUber debuts inNYC, initiatingrapid growth innumber of FHVs1987Yellow cabs pilot“e-hail” app tobetter competewith e-dispatchcompanies2011 20122015To bring moretransport options toouter boroughs,City debuts“green cab”licenses allowingFHV drivers toaccept street hailsSOURCE: TLC interviews; NYC FHV Fact Book; Schaller Consultinglike Uber and Lyft. In many jurisdictions, like SanFrancisco and Washington, D.C., e-dispatch servicesoperate on a decentralized peer-to-peer model.1 Underthis model, these companies provide the software to linkpassengers to drivers of vehicles who give rides. Theplatform bears the regulatory responsibility for safety,including training and background checks. In thesejurisdictions, drivers without a commercial license mayoffer rides in their personal cars using the platform.yellow taxi drivers has declined five percent.2 Over thesame two-year period, new for-hire vehicle registrationsby former yellow taxi drivers have increased many timesover.In New York City, these companies face addedrequirements under the TLC’s for-hire vehicle legal andregulatory framework; drivers are professionals and musthold a commercial license, as well as undergo morerigorous background checks and training. Though driversmay operate their personal vehicles, those vehicles mustsubmit to City inspection.Managing Mobility in the Central BusinessDistrictE-dispatch services are growing rapidly. In New York City,the rise of e-dispatch services has created noticeableshifts in driver and consumer behavior. Many drivers aremoving from yellow cabs to drive primarily for e-dispatchcompanies. In the past two years, the number of active1Press clippings; City regulatory agenciesIII. KEY CHALLENGES &FINDINGSOne of the key transportation challenges in NewYork City is the movement of people and goods inManhattan’s Central Business District south of 60thStreet. The CBD drives the regional economy, housesover two million workers, and attracts tens of millionsmore tourists each year.3 It is home to the greatestconcentration of economic and social activity in thecountry and the most intensive vehicle traffic congestionin the City. Most people who enter the CBD do so viasubways or buses, but a substantial number arrive byvehicle.23TLC dataNYC&Co.FOR-HIRE VEHICLE TRANSPORTATION STUDY PAGE 3
Findings:Traffic speeds show a stable pattern of peak concentration over timeTraffic speeds by origin and destination over timeAverage MPH AM/PM Peak, Midday, and 24hr average for an average day from ’09 to ‘15Traffic speeds show a stable pattern of peak concentration over timeTraffic speeds by origin and destination over timeAverage MPH AM/PM Peak, Midday, and 24hr average for an average day from ’09 to ‘15Vehicle congestion in the CBD is related to a variety offactors, which can be broken into those that affect thevolume (demand) of travel and those that affect thecapacity (supply) of the roadway. The volume of vehicletraffic in a given area is frequently measured by thetotal number of vehicle miles traveled (VMT). This willvary based on the total demand for travel (the numberof vehicle trips of all types that people take) and themode of travel by which trips are undertaken. In theManhattan CBD, the vast majority and a growing shareof trips are by foot, rail, bus, and bike; an important butminority share of trips are by car or truck.456TTI Urban Mobility report, Texas A&M and INRIX, 2015 Urban Mobility ScorecardTTI Urban Mobility report, Texas A&M and INRIX, 2015 Urban Mobility ScorecardTLC TPEP data on taxi speedsPAGE 4 OFFICE OF THE MAYORAll to all20100CBD toCBD20100Zone 2A toZone 2A2010Traffic Engineering Book (4th Edition)20142015Hour-range estimate11 AM peak is20096A-10A, Middayperiod is 10A-4P,Peak is 4P-8P201320102011 and PM2012SOURCE: TLC database7AM PeakMiddayPm Peak24 hour averageAM PeakMiddayPm PeakAM PeakMiddayPm Peak0AM PeakMiddayPm PeakNevertheless, based on several key indicators,vehicle congestion has been increasing in severityin the Manhattan CBD over the past five years, withconsequences for people in buses and cars, andbusinesses and institutions that rely on goods deliveredin trucks. Peak hour vehicle commuters in NYC facedan average annual delay of 74 hours in 20144. Theannual cost of lost time due to congestion delays wasapproximately 14.7 billion.5 Average vehicle speedshave fallen nearly 10% over the last two years.6AM PeakMiddayPm PeakRoadnetworkwithcapacityreducingfactorsAM PeakMiddayPm PeakRoadnetworkat fullcapacityPermanently or temporarily reducing the capacity ofroadways generally increases motor vehicle congestion,shifts vehicle travel to other routes or times of day, orcauses some traffic to disappear as travelers shift toother modes or otherwise change their pattern of travel.Changes like opening and closing lanes and settingtraffic light timing systems alter the baseline vehiclecapacity of the roadway producing similar changesto travel behavior. Blocking lanes for construction ofbuildings, subways, underground utility infrastructure,or road repairs can also reduce road vehicular capacityby anywhere from 25-100%7 depending on how manylanes are blocked. A large number of people arriving bysubway or bus increases pedestrian volumes, which canreduce motor vehicle road capacity by as much as a thirdas turning vehicles must wait for pedestrians crossingat intersections. Motor vehicle traffic congestion is alsosignificantly affected by how curb space is managed.When there is inadequate space at the curb for trucksand delivery vehicles and those vehicles double park,they can remove a full lane or more from traffic service.Vehicles circulating in a search for parking and engagedin parking maneuvers can also have a significant impacton congestion. In an important respect, many of thesecontributors to congestion are signs of prosperity andthe efficient use of street space – vehicle congestionwould be far worse if people on foot drove instead,and the growth of new buildings, tourism, infrastructureinvestment and economic activity are signs of a healthycity.AM PeakMiddayPm PeakAs the City’s population and tourism have grown, theNew York City Department of Transportation has workedto improve the safety, efficiency, and livability of thestreets by supporting travel options that require lessspace such as walking, riding the bus, and bicycling,while maintaining appropriate traffic flow for cars andtrucks. These steps, including pedestrian safety projects,bus lanes, bicycle lanes, and plazas, are core to the City’ssafety and sustainability goals, and fundamentally allowmore people to access and enjoy the Central BusinessDistrict without adding more cars on the road.
Reductions in vehicular speeds are driven primarilyby increased freight movement, constructionactivity, and population growth. According to theCity’s analysis, several factors have contributed tothe recently observed drop in Manhattan CBD travelspeeds by taxis and buses, affecting practical vehicularroadway capacity and how it is used. Population andjob growth, increased construction activity, growth inthe number of deliveries, and record levels of tourismhave all contributed to the reductions in vehicle speeds.Construction permits in the CBD are up 6-7% since20098 and pedestrian counts in the CBD are also up18-24% since 2009.9E-dispatch is a contributor to overall congestion,but did not drive the recent increase in congestionin the CBD. Vehicles of all types play a role in congestionin the CBD. The number of trips by all vehicle typesin the CBD remained flat between 2014 and 2015as increases in transit ridership offset increases in tripdeman driven by growth. Increases in e-dispatch tripsare largely substituting for yellow taxi trips10 in the CBD.Because these e-dispatch trips are substitutions and notnew trips, they are not increasing VMT. Additionally,there is no clear evidence to suggest decisive capacityeffects driven specifically by e-dispatch pick-up, dropoff, and parking behaviors in the period. Therefore,e-dispatch does not appear to be driving the additionalcongestion experienced in the CBD.likely to be modest declines in vehicle speed. However,small macro-level changes may drive significant delaysat discrete points. For example, if the growth in theFHV sector is due to net new car trips, then high-trafficintersections could see significant increases in vehicularcongestion.Finding:E-dispatch could drive modest growth in congestionin the future. The impact of e-dispatch vehicles oncongestion in the CBD may change in the future. If rapide-dispatch growth were to reduce public transit trips,there would be additional modest growth in congestionacross the CBD due to for-hire vehicles. Given that muchof the growth seems to be growth in e-dispatch, thesescenarios show modest growth in the CBD as a whole,even with significant growth in other car modes.Yellow utilization, for sample dayPercent of yellow VMTs travelled where meter is running, city ction of e-dispatch playersIn addition to looking at congestion in the CBD as awhole, the study also briefly examined the impactchanges in the FHV sector could have at the micro level.Within the CBD, over the next five years, there areThe number of vehiclemiles-traveled (VMTs),a measure of trafficvolume, is flat overallin the CBD from 2014to 2015, even with thegrowth of e-dispatchBased on a sample mid-week day in April for each year 2009-2015, annual average of 21.5 trips per shiftlikely higher and number of yellow shifts per day lower due to shifts that contain hours in consecutive24-hour daysSOURCE: TLC database analysis of a sample mid-week day in April for each year 2009-2015For-hire services were a relatively small portionof VMT in 2014 and while e-dispatch grew in 2015, total VMTsare essentially flatTotal 2014 VMTs originating in CBD2VMTs by mode, millionsTotal 2015 VMTs originating in CBD2VMTs by mode, millions ( or – since te Car122015TruckTaxi and Traditional FHV1e-dispatchTaxi corresponds to BPM “Taxi” category and contains Yellow, Black, Livery, and Limo; in CBD pickups are 95.9% taxiAll data is centered on VMTs located wholly within the CBD regardless of origination and/or destination. BPM projections for 2010 and 2020 are interpolated linearly to arrive at 2014 and 2015 values for Private Car and Truck,and Private Car is adjusted by diversion to e-dispatch based on primary research on NYC residents. 2014 and 2015 TPEP data analyzed to determine Taxi trip origins/destinations and lengths; assignments to TAZ based onshortest path through road-network via BPM assignment functionality. No data exists on traditional FHV in 2014, and BPM growth rates are applied in reverse to arrive at 2014 FHV levels. Cruising VMTs incorporated into Taxi/ traditional FHV / e-dispatch breadcrumb data estimates from Yellow adjusted to other modes via driver survey. VMT of revenue trips for e-dispatch is taken directly from Uber submitted data; given lack of data on traditionalFHVs this information is assumed to apply to those as well. Uber data scaled to total e-dispatch market based on Uber proportion of e-dispatch pickups in 1H’15; measured at 99.5%SOURCE: NYMTC BPM projections, TLC databases8910DOT roadway construction permitsDOT pedestrian count during one week in Spring, 2009-2015NYMTC BPM Projections, DOT, TLCFOR-HIRE VEHICLE TRANSPORTATION STUDY PAGE 5
Yellow cab utilization remains steady despitedecline in trips, with little change in congestionimpact. While yellow taxi trips have declined over thestudy period, patterns of yellow taxi utilization havenot changed. Since the arrival of e-dispatch apps, theratio of yellow taxi vehicle miles traveled with the meterengaged to yellow taxi vehicle miles traveled without apassenger has remained constant, with metered travelrepresenting approximately 54% of taxi vehicle milestraveled.Ride-sharing may have inadvertent, detrimentalimpacts on congestion. Ride-sharing – a carpoolservice operated by e-dispatch and other providers- is gaining momentum in New York City as well ascities around the country. More and more e-dispatchproviders are adding this feature to their menu ofservices for their customers’ convenience, as ridesharing works the same as other e-dispatch services,but offers cheaper individual rides. Though this servicemay provide some benefit for consumers individually,the effects on congestion vary depending on whichpool of consumers ride-sharing pulls from. Ride-sharingcould have a substantial impact in reducing vehicle milestraveled, but only if many consumers change from othercar-based modes and few riders switch from publictransit. NYC buses typically use scarce urban streetspace much more efficiently than FHVs, even if there areseveral passengers sharing an e-dispatched ride-shareservice. The congestion mitigation of an 11-13% switchin yellow taxi and e-dispatch trips over to ride-sharingwould be completely offset if less than 1% of publictransit riders also switched to ride-sharing.11Air Quality improves over time. Even in light ofpotential congestion increases, modeling done for thisstudy shows that air quality levels from mobile sourcesare expected to improve in the future -- in large partdue to substantial increases in automotive emissionsstandards. In addition, the City’s new Air Code and newState and Federal requirements mean that any increasesin air pollution caused by the addition of vehicles wouldnot be sufficient to alter the overall downward trend.Given the relatively small percentage the FHV industryrepresents of vehicles in the CBD, and the substitutioneffect between yellow and FHVs, under the currentstandard for taxis and for-hire vehicle usage andretirement, changes in the FHV sector are not likely toaffect New York City air quality in a significant manner.11HDR/KLD for-hire services projection model, Bandwagon ridesharing data; NYCConsumer survey September 2015PAGE 6 OFFICE OF THE MAYORSupporting a ComprehensiveTransportation SystemMeeting Accessibility CommitmentsAnother continuing challenge the City faces is providingsufficient and reliable accessible transportation.Wheelchair users are about 10%12 of the total populationof people with disabilities.New Yorkers with physical disabilities have sought equalaccess to every part of the City, including the taxi fleet,for years. The City is committed to making the yellowcab fleet 50% accessible by 2020 and the green cabfleet 50% accessible by 2024. All black car and liverycar services, including e-dispatch providers, are requiredby TLC rules to provide equivalent service to all usersregardless of disability, but a 2014 enforcement actionfound widespread failure to meet the requirement.Finding:As e-dispatch continues to grow, the percentageof for-hire vehicles that are accessible will drop.Yellow and green taxi fleets, which are subject toaccessible vehicle requirements, are losing their supplyof willing drivers to e-dispatch services, which are subjectto the equivalent service rule, but which are not subjectto the judicial and statutory mandates affecting yellowand greens cabs. E-dispatched cars are not accessibleto many people with disabilities including vision andhearing loss, or people using non-folding wheelchairs.As more e-dispatch vehicles are added to the road, thenumber of accessible yellow and green taxis becomes asmaller and smaller percentage of all for-hire vehicles –even without the drop in supply of yellow and green taxidrivers that the City is beginning to experience. If thesystem were fully accessible and people with disabilitieswere to take as many trips per day as New Yorkers onaverage, the New York City transit system would seealmost 920,000 trips per day13 taken by people withdisabilities out of a population of roughly 1,000,000disabled individuals. Wheelchair users would generateapproximately 83,000 trips per day14 through the NewYork City transit system.Supporting Mass TransitOne of the City’s core interests is maintaining adequaterevenue to support mass transit and other transportationneeds. As an intensive user of City streets, it isappropriate that for-hire vehicle companies participate infunding these needs, and it is appropriate that e-dispatchcompanies pay their fair share. The blurring between121314Mayor’s Office for People with DisabilitiesAssuming same trip intensity as overall NYC population across all modalitiesAssuming same trip intensity as overall NYC population across all modalities
The chart below demonstrates how taxes and fees figure into the fare paid by passengers:MedallionFor-hireYellow cabIndustry taxesTrip sales ysurchargeDriver lic.Other revenuesourcesCommercial vehiclescontribute differently topublic revenuesMTA taxVehicle salesInspectionsDriverincome taxDriver leasesales taxSOURCE: TLC, OMBthe yellow cab and e-dispatch market has eroded animportant source of transit funding, since taxes and feesare applied differently between these two sectors eventhough passengers now readily move between them.The City and the Metropolitan Transportation Authority(MTA) receive significant amounts of revenue fromyellow and green cabs. There is a 0.50 MTA surchargefor every trip in those vehicles that goes to support masstransit. Taxi passengers also pay a 30-cent per ride feethat goes towards an accessibility fund to help the Cityachieve its fleet accessibility goals. Non-taxi for-hirevehicles, including e-dispatch vehicles, do not pay anMTA surcharge or an accessibility fee. However, theydo pay a per trip sales tax of 8.875%, with 0.375%devoted to the MTA, 4.5% going to the City, and thebalance directed to the State. Yellow and green cabsdo not pay sales tax.15Finding:The shift to e-dispatch will create a revenueshortfall for key transportation priorities. Everye-dispatch trip taken in place of a yellow or green taxidiverts revenue from measures to fund an accessiblefleet and support New York City’s subway and bussystem. Without regulatory intervention, the growthof e-dispatch services will have lasting impact on thisimportant source of support for public transit andaccessible vehicles.15New York City Office of Management and Budget, TLCIV. PROMOTING EQUITABLEGROWTHAs a result of the technological advances that haveoccurred in the for-hire vehicle sector, once-distinctregulatory categories are now blurring, and causingmore direct competition for drivers and passengers.Where there were once yellow and green cabs that tookon passengers through street hails, and black cars andlivery that did not, these lines are no longer so clear.Through the use of apps that let customers “e-hail” andsummon “e-dispatches” yellow and green cabs, blackcars, and livery cars are now in direct competition for thesame passengers. All for-hire vehicle sectors are underpressure from illegal street hails which leave passengerswithout the consumer protections offered throughregulated services.This new FHV landscape has had a wide array oframifications. The market segmentation that onceexisted has substantially eroded. Yellow cabs onceobtained passengers almost exclusively through streethails and taxi stands, including at airports. Liveryservices worked primarily in neighborhoods that werenot well served by yellow cabs. Black cars mainlyserved corporate clients through advanced bookings,primarily in Manhattan. With the advent of app-baseddispatching, Uber’s share of the FHV market has risensharply. Despite the introduction of e-hail apps, yellowcabs have seen their passenger volume decline.1616TLC databaseFOR-HIRE VEHICLE TRANSPORTATION STUDY PAGE 7
While the categories of FHV vehicles have blurred,the regulatory framework has remained remarkablyfixed. Yellow and green cabs have fleets whose sizesare restricted by law – 15,23717 and 18,000 vehicles,respectively. Livery, black car, and limousines – includinge-dispatch cars – have no such restrictions.Fare information is disseminated differently by sector.Yellow or green cab prices are fixed and clearlydisplayed for the customer. A livery passenger can geta price quote from the dispatcher or driver. E-dispatchcustomers do not receive a firm fare quote in advance,an information asymmetry that can be exacerbated withso-called “surge” pricing.The survey was the first of its kind for the for-hire vehicleindustry in New York City.Choice factors for trips when passengers consideredtaking multiple for-hire services optionsE-dispatch is chosen for shortwait times, easy payment, and safetyYellowYellow taxi is chosen forcomfort and when lateE-dispatchBoth are chosenfor speed of travel% riders2616Short wait3223222831271934238Easy to paySafetyComfortI was lateFastestThere are over 148,000 licensed for-hire vehicle driversin New York City. All of these drivers must interact withTLC at some point throughout the year: getting a carinspected, dealing with a violation, or renewing a license.Until recently, licensing by itself presented a challenge asdifferent sectors have different classifications of licensing.A recent change allows medallion and FHV drivers, whoonce had separate licenses, to operate vehicles in eithersector. Drivers of yellow and green taxis are required toattend taxi school, which provides important trainingin safety and customer service. This requirement hasrecently been extended to drivers of non-taxi for-hirevehicles. There are also significant differences in fares,the frequency of TLC inspections, and other regulations.The survey showed that both financial and non-financialconsiderations play important roles in customer anddriver behavior, and that e-dispatch services are viewedfavorably for an array of service attributes, includingconvenience, c
livery cars, traditional black car services, and the fast-growing app-based car services like Uber and Lyft -- are an important part of the City's transportation mix. Although subway and bus trips significantly outnumber for-hire vehicle trips, for-hire vehicles provide some services that the mass transit system cannot. Many
