Transcription
CAR2Go five CITIES reportImpacts of car2go on Vehicle Ownership, Modal Shift,VehicleMiles Traveled, and Greenhouse Gas Emissions:a n a n a ly s i s o f o n e - way c a r s h a r i n g a c r o s sA UnN IAQ nU Ea luyr sb ai sn oE nf vFi ri vo ne mNe on tr st h A m e r i c a n C i t i e sSu san S h a h e e n , P h . D.Transpo r tat io n Sus tain ab il it y R e s e a r ch Ce nte r , C o - Di r e c t o rEllioti n,if oPr nhia,.D.B e r ke l e y, A dj u n c t Pr o f e s s o rUniv ersitMy aofr tC alT ran sp or tati o n Susta i na bi l i ty R e s e a r c h C e n t e r , R e se a r c h E n g in e e rElli o t M art i n , P h . D.Susan Sr tatha iohen eSusn,tainP hab.D.il it y R e s e a r ch Ce nte r , R e s e a r c h E n g i n e e rTranspoT ran sp or tati o n Susta i na bi l i ty R e s e a r c h C e n t e r , C o- D ir e c t orUnive rsit y o f C a l i f o r ni a , Berkel e y, A d j u n c t P r of e ssorAdam S t oc k e rTranspo r tat io n Sus tain ab il it y R e s e a r ch Ce nte r , R e s e a r c h A s s o c i at ef e b JrUuLYa r2y0 1260 1 6tsrctsrc
E. Martin and S. Shaheen. Working Paper. July 2016The Impacts of Car2go on Vehicle Ownership, Modal Shift,Vehicle Miles Traveled, and Greenhouse Gas Emissions:An Analysis of Five North American CitiesContentsAcknowledgements. 2Executive Summary. 3Introduction . 7Methodological Overview . 7The Impact of Car2go on Vehicle Holdings . 9Car2go Impacts on Modal Shift. 11Car2go and Estimated Changes in Vehicle Miles Traveled . 14Car2go and Estimated Greenhouse Gas Emission Impacts . 19Key Takeaways . 221
E. Martin and S. Shaheen. Working Paper. July 2016AcknowledgementsWe would like to thank Apaar Bansal, Matthew Christensen, Michael Fratoni, Jessica Lazarus, AnthonyPrivitera, and Adam Stocker of the Transportation Sustainability Research Center (TSRC) at theUniversity of California, Berkeley for their assistance in data collection and early analysis. We alsoacknowledge Allen Greenberg of the Federal Highway Administration of the U.S. Department ofTransportation, Kiersten Grove of the City of Seattle, and Ray Traynor of the San Diego Association ofGovernments (SANDAG) for their financial and in-kind support, as well as valuable feedback on thecar2go survey instruments. Thanks also go to Paul DeLong, Michael Mikos, Walter Rosenkranz, andJonathan Singer of car2go for their many contributions to this study. Car2go also provided a year ofanonymized trip activity data to support reweighting of the sample dataset and measurement of car2govehicle travel. Analysis of the survey and activity data was solely conducted by TSRC/Innovative MobilityResearch Scientists. The contents of this working paper reflect the views of the authors and do notnecessarily reflect acceptance of the sponsors.About Innovative MobilityInnovative Mobility Research (IMR) is a group of researchers whose projects explore innovative mobilitytechnologies and services that could improve transportation options, while reducing their negativesocietal and environmental impacts. IMR contributes critical data and analysis to help mobility providersoffer consumers a range of approaches to meet their transportation needs.Innovative mobility strategies, through both technological advances and shifting people’s travel patternsand behaviors, are important tools for reducing energy consumption and to create a more sustainabletransportation future.IMR is based at the Transportation Sustainability Research Center (TSRC) at UC Berkeley. IMR’s currentresearch areas include: mobility and the sharing economy, alternative fuel vehicles, intelligenttransportation systems (ITS), public transit connections, mobility for special populations, and alternativetransport futures including automated vehicles. IMR designs research projects and conducts evaluationsthroughout the State of California, the U.S., and internationally.IMR & TSRC408 McLaughlin HallUniversity of California, BerkeleyBerkeley, California 94720Office: (510) keley.edu2
E. Martin and S. Shaheen. Working Paper. July 2016Executive SummaryCarsharing is the shared use of a vehicle fleet by members for tripmaking on a per trip basis. There arefour forms of carsharing in North America today: 1) roundtrip, 2) one-way, 3) peer-to-peer, and 4)fractional. In roundtrip carsharing, members begin and end a trip at the same vehicle location andtypically pay for use by the hour, mile, or both. One-way carsharing enables members, who pay by theminute, to begin and end a trip at different locations—either throughout a free floating zone or stationbased model with designated parking locations. Peer-to-peer carsharing functions much like roundtripcarsharing; however, the vehicle fleet is typically owned/leased by private individuals and facilitated bya third-party operator. Finally, the fractional ownership model enables users to co-own a vehicle andshare its costs and use. Roundtrip carsharing has been operating in North America for over 20 years. InJuly 2015, there were 39 roundtrip carsharing operators in North America with a total membership of1,005,893 and a collective fleet of 18,582 vehicles. In 2010, one-way carsharing launched in NorthAmerica in Austin, Texas with the car2go service. As of July 2015, there were three one-way operators inNorth America, serving 511,000 members with a collective fleet of 6,870 vehicles (Shaheen and Cohen,2016, forthcoming).Car2go is currently the largest carsharing operator in the world, with a presence in nine countries andnearly 30 cities. It operates as a one-way instant access carsharing system within a pre-defined urbanzone. Members can find an unoccupied parked vehicle, access it immediately, and use it to meet theirlocal travel needs. As long as the vehicle is parked within the operating zone, users only pay for the timethat they drive. As a one-way system, car2go provides flexibility to the user. There are questions as towhether one-way carsharing increases overall vehicle miles traveled (VMT), by facilitating easier oneway travel (and automotive commuting) within urban environments. The results of this study suggestthat access to ubiquitous shared automobiles allows some residents to get rid of a car or avoid acquiringone altogether. These actions taken by a minority of members have VMT-reducing effects that areestimated to exceed the additional driving that does take place within car2go vehicles. This studysurveyed car2go members in five cities to determine the impacts on vehicle ownership, modal shift,VMT, and greenhouse gas (GHG) emissions. The cities surveyed were Calgary, San Diego, Seattle,Vancouver, and Washington, D.C. We asked questions that required respondents to attribute specificchanges in their life as caused by the presence of and access to car2go. We also used vehicle activitydata to evaluate the total driving that car2go vehicles travel in a city during a year, as well as a profile ofthe frequency of use by the broader car2go population.Not surprisingly, we found that car2go has a diverse range of impacts on the member population. Mostof the car2go population appears to use it for a small number of trips a year to satisfy incidental mobilityneeds. This activity generally adds to driving that is additional or would have otherwise occurred withanother automobile. The analysis also found that a minority of the population uses car2go as asubstitution for personal automobiles as they either sold personal vehicles owned or suppressed theacquisition of a private auto. The impacts of these changes are large relative to the overall increase indriving that is caused by car2go activity. Thus, the results of this analysis suggest that car2go is on netreducing vehicles that would be owned by households, reducing driving, and thus lowering GHGemissions.There are diverse impacts on travel behavior; the magnitude of these impacts varies across the fivecities; and the results are subject to some measurement uncertainty. The study asked modal shift3
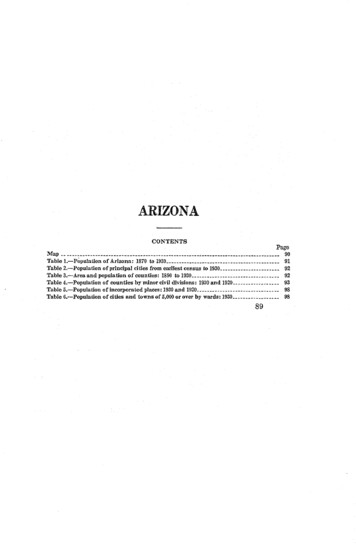
E. Martin and S. Shaheen. Working Paper. July 2016questions that show the relative shares of respondents that changed their use of other modes inresponse to car2go. car2go was found to both substitute and complement public transportation, as wellas other active transportation modes, such as walking and to a lesser degree bicycling. In most cities, amajority of members exhibit no change in public transit use due to car2go. But among those that dochange their behavior, the count of car2go members reducing their public transit use outnumbers thecount of those increasing their use. There are exceptions in the cases of both bus and rail, and there areusers that make more complementary use of these modes with car2go. In all cities except Washington,D.C., a greater number of members reported walking more due to car2go than walking less. At the sametime, car2go had mixed effects on bicycling with smaller magnitudes of change. car2go was found tocompete directly with taxis, as most respondents used taxis less as a result. The reported impact ofcar2go on personal driving also showed mixed effects. In San Diego, more people reported decreasingtheir driving than increasing it due to car2go, whereas in the other study cities, more people reportedincreasing their driving than decreasing it. Between 29% and 38% of respondents in four of the citiesreported that there was another person with them when they used car2go at least half the time. Thisquestion was not asked in San Diego, but it was added as part of the Seattle revisions.The measurement of mode shift by count of people may differ from the overall cumulative impacts. Thatis, those driving more due to car2go appear to be doing so in small amounts for incidental uses. Whilethose decreasing driving by selling personal vehicles and avoiding a vehicle purchase are a smallergroup. However, this group has a more sizeable impact, which generally overwhelms the additionalmiles driven on car2go vehicles. This result appears to hold even under some rather conservativeassumptions regarding driving displaced from suppressed vehicles. Our analysis also includesconsideration of miles driven by staff to redistribute the car2go vehicles. For four of the five cities, staffmiles were found to range between 3% and 7.5% of all car2go miles driven. For San Diego, whichoperated a fully electric fleet of vehicles at the time, staff miles comprised 17% of all miles driven, inpart due to the need to shuttle vehicles to depots for recharging.car2go also causes substantive change on the vehicle holdings of a minority of members. In this study,we measure the change in the raw sample; however, when we scale the impacts to the broaderpopulation, we re-weight the effects to consider the distribution of usage frequency in the activity data.This was done to balance the responses in consideration of the fact that more active users are morelikely to respond to the survey and are more likely to report substantive impacts relative to the generalpopulation. When considering the re-weighted impacts of active car2go drivers (i.e., those using it morethan once a month), the results suggest that between 2% to 5% of the car2go population sold a vehicledue to car2go across the study cities. The average age of vehicles sold ranged between 12 and 15.7years across the five cities, and the entire sample of sold vehicles had an average age of 14.4 yearsacross all of the cities. Another 7% to 10% of respondents (aggregate results) did not acquire a vehicledue to car2go. While these percentages are nominally a small share of the re-weighted sample, at thepopulation level they translate to vehicle reduction impacts that exceed the number of car2go vehiclesoperating on the streets of the cities studied. We found that members sold between 1 to 3 personalvehicles for each car2go vehicle, and between 4 to 9 vehicle acquisitions per car2go vehicles weresuppressed across the cities studied. Overall, car2go removed between 7 to 11 vehicles from the roadper vehicle (on average) across the study cities. In aggregate, this estimate translates to about 28,000vehicles removed from the roads across the five study cities due to car2go operations. In Table 1 below,we provide an overview of key vehicle and GHG impacts in each of the five cities.4
E. Martin and S. Shaheen. Working Paper. July 2016Table 1 Vehicle and GHG Impacts from Free-Floating One-Way Range ofVehiclesRemovedperCarsharingVehicleEstimated %Reduction inVMTper car2gohouseholdEstimated %Reduction inGHGper foregonepurchases)Calgary, AB(n 1,498)29112 to 11-6%-4%San Diego, CA(n 824)1671 to 7-7%-6%Seattle, WA(n 2,887)37103 to 10-10%-10%Vancouver, BC(n 1,010)2792 to 9-16%-15%Washington,D.C. (n 1,127)3583 to 8-16%-18%The average vehicle that was sold among respondents was driven between 5,800 to 7,800 miles per yearacross the five cities. Based on the driving reported by survey respondents, we generate an upperestimate of the miles that would be have been driven on suppressed vehicles by taking 80% of theaverage VMT driven on all vehicles reported in respondent households. This estimate ranged from 5,100to 7,400 miles per year across the five cities. These mileage estimates permitted a broader estimation ofthe miles that are reduced through the personal vehicles suppressed due to car2go. The average VMTdriven on car2go vehicles per customer per year was found to range from 75 to 142 miles across the fivecities, which illustrates the fact that car2go vehicles are not, on average, driven long distances by thebroader member base (although some members use it quite a bit more). We also computed theestimated VMT impact that would result, if only 20% of the average VMT driven were avoided fromsuppressed vehicles. This amounts to the assumption that only 1,300 to 1,900 miles per year would bedriven on vehicles not acquired by car2go members who reported a vehicle suppression. Taking theestimated miles removed due to vehicles sold and suppressed, against the additional driving done oncar2go vehicles, we calculate--using the upper suppressed mileage factor--between 20 million to 37.5million miles (aggregate) are eliminated or not driven due to car2go across the five cities. The estimatedVMT impact under the more conservative assumption is markedly lower, but it still reflects a netreduction, ranging from 6 million to 12 million miles a year across the five cities. Although we estimatethat only 2% to 5% of the population sells a private vehicle and another 7% to 10% of the populationforgoes a vehicle purchase, the cumulative avoided driving on just those vehicles is large enough relativeto the VMT driven on car2go vehicles overall, that a VMT decline occurs under some rather conservativeassumptions. Overall, this translates into a reduction in GHG emissions, which for the upper (80%)suppressed mileage VMT estimate, we computed to range between 5,300 to 10,000 metric tons peryear across the five cities or 10 to 14 metric tons per year per car2go vehicle (on average) across the five5
E. Martin and S. Shaheen. Working Paper. July 2016cities. If the lower, more conservative 20% assumption is applied to suppressed mileage, then the rangeof GHG impacts amounts to 2,200 to 4,200 metric tons per year or 4 to 7 metric tons per car2go vehicle(when averaged over all vehicles). The percentage reduction on VMT and GHGs is computed inaggregate across all households using the 80% suppressed mileage assumption. This computationconsiders the total estimated net VMT reduction as a percent of the total estimated VMT of car2gohouseholds. Since households both increase and decrease their VMT as a result of car2go (and bydifferent magnitudes), the percentage change only applies in aggregate. Nonetheless, estimated impactsof VMT suggest that on balance car2go changes VMT by -6% to -16%, per car2go household and GHGemissions change by -4% to -18% per car2go household. Overall, the results of this study suggest thatcar2go one-way carsharing is substantively impacting travel behavior, miles driven, GHG emissions, andthe number of vehicles on urban roads within operating regions.6
E. Martin and S. Shaheen. Working Paper. July 2016IntroductionCarsharing is the shared use of a vehicle fleet by members for tripmaking on a per trip basis. There arefour forms of carsharing in North America today: 1) roundtrip, 2) one-way, 3) peer-to-peer, and 4)fractional. In roundtrip carsharing, members begin and end a trip at the same vehicle location andtypically pay for use by the hour, mile, or both. One-way carsharing enables members, who pay by theminute, to begin and end a trip at different locations—either throughout a free floating zone or stationbased model with designated parking locations. Peer-to-peer carsharing functions much like roundtripcarsharing; however, the vehicle fleet is typically owned/leased by private individuals and facilitated bya third-party operator. Finally, the fractional ownership model enables users to co-own a vehicle andshare its costs and use. Roundtrip carsharing has been operating in North America for over 20 years. InJuly 2015, there were 39 roundtrip carsharing operators in North America with a total membership of1,005,893 and a collective fleet of 18,582 vehicles. In 2010, one-way carsharing launched in NorthAmerica in Austin, Texas, with the car2go service. As of July 2015, there were three one-way operatorsin North America, serving 511,000 members with a collective fleet of 6,870 vehicles (Shaheen andCohen, 2016, forthcoming).We designed the study to better understand how car2go is used; how it changes travel behavior; and itsimpacts on vehicle ownership, driving, and greenhouse gas (GHG) emissions. Car2go is a one-waycarsharing service provider with a free-floating operational model, primarily. Between 2014 and 2015,we distributed an online survey to car2go members in the cities of San Diego, Seattle, Vancouver,Calgary, and Washington, D.C. Across all cities, the survey was completed by 9,497 car2go members. Thesurvey was first administered in San Diego in September 2014. We received input on the surveyinstrument from our research partners at the Federal Highway Administration (FHWA) of the U.S.Department of Transportation; the San Diego Association of Governments (SANDAG), the regionalmetropolitan planning organization; and car2go. Next, it was modified based on feedback received fromthe City of Seattle and released in Seattle, Vancouver, Calgary, and Washington, D.C. in January, March,July, and September 2015, respectively. Based on an analysis of the survey and car2go activity data, weestimate the impacts that car2go has had on vehicles sold and suppressed by car2go members, modalshift, vehicle miles traveled (VMT), and GHG emissions within the five cities during the year the surveyswere deployed.This working paper has six sections including: 1) methodological overview, 2) impact of car2go onvehicle holdings, 3) car2go impacts on modal shift, 4) car2go and estimated changes in VMT, 5) GHGemission impacts, and 6) key takeaways.Methodological OverviewThe survey was sent to all car2go members within the five cities: Calgary, San Diego, Seattle, Vancouver,and Washington, D.C. Respondents in each city were entered into a drawing for one of ten, 50 Amazongift cards. We asked questions about modal shift, changes in vehicle holdings, and annual VMT.Respondents were asked questions assessing whether they got rid of a vehicle due to the presence ofcar2go, as well as whether or not they would purchase a vehicle if car2go, specifically disappeared. Inboth cases, respondents had to indicate that car2go was a cause of getting rid of a vehicle or of notacquiring one. Responses to these questions were tabulated within the sample to generate an estimateof vehicles sold and suppressed. These impacts were stratified by the self-reported frequency of car2gouse. The stratified impacts calculated from the survey data were then weighted according to the7
E. Martin and S. Shaheen. Working Paper. July 2016distribution of usage frequency by members as observed within activity data provided by car2go in eachcity. Researchers then classified active members within the re-weighted data, as people that use car2gomore than once a month. The factors for private vehicles sold and suppressed from the weighted impactprofile of active members was applied to the average overall car2go user population for the year withineach city to calculate an estimate of the number of private vehicles sold and suppressed. This total wasthen divided by the average number of car2go vehicles, over the course of the year within each city, toestimate the “vehicles sold per car2go vehicle” and the “vehicles suppressed per car2go vehicle” onaverage. This produced a low and high range of impact for each city, as well as a total impact rangeacross the cities.We designed the survey questions to assess car2go impacts, such as private vehicles sold or suppressedand modal shift. Respondents could also indicate that they sold a vehicle or changed their behavior butnot because of car2go. These actions were excluded from the impact profile. Some respondents in eachsurvey were filtered out of the analysis due to missed responses, misanswered questions, or otherconfounding factors. This reduced the total sample size to 7,346 responses. We also extractedrespondents that relocated when their move (home or work) impacted VMT more than the presence oruse of car2go. This resulted in a final sample of 6,167 for computing vehicle, VMT, and GHG impacts. Thecomplete sample of 9,497 was used for assessing modal shift in this analysis because the questionstructure was a relatively simple ordinal scale question asking whether mode shift had occurred as aresult of car2go. Since respondents were reporting a change in relative usage frequency on a basicordinal scale, it presented less opportunity for confounded answers.Some limitations exist in these findings. Primarily, the impacts of car2go on respondents are selfreported. On some level, this is unavoidable, since the respondent is the most knowledgeable as towhether or not car2go was a causal reason for a change in vehicle ownership, VMT, or some otherchange in travel behavior. Also, the measurement of annual personal driving is self-estimated. Wherepossible, confirmation of impacts was embedded in the methodology. For example, respondents werefiltered out if their responses were implausible or outlier measurements. Furthermore, respondentswere asked to list their vehicles during the year before joining car2go and at the time of the survey. Ifthey indicated that they sold a private vehicle specifically due to car2go (required of respondents to beconsidered an impact), but there was no change in the vehicles reported, then the impact was notconsidered in the calculations. Vehicle suppression was restricted to one vehicle per household in thisanalysis to be conservative, even though some households reported car2go suppressing more. Despitethese verification steps, limitations remain regarding the self-reporting of impacts and the causalrelationship of those impacts to car2go. We were unable to include a control group of the generalpopulation due to budget limitations. Overall, the majority of respondents indicated that car2go had notcaused them to sell or suppress a private vehicle purchase, and in most cases had not caused a changein other travel behavior. These results reflect car2go operations in environments that are generallyurban in nature. Furthermore, members opt in to using carsharing systems, like car2go. This is a part ofthe process of using carsharing and other shared mobility services. People that cannot use car2go, donot sign up for the service and consequently do not experience a direct impact from it. Thus, the resultsreflect the estimated impacts on individuals who have chosen to use car2go because the serviceprovides some mobility or economic benefit. Specific methodological points related to vehicleownership, modal shifts, VMT, and GHG impacts are included in each discussion below.8
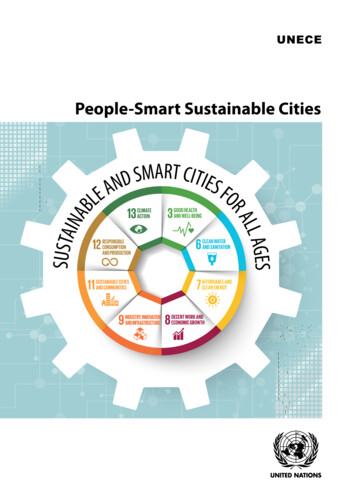
E. Martin and S. Shaheen. Working Paper. July 2016The Impact of Car2go on Vehicle HoldingsThe results suggest that the availability of car2go has reduced the net number of vehicles on the road inthe five cities studied within North America. Across all of the cities surveyed, the suppression effect ofcar2go (i.e., the effect car2go has on removing the need for members to purchase a personal vehicle) islarger than the shedding effect of car2go (i.e., the effect that car2go has on allowing members to sell orget rid of a personal vehicle). Across the five cities, we estimated that between 2% to 5% of memberssold a vehicle due to car2go, which reflected the weighted sample of active members as projected ontothe car2go population. Another 7% to 10% suppressed (or avoided) a vehicle purchase due to car2go(also reflecting the weighted sample of active members only). As noted above, we considered activemembers in this analysis to be those that use car2go more than once per month.We applied the impact percentages to the average membership base for the year 2014 to estimate thenumber of vehicles sold and suppressed by car2go members. We used the year of 2014 for thecomputation of these rates because we had activity data during this year to derive the usage frequencyprofile for the population. The estimates were then divided by the average size of the vehicle fleet forthat year. This yielded an estimate for the total number of private vehicles sold and suppressed percar2go vehicle. These estimates describe how the presence of car2go impacts vehicle holdings based onthe fleet size within that city. These impacts are subject to fleet management practices and existingmember-vehicle ratios. For example, if car2go quickly adds 100 new vehicles to a fleet to serve anexpanded area, personal vehicle holdings resulting from this fleet growth may not be immediatelyimpacted at the rates presented here. The effects of car2go on personal vehicle decisions made byhouseholds proceed at a slower, more gradual pace as a new region acquires active members who adaptto and feel comfortable with its presence. Areas with different land uses and public transit access alsorespond differently. This study evaluates cities with a range of population densities and public transitnetworks. At the low end are Calgary and San Diego, with population densities of 3,400 and 4,000people per sq. mile, respectively. Vancouver has the highest population density with about 13,000people per square mile, followed by Washington, D.C. ( 9,800) and Seattle ( 6,700).The analysis shows a range of vehicle ownership impacts across the cities. As the effect of vehicles soldis generally the lower of the two, it is considered the lower bound of within-city vehicle impacts. Theupper bound of within-city impacts includes the estimated number of vehicles suppressed and sold percar2go vehicle. These effects are independent of each other in that they avoid double counting amongrespondents. Double counting can occur when a respondent indicates that they both sell and suppress avehicle purchase. In such a case, a respondent who sells a private vehicle due to car2go would be reacquiring the vehicle in the absence of car2go. When such a conflict arises, we count the vehicle as soldand not a vehicle suppressed. Because the impacts of a private vehicle sold and suppressed areindependent, they can be added to produce an estimated impact of total vehicles removed due tocar2go. Across the five study cities, it is estimated (based on the minimum and maximum of rangesacross cities) that: Car2go members sold between 1 to 3 vehicles per car2go vehicle (on average).Car2go members suppressed the need for between 4 to 9 vehicles per car2go vehicle (onaverage).Overall, when considering both effects together, each car2go vehicle removed between 7 to 11vehicles from the road of the five cities studied (on average).9
E. Martin and S. Shaheen. Working Paper. July 2016Table 2, below, shows a summary of these effects as derived from the weighted survey responses,consideration of active member totals, and the translation of those impacts to the car2go population.Table 2 Summary of Car2go Vehicle ImpactsWeightedSamplebasedVehicle SoldPercent ionPercent of ActiveMembersFinalSampleSize ForVehicleImpactAnalysisVehiclesSold percar2govehicleVehiclesSuppressedper car2govehicleTotalVehiclesEstimatedRemoved percar2goVehicleWithin-CityRange ofVehiclesRemovedper car2goVehicleCalgary2%9%124629112 to 11San Diego2%10%6431671 to 7Seattle3%9%246337103 to 10Vancouver2%10%8632792 to 9Washington,D.C.5%7%9523473 to 7CityThe vehicle impacts vary by city, with Calgary having the lar
CAR2Go five CITIES report an analysis of one-way carsharing across UNIQUE urban Environments Impacts of car2go on Vehicle Ownership, Modal Shift, . miles were found to range between 3% and 7.5% of all car2go miles driven. For San Diego, which operated a fully electric fleet of vehicles at th e time, staff miles comprised 17% of all miles .