Transcription
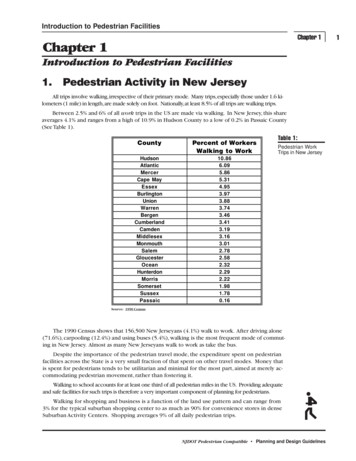
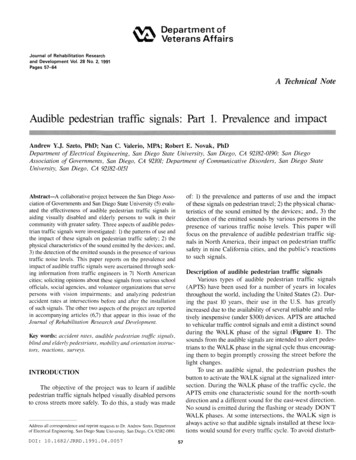
Department ofVeterans AffairsJournal of Rehabilitation Researchand Development Vol. 28 No. 2, 1991Pages 57-64A Technical NoteAudible pedestrian traffic signals: Part 1. Prevalence and'Andrew Y.J. Szeto, PhD; N a n C. Valerio, MPA; Robert E. Novak, P h DDepartment of Electrical Engineering, Sun Diego State University, San Diego, CA 92182-0190; San DiegoAssociation of Governments, Sun Diego, CA 92101; Department of Communicative Disorders, Sun Diego StateUniversity, Sun Diego, CA 92182-0151Abstract-A collaborative project between the San Diego Association of Governments and San Diego State University (5) evaluated the effectiveness of audible pedestrian traffic signals inaiding visually disabled and elderly persons to walk in theircommunity with greater safety. Three aspects of audible pedestrian traffic signals were investigated: 1) the patterns of use andthe impact of these signals on pedestrian traffic safety; 2) thephysical characteristics of the sound emitted by the devices; and,3) the detection of the emitted sounds in the presence of varioustraffic noise levels. This paper reports on the prevalence andimpact of audible traffic signals were ascertained through seeking information from traffic engineers in 71 North Americancities; soliciting opinions about these signals from various schoolofficials, social agencies, and volunteer organizations that servepersons with vision impairments; and analyzing pedestrianaccident rates at intersections before and after the installationof such signals. The other two aspects of the project are reportedin accompanying articles (6,7) that appear in this issue of theJournal of Rehabilitatiotz Research and Development.Key words: accident rates, audible pedestrian trafic signals,blind and elderly pedestrians, mobility and orientation instmctors, reactions, surveys.INTRODUCTIONThe objective of the project was to learn if audiblepedestrian traffic signals helped visually disabled personsto cross streets more safely. To d o this, a study was madeAddress all correspondence and reprint requests to Dr. Andrew Szeto, Departmentof Electrical Engineering, San Diego State University, San Diego. CA 92182-0190.DOI: 10.1682/JRRD.1991.04.0057of: 1) the prevalence and patterns of use a n d the impactof these signals on pedestrian travel; 2) the physical characteristics of the sound emitted by the devices; a n d , 3) thedetection of the emitted sounds by various persons in thepresence of various traffic noise levels. T h i s paper willfocus on the prevalence of audible pedestrian traffic signals in North America, their impact on pedestrian trafficsafety in nine California cities, and the public's reactionsto such signals.Description of audible pedestrian traffic s i g n a l sVarious types of audible pedestrian traffic signals(APTS) have been used for a number of years in localesthroughout the world, including the United States (2). During the past 10 years, their use in the U.S. has greatlyincreased due to the availability of several reliable a n d relatively inexpensive (under 300) devices. APTS are attachedto vehicular traffic control signals and emit a distinct soundduring the WALK phase of the signal ( F i g u r e 1). Thesounds from the audible signals are intended t o alert pedestrians to the WALK phase in the signal cycle thus encouraging them to begin promptly crossing the street before thelight changes.To use an audible signal, the pedestrian pushes thebutton to activate the WALK signal at the signalized intersection. During the WALK phase of the traffic cycle, theAPTS emits one characteristic sound for the north-southdirection and a different sound for the east-weat direction.No sound is emitted during the flashing o r steady D O N ' TWALK phases. At some intersections, the W A L K sign isalways active so that audible signals installed a t these locations would sound for every traffic cycle. To avoid disturb-
Journal of Rehabilitation Research and Development Vol. 28 No. 2 Spring 1991ing nearby residents. timers can be added to turn off theaudible signals at night.Two brands of audible traffic signals that are commonly used in the United States and Canada are theSonalert buzzers manufactured by Mallory CapacitorCompany's Emhart ElectricalIElectronic Group, Indianapolis, IN, and the audio pedestrian signal manufactured byTraconex, Inc., Santa Clara, CA, under license fromNagoya Electric Works of Nagoya, Japan. Both devicesattach to the pedestrian signal box of the traffic signal andare wired to emit a distinct sound with the WALK or greenportion of the signal.The Sonalert is a small (4.3 cm diameter, 5.1 cm longcylinder) piezoelectric signaling device intended for installation inside the chassis of a crosswalk light box.* Installation of the Sonalert requires that a 3 cm hole be drilledinto the crosswalk light box and the unit installed throughthis opening, According to its manufacturer (3), SonalertModel SC616WY produces three different sound patterns:pulsating tones at 1750 Hz or 3000 Hz and a warble tonethat switches between these two frequencies. SonalertModel SC616WXY produces five different sound patterns:pulsating tones at 1750 Hz and 3000 Hz, continuous tonesat these two frequencies, and a warble tone that switchesbetween these frequencies. Both Sonalert units are controlled and powered from a 6-16 VDC source and cangenerate a sound pressure of 75 dB at 0.6 m (2 ft).The NagoyaITraconex APTS (8) is a self-contained,bell-shaped and weatherproof unit that attaches externallyto the pedestrian crosswalk signal box (Figure 1). TheNagoyaITraconex signals emit an electronic "cuckoo"sound to denote the north-south direction of travel and anelectronic "chirp" sound to denote the east-west directionof travel. The manufacturer lists the following specifications for the "cuckoo" sound: frequency base of 1100 Hz;sound duration of 0.6 seconds; and a frequency deviation(warble) of 120 Hz. The manufacturer's specifications forthe "chirp" sound are a continuous frequency variation of800 Hz that lasts 0.2 s with a frequency base of 2800 Hz.The output for both units is specified to be 90 dB soundpressure level (SPL, re; 20 pPa) at 1 m and self-switchingbetween one of two ad-lustable output volume levels depending on the ambient noise level. Because the Traconex signalis so widely used in the western United States, especiallyin California, and because of numerous cooperative studysites in California, this research effort focused on theNagoyaITraconex unit.PREVALENCE OF AUDIBLE: T R A F F I C SIGNALS*Persondl cornmunicdtlon a t WindwrhP W,c t\ Appllcdtlons Eng neer.Mdlloryc d p d Ct ) rI I I P Ijlldldfldp fl\. YIN. June 22 1989To determine the numbers and locations of APTS, asimple fact-finding survey was mailed to traffic engineersBeneficiaries of audible pedestrian t r a f f i c signalsThe stated purpose for using audible traffic signals isto help visually impaired pedestrians travel more safelyand confidently (8,ll). Visually impaired a n d elderly persons may walk slowly and thus would need the full walkcycle to traverse the street completely before the signalchanges. Therefore, it is beneficial for them to knowdefinitely that they have the WALK signal s o they can begincrossing the street without delay.Visually impaired and elderly persons comprise a sizable population in the United States. The U.S. Bureau ofthe Census (9) reports that 12.8 million persons (or 7 percent of the U.S. population over 15 years of age) have visualdisabilities, and 1.7 million (or 13 percent) of these havesevere visual disabilities. Almost half (45 percent) of thepopulation with vision disabilities are elderly, and 71 percent of those with severe visual dysfunctions are elderly.The number of persons over 65 has almost doubled in thelast quarter century, and actuarial trends (9) show thatthe elderly population will grow even faster in the next25 years.A literature search yielded little on the prevalenceand impact of audible pedestrian traffic signals. Hulshcer(1) examined problems related to providing an audibledevice for blind pedestrians. In Wilson's study (11), whichwas cited in an Issue Paper by the Institute of Transportation Engineers (2), pedestrians were found to cross thestreet more quickly when APTS were present. In his feasibility study of audible pedestrian signals, Oliver (4)reported that 103 U.S. cities and 34 foreign locations havesome type of audible signals. Uslan (10) reported that hisblind subjects reacted positively to audible signals, especially at intersections that had complex traffic flow patterns.To ascertain the prevalence and impact of APTS, thisproject asked three questions: 1) How prevalent are audible traffic signals in North America? 2) Have these signals had an impact on pedestrian safety? a n d , 3) What aresome of the reactions to these signals'?Answers were sought by contacting persons responsible for the installation of audible traffic signals, analyzing pedestrian traffic accident rates at intersections beforeand after the installation of audible traffic signals, andinterviewing organizations that work with persons who havevisual impairments.
SZETO et al.Audible Pedestrian Traffic Signals: Part 1Figure 1.The bell-shaped NagayalTraconex audible pedestrian traffic signal is mounted atop the pedestrian signal box and pointed downwardin 71 North American cities reported to have one or moreaudible traffic signals in their jurisdiction. The surveysought information about their signal installations. Followup was made by telephone.Of the 71 cities surveyed in 1988, 52 cities and various locations in Connecticut had audible pedestrian trafficsignals. In the 52 cities and the State of Connecticut, therewere 288 intersections with audible signals. Of these, 184(64 percent) intersections have the NagoyaITraconex units,with the great majority being in the western U.S. andCanada. In contrast, the unit by Mallory (or some similarbuzzer system) tended to be more popular in the easternUnited States.The distribution of audible signals was quite uneven.Among the 52 cities identified as having APTS, 25 (47percent) were in California. Nearly half the 52 cities hadonly one or two intersections with audible signals. Onlyseven cities, mostly in California, had audible signals atmore than 10 locations. California cities had 129 intersections with audible signals. At the time of the survey, 29of the 52 cities reported that they expected to install additional audible signals in the near future.The survey respondents were also asked to identifythe locations of their audible signals. The most commonlocation for APTS was in business districts where 60 percent of the cities have installed them. The next most popularlocations, with 38 percent each, were entrances to collegesor universities and intersections near service centers forpersons with disabilities. Audible signals were also installednear schools (21 percent); residential areas (15 percent);medical centers (13 percent); government offices andseniors' service centers (6 percent each); and tourist attractions and transit centers (2 percent each).Among the 52 cities with APTS, 43 (81 percent) placedat least one of their signals at intersections with pedestrianactuated controls (push buttons). Ten cities (19 percent)have timers attached to the signals to deactivate the signals at night.
Journal of Rehabilitation Research and Development Vol. 28 No. 2 Spring 1991IMPACT ON PEDESTRIAN TRAFFIC SAFETY2) the availability of detailed accident records; 3) a minimum of 2 years of experience with audible signals; and,4) the usage of the same equipment, the Traconex audible pedestrian signal. By limiting the choice of cities toone state and the type of APTS to the Traconex brand, thenumber of variables that could affect the data (e.g., themotor vehicle code, installation procedures for APTS,accident reporting requirements, and weather pattern)was minimized.Table 1shows that the nine California cities had a totalof 58 intersections and two mid-block crossings with audi-Nine California cities were surveyed to learn aboutpedestrian accidents at the intersections with audible signal Pedestrian accident records were reviewed for thecalendar year in which the signals were installed and forthe two previous calendar years and the two calendar yearsafter their installation. The pedestrian accident data fromthese nine cities are summarized in Table 1.The nine cities were chosen on the following basis:1) willingness of the city staff to participate in the research;Table 1.Impact of audible signals on pedestrian accident ratesCityT251343Beverly HtllsCupertinoHunttngton BeachLos AngelesNorwalkSan DlegoSan JoseSanta MotilcaWest Cov na615----03521303-----ACCK C22822212059-a - 5-TOTAL60- -- ---IntersectionsWW-027-- - - -33- ---------438031648Number ofINJ NO INJ049638011010004134703611442412333410 -90000001Before installation of audible signalsCupertinoHuntington BeachLos AngelesNorwalkSan DiegoSanta MonicaWest CovinaTotalAfter ihstallation of audible signalsCupertinoHuntington BeachLos AngelesNorwalkSan DiegoSanta MonicaWest CovinaTotalT W W-0 ACC INJ Total intersectionsIntersections with accidentsIntersections without accidentsAccidentsInjured pedestrians24271
SZETO et al.ble pedestrian signals. Of these, 31 intersections and thetwo mid-block crossings had no pedestrian accidents in the5 years studied. Of the 27 (45 percent) intersections thathad accidents, exactly half the 48 accidents occurred beforethe installation of the audible pedestrian signals and halfafterwards. Twenty persons suffered injuries in the 24 accidents before the installation of the audible signals, including one multiple-injury accident. Twenty-seven personssuffered injuries after APTS installation, including threemultiple-injury accidents. There were no injuries in sixof the 48 accidents.Of the 47 pedestrians injured in the 48 accidents, twoaccidents involved persons carrying a white cane. One ofthese accidents occurred before the installation of the audible signals and one afterwards. Both accidents occurredat intersections near service centers for disabled persons,and the driverlvehicle was at fault. There were no pedestrian deaths, and alcohol was not involved in any of the48 accidents studied.Age and sex of the injured pedestrians were detailedin 26 (54 percent) of the accidents. Ten injured pedestrians were in the 0-17 age group, with eight being injuredin accidents before installation of the signal and two afterwards. In the over 18 age group, more females than maleswere injured before the installation of APTS. In the accidents which occurred after the installation, the numbersof males and females injured were approximately the same.Audible Pedestrian Traffic Signals: Part 1Type ofirztersection. Two types of intersections wereencountered in the analysis of traffic accident data (Table2). Most intersections (72 percent) at which pedestrian accidents occurred were 4-leg intersections in which two streetscrossed each other and continued onward. There were15 intersections of the other type, called a 3-leg or "T"intersection, in which one of the streets ended at the intersection. Thirty-seven (86 percent) of the forty-three 4-legintersections were regular, that is, the streets crossed atright angles. The other six were skewed, nonperpendicular crossings. For the 3-leg intersections, 12 were regularand three were skewed.Twenty-one (49 percent) of the 4-leg intersections hadaccidents during the period studied, and six (40 percent)of the 3-leg intersections had accidents. The number ofaccidents at 4-leg intersections decreased by o n e after theinstallation of the audible pedestrian signals. However, 3-legintersections experienced an increase of two accidents. Theskewed 3-leg intersections experienced no change in thenumber of accidents before and after APTS installation.Further analysis of the available accident data showedthat intersection type made little difference in the incidencerate for accidents. Whereas 4-leg intersections comprised72 percent of the intersections, they experienced 78 percent of the intersections at which there were accidents.Likewise, 3-leg intersections con prised25 percent of theintersections and experienced 22 percent of the accidents.Table 2.Pedestrian accidents by type of intersectionsTotal4-leg intersectionsRegularNumber of intersectionsTotal 60"Intersections withped. accidentsTotal 27Intersections withoutped. accidentsTotal 33Number of pedestrianaccidentsTotal 48Pedestrian accidentsbefore APTSTotal 24Pedestrian accidentsafter APTSTotal 24"Two mid-block pedestrian crossings experienced no accidentsSkewed'Total3-leg i tersectionsRegularSkewed
Journal of Rehabilitation Research and Development Vol. 28 No. 2 Spring 1991One important variable-whether any of the injuredpedestrians knew of the signal, heard it, and knew whatthe sound meant-could not be determined from the accident records. Furthermore, the pedestrians involved in theseaccidents could not be contacted because their names andaddresses were confidential. Variables that could be ascertained from the accident data are discussed below.Vehicle activity. Accidents in which the party at faultwas the driverivehicle were reviewed in terms of when theaccidents occurred relative to the installation of the APTSand what was the direction of vehicular travel. Both beforeand after installation of audible signals, the driverlvehicle was at fault in 60 percent of the accidents, and the vehicle was heading straight ahead through the intersection inhalf the accidents. There were, however, fewer pedestrianaccidents involving cars turning left after the installationof the APTS (25 percent versus 17 percent). This may suggest that fewer pedestrians inappropriately crossed the streetduring the left turn signal after the installation of audiblesignals. Two-thirds of the accidents occurred in the firstfull year following installation of the audible signals, anddropped substantially in the second year.Pedestrian activity. The accidents in which the pedestrian was at fault were reviewed with respect to the typeof intersection and how long the APTS had been installed.Following installation, two-thirds of the accidents occurredin the first full year after the audible signals were installed;the remainder occurred in the year of installation (Table3). In the second year after APTS installation, none of theaccidents were caused by the pedestrian. Such a trend mayindicate that pedestrians became acquainted with the signal over a period of time before they paid attention to themor understood what the sounds meant.Prevalence of accidents. The number of accidents perintersection was reviewed. Half (13) of the intersectionsexperienced only one accident, seven intersections had twoaccidents each, and another seven had three accidents each.The accident records seemed to indicate that fewer pedestrian accidents occurred at the more dangerous intersections (i.e., intersections previously experiencing two ormore pedestrian accidents) following APTS installation.Weather and lighting conditions. The weather andlighting conditions were reviewed for those pedestrian accidents which occurred after the installation ofaudible signals. Where the driverivehicle was at fault, theweather was clear in 60 percent of the accidents; andwhere the pedestrian was at fault, it was clear in 89 percent of the accidents. However, nearly 45 percent of theaccidents where the pedestrian was at fault occurred whenit was dark.Table 3.Party at fault in pedestrian accidentsTime of APT§ installationVehicleBefilm in.stallatiotz of APTS2 calendar years beforeAjicr in.stullrriotz oJ'APTSCalendar year of installation1st calendar year after2nd calendar year afterSubtotals for installationParty at FaultPedestrian Unknolvn1392310215360-9--Ehicle trafic volumes. In terms of vehicle trafficvolume, two-third of the intersections experiencing pedestrian accidents ranked at the top for traffic volume. Theseintersections accounted for 83 percent of the accidentsbefore installation of audible signals but only 58 percentafter installation. This suggests that audible signals canreduce the number of pedestrians accidents at intersectionswith high traffic volumes.REACTIONS TO AUDIBLEPEDESTRIAN TRAFFIC SIGNALSInstallation of audible signals has not been withoutcontroversy (4,10,12) with regards to whether they helpedpersons with vision disabilities to cross streets. Believingthat the signals do help, the American Council of the Blindsupports their installation. On the other hand, the NationalFederation of the Blind reports that the signals are greatlydisliked by blind persons who do not find them useful (12).One consequence of this disagreement is hesitancy by somepublic official to continue installing them.To determine the breadth of the agreement with eitherpoints of view, surveys were distributed to: 1) organizations providing services to persons with vision impairmentsand to older adults; 2) counselors of blind and visionimpaired students at educational institutions; and, 3) orientation and mobility instructors who teach blind persons totravel using the long cane technique. The purpose of thesurveys was to ascertain how clients and students felt aboutthe usefulness and desirability of the audible signals. Visually impaired persons themselves could not be readily contacted because their names and addresses were confidential.
SZETO et al.Survey results from organizations that serve the elderlyand persons with visual impairmentsEighty organizations in the United States and one inCanada were surveyed about their knowledge and appraisalof audible traffic signals. Survey responses were receivedfrom 37 organizations.Thirty-three organizations (89 percent) were familiar withaudible signals. Organizations serving blind persons andschools with programs for blind students had higherresponse rates than organizations serving senior citizens.Almost all (94 percent) respondents were aware of audible signals. Four of five reported that their clients hadfavorable experiences with APTS; the remainder reportedthat their clients had negative experiences.Half the organizations have taken a position on audiblesignals. Of these, 83 percent support the installation ofAPTS because the signals were or could be helpful totheir clients.Almost half the responding organizations have advocatedfor the installation of audible signals, and 71 percent ofthese efforts have proven successful.Respondents reported that their blind members liked thesignals and found them useful at complex intersections(e.g., 5-legged intersections, divided roads with left turnlanes, etc.) and where there is light parallel traffic flow.Respondents noted a need for standardization of equipment and for training in its use.Survey results from educators and school counselorsBecause APTS have been installed near educationalinstitutions, all California school districts and institutionsof higher education known to have audible signals withintheir communities were contacted by phone. The instructors and counselors were invited to express their opinionsand experiences with the signals and describe studentreactions to them. Survey findings from 17 Californiaeducational institutions were as follows.Blind students were trained to use audible signals at about12 years of age, and their teachers reported that studentsfound the signals easy to use.Counselors at colleges and universities with audiblesignals nearby reported that their students liked the signals and found them useful. No counselor reportedreceiving criticism of the signals from any of theirblind students.Half the respondents volunteered that their sighted students also found the signals useful, as did blind professors at two of the surveyed institutions.Audible Pedestrian Traffic Signals: Part 1Survey results from instructors of blind personThe entire membership of the California Associationof Orientation and Mobility Specialists was surveyed bymail. The instructors reported that they had discussed audible signals at their meetings and that many members havehad experience in teaching blind clients how to use them.Of the 45 members surveyed, 27 responded; only onerespondent was not personally familiar with audible signals. Major findings from this survey were a s follows.* Most clients found the signals easy to use. Nearly 60****percent of the respondents reported that their clientsusually or always found the signals helpful.More than half of the clients learned to use the audiblesignals after only one to two training sessions.Clients especially liked knowing when the WALK signal was illuminated, enabling them to feel safer whencrossing a street.Clients had trouble remembering which sounds designated the north-south and east-west directions of travel.Clients had difficulty locating the push button to actuate the pedestrian WALK signal.Clients sometimes became disoriented in crossing streetswhen the audible sound stopped as the WALK lightchanged to a flashing red DON'T WALK light.Some clients had difficulty hearing the signal over thetraffic noise, properly aligning themselves at the corner,or became excessively dependent on the audible signal.CONCLUSIONS AND RECOMMENDATIONSAudible pedestrian traffic signals have been installedwith the intention of helping visually impaired persons crossstreets with greater safety and confidence. This article hasexamined the prevalence of these devices in North Americaand the impact of the NagoyaiTraconex APTS o n accidentrates in nine California cities. Reactions and acceptanceof APTs were ascertained by surveying knowledgeableprofessionals and institutions that interact regularly withvisually impaired and elderly persons. The survey resultsand accident data appear to support the following conclusions and recommendations.* Approximately 300 intersections in the United States andCanada have installed APTS, and many cities are considering installing them in the near future. T h e Nagoya/Traconex unit is used almost exclusively in the westernU.S., while the Sonalert unit by Mallory is more widelyused in the eastern U.S.
Journal of Rehabilitation Research and Development Vol. 28 No. 2 Spring '1991Presently, the distribution of APTS is quite uneven, witha vast majority being located in California.* At intersections where the WALK signal is always operating, traffic engineers have added timers to deactivate the APTS at night and thus avoid disturbingnearby residents.Based on the accident data from nine California cities,the audible signals have not yet made a clear impact onpedestrian accident rates at the intersections studieddespite generally favorable user responses to such signals.For some of the intersections studied, the audible signal appeared to lessen the frequency of inappropriatepedestrian crossings.The driverhehide was at fault in nearly two-thirds of theaccidents so audible signals would not have helped insuch cases.* The pedestrian was at fault in just over one-third of theaccidents following APTS installation. These accidentsoccurred either in the year of APTS installation or during the following year. No pedestrian-caused accidentsoccurred in the second full year following APTS installation. It appears that APTS may be beneficial to allpedestrians once they become familiar with them. Therefore, public educational programs regarding APTS shouldaccompany their installation.Because fewer persons under age 17 were involvedin accidents following APTS installation, audible signalsmay especially help young people to cross streetsmore safely.There is substantial support for audible signals from thesurveyed organizations and from professional that provide training services to visually impaired pedestrians.Many blind persons, once properly trained, find theaudible signals useful in helping thern to cross streetssafely and with greater confidence. However, a minority of respondents do not want audible signals and believethat they would not be useful to blind pedestrians.Programs should be established at senior citizen centers and other similar agencies to instruct older adults,who are developing vision impairments as part of theaging process, in pedestrian safety and how to use audible signals.Some visually impaired persons had difficulty findingthe traffic light pole and push button that activated theWALK light. Standardizing the location of such polesand their push buttons at corners of intersections wouldtherefore be helpful.Additional research is needed to address severalunanswered questions: What is the impact of the Sonalertand other types of audible signals on pedestrian accidentrates? Although the number of pedestrian accidents at theintersections studied did not change, did the installationof APTS reduce the pedestrian accident rate if vehicularand pedestrian traffic volume changes were taken intoaccount? Would expanding the traffic accident rates beyondthe 2 years following APTS installation establish a clearertrend as to their impact on pedestrian traffic safety?ACKNOWLEDGMENTSThis project was supported in part by a grant from theNational Institute on Disability and Rehabilitation Research. Thesuggestions of the reviewers and editor have been appreciated.REFERENCESHulscher FR: Traffic signal facilities for blind pedestrians. Australian Road Research Board Proceedings 8:13-26,1976.Institute of Traffic Engineers: ITE Issue Paper: AudiblePedestrian Trafic Signals for the Blind. Washington, DC.Mailory Capacitor Company: Multi-tone Sonalert Technical Bulletin. Indianapolis, IN: Emhart Electrical1Electronic Group, 1988.Oliver MB: Audible pedestrian signals: A feasibility study.Master's thesis, Virginia Polytechnic Institute and StateUniversity, 1989.San Diego Association of Governments: SANDAG,Evaluation of Audible Pedestrian Traffic Signals, 1988.Szeto AYJ, Valerio NC, Novak RE: Audible pedestriantraffic signals: Part
The distribution of audible signals was quite uneven. Among the 52 cities identified as having APTS, 25 (47 percent) were in California. Nearly half the 52 cities had only one or two intersections with audible signals. Only seven cities, mostly in California, had audible signals at more than 10 locations. California cities had 129 intersec-