Transcription
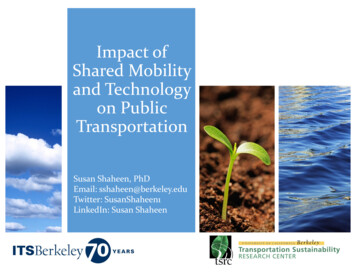
Impact ofShared Mobilityand Technologyon PublicTransportationSusan Shaheen, PhDEmail: sshaheen@berkeley.eduTwitter: SusanShaheen1LinkedIn: Susan Shaheen
Overview Defining shared mobility and impacts Declines in public transit use Key questions for public transit Need for research Upcoming studies and current reports UC Berkeley,2015 UC Berkeley,2018
Defining Shared MobilityShared mobility—the shared use of a vehicle, bicycle, orother low-speed travel mode—is an innovativetransportation strategy that enables users to have short-termaccess to a mode of transportation on an as-needed basis.Shaheen et al., 2016 UC Berkeley,2015 UC Berkeley,2018
Shared Mobility ImpactsEnvironmental Effects Can yield lower GHG emissions via decreased VMT, low-emissionvehicles, carbon offset programs Can reduce vehicle ownershipSocial Effects Offers “pay-as-you-go” alternative to vehicle ownership Reasonable for college students and low-income households Can increases mobility of low-income residents, disabled, and collegestudents Provides car use without bearing full ownership costTransportation Network Effects Takes cars off the road via reduced VMT, forgone/delayed vehiclepurchases or sale of vehicle Reduced parking demand Can complement/complete with alternative transportation modes,e.g., public transit, walking, biking, etc. , and can help address first andlast mile issueShaheen, 2017 UC Berkeley,2018 UC Berkeley,2015
One-Way Carsharing StudyKey Findings: Between 2% to 5% of members sold a vehicle due tocarsharing across study cities 7% to 10% of respondents did not acquire a vehicledue to car2go Car2go took estimated 28,000-plus vehicles off of roadand reduced parking demand Average age of vehicles sold ranged between 12 and15.7 years across the five cities; entire sample of soldvehicles had an average age of 14.4 years across allcitiesMartin and Shaheen, 2016 UC Berkeley,2018 UC Berkeley,2015
One-Way Carsharing: 5-CitiesTotal VehiclesRemoved perCarsharingVehicleRange ofVehiclesRemoved perCarsharingVehicle% Reductionin VMT byCar2go Hhd%Reductionin GHGs byCar2go hases)Calgary, AB(n 1,498)29112 to 11-6%-4%San Diego, CA(n 824)1671 to 7-7%-6%Seattle, WA(n 2,887)37103 to 10-10%-10%Vancouver, BC(n 1,010)2792 to 9-16%-15%Washington, D.C.(n 1,127)3583 to 8-16%-18%Martin and Shaheen, 2016 UC Berkeley, 2018
Shifts in Rail and BusAs a result of my membership with car2go, I use the bus.As a result of my membership with car2go, I use rail 70%60%50%40%30%20%10%0%Seattle, N 333046%18%22%0%Did not usebefore or now2% 1% 1%Much moreoften8% 5%Washington DC, N 131811%3%More oftenSan Diego, N 819San Diego, N 81865%64%About the same2%Less often9%1% 3%4% 4%8%Much less often Changed, butnot because ofcar2go70%60%50%40%30%20%10%0%63%27%3%8%Did not usebefore or nowCalgary, N 18456% 9%Did not usebefore or now16% 19%1% 2%Much moreoften5% 4%More often3% 5%About the sameLess often2% 1% 1%Much moreoften6% 7%16%24%10%4% 3%2%More oftenAbout the sameLess often4% 6% 8%Much less often Changed, butnot because ofcar2goAs a result of my membership with car2go, I use the bus.Vancouver, N 138655%Washington DC, N 130035%As a result of my membership with car2go, I use rail 70%60%50%40%30%20%10%0%Seattle, N 333361%56%5% 7%Much less often Changed, butnot because ofcar2go45%40%35%30%25%20%15%10%5%0%Vancouver, N 1385Calgary, N 184539% 41%22%19%4%Did not usebefore or nowMartin and Shaheen, 201638%1% 1%Much moreoften10% 8%4% 3%More oftenAbout the sameLess often5% 6%Much less often Changed, butnot because ofcar2go UC Berkeley, 2018
Bikesharing Impacts§§§§§Large cities - Bikesharing members rode thebus less, due to reduced cost and faster travelAll cities - Increased bus use attributed tobikesharing improving access to/from a buslineSmall cities – increased rail useLarge cities – decreased rail useShifts away from public transit often due tofaster travel times and cost savings withbikesharingShaheen et al., 2014; Shaheen and Chan 2015 UC Berkeley, 2018
Bikesharing Impacts (Cont’d)5.5%of bikesharing members sold orpostponed a vehicle purchase58%of bikesharing members increasedcycling50%of bikesharing members reducedpersonal auto useShaheen et al., 2014; Shaheen and Chan 2015 UC Berkeley, 2018
Ridesourcing Modal Shift ImpactsStudy AuthorsLocationSurvey YearRayle et al.San Francisco,CA (2014)HenaoDenver andBoulder, CO(2016)Clewlow and Mishra*Seven U.S. Cities**Two Phases(2014 – 2016)Drive7%37%39%Public Transit30%22%15%Taxi36%10%1%Bike or Walk9%12%23%Would not have madetrip8%12%22%Other / OtherRidesourcing/TNC10%7%-*Impacts in this study were weighted by usage and aggregated across 7 cities.**Cities in study include: Austin, Boston, Chicago, Los Angeles, San Francisco, Seattleand Washington, DC.Shaheen et al., 2018 UC Berkeley,2018 UC Berkeley,2015
Ridesourcing VMT Impacts 3.5% increase in citywide VMT and 7% increase in Manhattan,western Queens, and western Brooklyn in 2016 (Schaller, 2017) In Denver, average of 100 vehicle miles to transport passenger60.8 miles ( 40% deadheading miles) (Henao, 2017) In SF, SFCTA (2017) found 20% of total ridesourcing VMTincluded deadheading miles May be increase in VMT due to ridesourcing, although exactmagnitude still unknown and likely varies by location (e.g., density,land use, and built environment) Services still new (August 2012) and evolving (e.g., pooling, SAVs)Shaheen et al., 2018 UC Berkeley,2018 UC Berkeley,2015
Growing Number of Pooled Options§Ridesplitting/pooling - Users may volunteer to sharea for-hire ride for a discount; may or may not be pooleddepending on availability (e.g., UberPOOL, Lyft Line)§Taxi Sharing – Users may opt to share a taxi cab (e.g.,Bandwagon) UC Berkeley,2018 UC Berkeley,2015
ConvergenceElectrificationMobileTechnologiesSECAT. Papandreou, 2016SharedMobilityAutomationShaheen et al., 2016 UC Berkeley,2018 UC Berkeley,2015
Declines in Public Transit RidershipIncreaseNo ChangeDecreaseNTD, 2017 UC Berkeley,2015 UC Berkeley,2018
Key Questions forPublic Transportation When does shared mobility complement publictransit and when does it compete? How does it vary by mode & context? What factors influence complementarity vs.competition? How can shared mobility be used to enhanceaccessibility to areas without public transit service? How can shared mobility be used to improve efficiencyand/or reduce service inefficiencies? How should public transportation respond to short-,mid-, and long-term changes? (e.g., shared mobility,AVs, SAVs, and other innovations)Shaheen, 2017 UC Berkeley,2015 UC Berkeley,2018
Shared Mobility and PublicTransportation: ResearchMore study needed to evaluate traveler behavior andelasticity of individual and combined variables Cost, occupancy Fare type (e.g., pass, per trip, per mile) and stability (e.g.,fixed vs. variable pricing) Temporal and spatial scale Convenience Travel time Wait / transfer times Number of modes Other factorsImage: Hofstra UniversityShaheen, 2017 UC Berkeley,2018 UC Berkeley,2015
Recent ublications/fhwahop16023/fhwahop16023.pdfShaheen, 107556/ UC Berkeley, 2018
Disrupting Mobility (2017)Available ts-InnovativeTransportation/dp/3319516019Shaheen, 2017 UC Berkeley, 2018
Acknowledgements Shared mobility operators, experts, and industryassociations Federal Highway Administration Mineta Transportation Institute, San Jose StateUniversity California Department of Transportation American Planning Association Adam Cohen, Rachel Finson, Elliot Martin, HannahTotte, Adam Stocker, Mark Jaffee, TSRC, UC Berkeley UC Berkeley,2018 UC Berkeley,2015
As a result of my membership with car2go, I use rail San Diego, N 818 Seattle, N 3330 Washington DC, N 1318 6% 1% 5% 63% 16% 3% 5% 9% 2% 4% 55% 19% 5% 7% 0% 10% 20% 30% 40% 50% 60% 70% Did not use before or now Much more often More often About the same Less often Much less often Changed, but not because of car2go As a result of my .
