Transcription
The Total Economic Impact Of IBM Planning Analytics withWatsonCost Savings And Business BenefitsEnabled By Planning Analytics with WatsonDECEMBER 2021A FORRESTER TOTAL ECONOMIC IMPACT STUDY COMMISSIONED BY IBM
Table Of ContentsExecutive Summary .1Consulting Team: David ParkMbenoye DiagneThe IBM Planning Analytics with WatsonCustomer Journey .6Key Challenges.6Composite Organization .7Analysis Of Benefits .8Optimized Staffing And Inventory Management .8Incremental Gross Profit Uplift . 10Streamlined Budgeting Process . 11Faster System Processing . 13Streamlined Forecasting Process. 15Cost Savings From Retired Legacy PlanningSolutions . 17Unquantified Benefits . 18Flexibility . 19Analysis Of Costs . 20Licensing, Support, And Implementation Services. 20Frontline Deployment Costs . 21Internal Deployment Costs . 22IBM Planning Analytics with Watson User Training. 23Report Development . 24Financial Summary . 26Appendix A: Total Economic Impact . 27Appendix B: Endnotes . 28ABOUT FORRESTER CONSULTINGForrester Consulting provides independent and objective research-based consulting to help leaders succeed in theirorganizations. For more information, visit forrester.com/consulting. Forrester Research, Inc. All rights reserved. Unauthorized reproduction is strictly prohibited. Information is based onthe best available resources. Opinions reflect judgment at the time and are subject to change. Forrester , Technographics ,Forrester Wave, RoleView, TechRadar, and Total Economic Impact are trademarks of Forrester Research, Inc. All othertrademarks are the property of their respective companies.THE TOTAL ECONOMIC IMPACT OF IBM PLANNING ANALYTICS WITH WATSON
Executive SummaryModern businesses require purpose-built planning and analytics applications that cutacross the enterprise. Gone are the days when these tools served only to support theplanning and budgeting process. Instead, businesses have evolved to leverage planningand analytics solutions across any number of functions, such as sales, product, or supplychain.1 These organizations require solutions they can flexibly deploy for various usecases while continuing to enable core financial planning and analysis.IBM Planning Analytics with Watson is acomprehensive planning and analytics solutiondesigned to integrate and streamline anorganization’s planning workflows, break down datasilos across lines of business, and drive operationalef f iciencies for both knowledge and frontline workers.IBM commissioned Forrester Consulting to conduct aTotal Economic Impact (TEI) study and examinethe potential ROI enterprises may realize bydeploying IBM Planning Analytics with Watson. Thepurpose of this study is to provide readers with af ramework to evaluate the potential financial impactof IBM Planning Analytics with Watson on theirorganizations.To better understand the benefits, costs, and risksassociated with this investment, Forrester interviewedf our decision-makers with experience using PlanningAnalytics with Watson. For the purposes of this study,Forrester aggregated the interviewees’ experiencesand combined the results into a single compositeorganization.Prior to leveraging IBM Planning Analytics withWatson, the interviewees’ organizations lacked datacultures that would allow them to make the bestdecisions using accurate, real-time data. Frontlineworkers operated based on obsolete sales targetsand inventory numbers while knowledge workersexecuted planning workflows using manual,spreadsheet-based tools and processes that weresiloed, error-prone, and slow to compute.THE TOTAL ECONOMIC IMPACT OF IBM PLANNING ANALYTICS WITH WATSONKEY STATISTICSReturn on investment (ROI)Net present value (NPV)159% 3.2MAf ter the investment in Planning Analytics withWatson, the interviewees’ organizations were able tounif y their disparate planning systems whileincreasing the speed and reducing the back-officeburden related to various planning workflows. At thesame time, the organizations leveraged insights fromPlanning Analytics with Watson to generatemaximum efficiency in frontline operations, whichimpacted everything from staffing models to real-timeaccounting of inventories.KEY FINDINGSQuantified benefits. Risk-adjusted present value(PV) quantified benefits include: Optimized frontline operations, includingincreased staffing efficiency and reducedinventory shrinkage. Real-time reportingthrough Planning Analytics with Watson gavef rontline managers the data they needed todiscern how many employees their organizationswould need at any given moment to meet1
EXECUTIVE SUMMARYcustomer demand, which allowed managers tostaf f their branches with 10% more efficiency.Frontline managers also had better insight intotheir organizations’ inventory levels, and theywere able to reduce annual inventory shrinkageby up to 80%. For the composite organization,these operational benefits are worth a three-yearPV of 1.8 million.single and real-time source of truth, andstreamlined burdensome administrative stepssuch as data collection and consolidation. Thecomposite organization experiences a 63%reduction in labor effort needed to complete itsannual budgeting cycle, which leads to a threeyear PV cost savings of 1.2 million.Reducedbudgeting effortIncreased staffingefficiency63%10% Increased topline revenue. With improved salesbenchmarking and reporting, the interviewees’organizations were able to set more accuratesales targets, monitor and measure theperf ormance of individual associates, anddevelop action plans or incentive structuresaround specific levels of performance. For thecomposite organization, this increased visibilityleads to a sales uplift equal to 0.5% of its totalgross revenues. From a subsequent gross profitperspective, the composite organizationexperiences present value net cash flows of 424,000.Sales upliftFaster dataprocessing0.5% Streamlined budgeting cycle. Centralizingplanning processes on an enterprise levelallowed the interviewees’ organizations to breaksiloes across disparate departments and lines ofbusiness, all contributing separately to thebroader annual budget. In doing so, IBMPlanning Analytics with Watson promotedcollaboration and communication, created aTHE TOTAL ECONOMIC IMPACT OF IBM PLANNING ANALYTICS WITH WATSONAccelerated system processing. Leveragingthe powerful IBM TM1 calculation engine, theinterviewees’ organizations reduced the averagetime to run a planning system refresh from 45minutes with their legacy planning systems toless than 10 minutes. With hundreds of reportsref reshed during month-end reporting cycles, theorganizations quickly experienced material timesavings from faster system processing speeds.The composite organizations benefits from an80% increase in the processing speed associatedwith report generation, which leads to efficienciesvalued at a three-year PV of more than 1million.80% Streamlined forecasting process. Byleveraging templates and preexisting modules toseed historical data prior to calculatingf orecasting metrics for future periods, planningprof essionals spent less time on manual datacollection and input, and they spent more time2
EXECUTIVE SUMMARYreviewing and analyzing forecast results. Duringa three-year period, the composite organizationreduces the labor effort of completing annualf orecasts by 70%, amounting to a cost savingsPV of 195,000. Frontline deployment costs. The interviewees’organizations migrated legacy branch-level datainto Planning Analytics with Watson to empowerboth branch managers and store associates tomake data-driven decisions based on factorssuch as daily sales targets, inventory levels, andcustomer footprints. They migrated this data inphases, each consisting of a subset of theorganization’s total branch footprint. For thecomposite organization, frontline deploymentcosts total a three-year PV of 563,000. Internal deployment costs. Interviewees saiddedicated internal teams consisting of bothtechnical and project management resourcescoordinated with IBM and IBM Business Partnersduring each implementation of Planning Analyticswith Watson. For the composite organization, theassociated labor amounts to a three-year PV of 337,000. User training. End users spent hours to weekstraining to use IBM Planning Analytics withWatson, depending on the user’s role. For thecomposite organization, training costs amount toa three-year PV of 141,000. Report development. Interviewees said thatalthough the majority of their organizations’Planning Analytics with Watson users are thosewho consume reports and data, theirorganizations still needed to dedicate a numberof people to build and modify the source models.For the composite organization, the cost of theseresources total a three-year PV of 51,000.Reducedforecasting effort70% Reduced technical debt. Interviewees said IBMPlanning Analytics with Watson replaced theirorganizations’ legacy planning solutions with asimple IT data feed. This created a centralizedrepository applicable across multiple planninguse cases while simultaneously reducing fees forhardware, software, support, and professionalservices associated with legacy systems. For thecomposite organization, the cost savings total athree-year PV of 689,000.Unquantified benefits. Benefits that are notquantif ied for this study include: Reduced risk of errors. Improved data hygiene and consistency. Increased collaboration.Costs. Risk-adjusted PV costs include: Licensing, support, and implementationservices. Interviewees said their organizationsengaged IBM Business Partners to assist in theinitial implementation, customization, andconf iguration of IBM Planning Analytics withWatson for their unique planning use cases.Furthermore, the organizations paid softwarelicensing fees to IBM or an IBM Business Partnerbased on the number and types of users. For thecomposite organization, these costs total a threeyear PV of 951,000.THE TOTAL ECONOMIC IMPACT OF IBM PLANNING ANALYTICS WITH WATSONThe decision-maker interviews and financial analysisf ound that a composite organization experiencesbenef its of 5.3 million over three years versus costsof 2 million, adding up to a net present value (NPV)of 3.2 million and an ROI of 159%.3
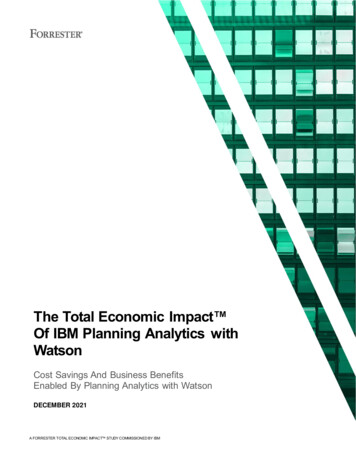
EXECUTIVE SUMMARYROIBENEFITS PVNPV159% 5.3MPAYBACK 3.2M14 monthsBenefits (Three-Year)Optimized staffing and inventory managementIncremental gross profit uplift 1.8M 424KStreamlined budgeting process 1.2MFaster system processing 1MStreamlined forecasting process 195KCost savings from retired legacy planning solutions 689KFrontline benefits from Planning Analyticswith WatsonInternal benef its from Planning Analyticswith WatsonTHE TOTAL ECONOMIC IMPACT OF IBM PLANNING ANALYTICS WITH WATSON4
EXECUTIVE SUMMARYTEI FRAMEWORK AND METHODOLOGYFrom the inf ormation provided in the interviews,Forrester constructed a Total Economic Impact f ramework for those organizations considering aninvestment in IBM Planning Analytics with Watson.The objective of the framework is to identify the cost,benef it, flexibility, and risk factors that affect theinvestment decision. Forrester took a multistepapproach to evaluate the impact that IBM PlanningAnalytics with Watson can have on an organization.DUE DILIGENCEInterviewed IBM stakeholders and Forresteranalysts to gather data relative to IBM PlanningAnalytics with Watson.DECISION-MAKER INTERVIEWSInterviewed four decision-makers atorganizations using IBM Planning Analytics withWatson to obtain data with respect to costs,benefits, and risks.COMPOSITE ORGANIZATIONDesigned a composite organization based oncharacteristics of the interviewees’organizations.FINANCIAL MODEL FRAMEWORKConstructed a financial model representative ofthe interviews using the TEI methodology andDISCLOSURESrisk-adjusted the financial model based onReaders should be aware of the following:issues and concerns of the decision-makers.This study is commissioned by IBM and delivered byForrester Consulting. It is not meant to be used as acompetitive analysis.CASE STUDYForrester makes no assumptions as to the potential ROIthat other organizations will receive. Forrester stronglymodeling the investment impact: benefits, costs,advises that readers use their own estimates within theframework provided in the study to determine theflexibility, and risks. Given the increasingappropriateness of an investment in the PlanningAnalytics with Watson.investments, Forrester’s TEI methodologyIBM reviewed and provided feedback to Forrester, butForrester maintains editorial control over the study and itsfindings and does not accept changes to the study thatcontradict Forrester’s findings or obscure the meaning ofthe study.Employed four fundamental elements of TEI insophistication of ROI analyses related to ITprovides a complete picture of the totaleconomic impact of purchase decisions. Pleasesee Appendix A for additional information on theTEI methodology.IBM provided the customer names for the interviews butdid not participate in the interviews.THE TOTAL ECONOMIC IMPACT OF IBM PLANNING ANALYTICS WITH WATSON5
The IBM Planning Analytics with Watson Customer JourneyDrivers leading to the Planning Analytics with Watson investmentInterviewed ef financial officerIndustrial servicesEMEA 100M to 500MCommercial managerPackagingAPAC 1B to 5BBusiness architectEntertainmentGlobal 10B Director of FP&ARetailAmericas 10B single organizational hierarchy. This can be achallenge when two different solutions display thesame data in different ways or they areconf igured to organize the data in a singular lens,such as a general ledger lens or a product lens.Interviewees f rom larger organizations with morecomplex planning cycles said the reconciliation ofdata f rom two or more different planning systemsof ten required manual effort from dedicatedresources.KEY CHALLENGESInterviewees said their organizations each performedthree primary types of recurring planning activities:budgeting, forecasting, and reporting. Each of theorganizations performed these activities on a monthlyor annual basis during regular planning cycles, suchas f or financial planning. Prior to adopting IBMPlanning Analytics with Watson, keeping track of andmanually executing on these activities usingspreadsheets created the following challenges: Obsolete data and insights. Even when datawas made easy to consume and visuallyappealing, it would often be obsolete by the timeit was delivered. This is because theorganizations often compiled data in batchreports, such as monthly sales reports. As aresult, f rontline workers had little visibility intotheir perf ormance relative to their targets, andmanagers did not have the insights they neededto accurately forecast performance and createaction plans.Siloed planning workflows. Organizations —particularly large enterprises — often adoptseveral different planning solutions catered tospecific departments, functions, or planningcycles. Ultimately, however, the outputs ofindividual planning activities must roll up into aTHE TOTAL ECONOMIC IMPACT OF IBM PLANNING ANALYTICS WITH WATSON“We used to have four differenthierarchies for four differentapplications. Now, they all roll upto a single segment.”Business architect, entertainment Expensive and inflexible spreadsheet-basedlegacy planning systems. Having siloedplanning workflows also meant that theinterviewees’ organizations needed to pay foradditional licensing, hardware, and support foreach planning system. Furthermore, theseplanning solutions required additional integrationwork so they could effectively communicate witheach other. And any changes would require even6
THE IBM PLANNING ANALYTICS WITH WATSON CUSTOMER JOURNEYmore integration and customization work,ultimately resulting in hefty piles of professionalservices fees paid to system integrators or otherthird-party providers.“We had a billion dollars of salesover three businesses [and] on fourERPs linked through dozens ofspreadsheets. You can see whythat was a problem.”Commercial manager, packaging Time- and labor-intensive planning activities.With their legacy spreadsheet-based planningsolutions, the interviewees’ organizations neededto manually populate, refresh, and pull dataduring planning cycles such as month-endreporting or forecasting. For example, a dataref resh could take up to an hour to executedepending on the complexity and the amount ofdata being pulled, which would leave less time forreview and analysis. Forecasting also requiredmanual seeding of data from prior periods beforeany projections could even be made. Theorganizations repeated these manual processesf or each planning cycle and workflow, whichwasted valuable hours that could’ve be spent onother value-added activities.COMPOSITE ORGANIZATIONBased on the interviews, Forrester constructed a TEIf ramework, a composite company, and an ROIanalysis that illustrates the areas financially affected.The composite organization is representative of thef our decision-makers that Forrester interviewed andis used to present the aggregate financial analysis inthe next section. The composite organization has thef ollowing characteristics:Description of composite. The compositeorganization is a retail enterprise that operates in theAmericas. It has 5,000 employees and generatesTHE TOTAL ECONOMIC IMPACT OF IBM PLANNING ANALYTICS WITH WATSONannual revenues of 800 million. It previously reliedon spreadsheet-based planning solutions forindividual planning workflows. But as it continued togrow, repeating planning processes across thebranch f ootprint became a time-consuming andexpensive endeavor. This prompted the organizationto engage IBM. The organization operates 30 retailbranch locations in Year 1 of the deployment, andthis increases to 35 by Year 3. Each branch acts as aseparate revenue and cost center, whichnecessitated individual input toward annual budgetingand monthly forecasting and reporting.Deployment characteristics. The compositeorganization migrates its legacy branch sales andperf ormance data to Planning Analytics with Watsonin phases. This includes 10% of branches in Year 1,21% in Year 2, and 40% in Year 3. By Year 3, theorganization has 329 users of IBM Planning Analyticswith Watson, including 241 read-only users, 70read/write users, and 18 power users (includingadministrators/modelers). The composite alsodeploys IBM Planning Analytics with Watson Cloud,leveraging both IBM Planning Analytics with Watsonf or Microsoft Excel and IBM Planning Analytics withWatson Workspace.Key assumptions Retail organization 800M annual revenue153 users in Year 1329 users in Year 3Use cases includeFP&A, sales planning,workforce planning,and inventory planning Cloud deployment7
Analysis Of BenefitsQuantif ied benefit data as applied to the compositeTotal BenefitsYear 1Year 2Year 3TotalPresentValue 297,400 672,212 1,319,600 2,289,212 1,817,346 74,800 158,667 299,200 532,667 423,923Streamlined budgetingprocess 368,874 507,202 537,941 1,414,017 1,158,678DtrFaster system processing 279,936 461,894 489,888 1,231,718 1,004,278EtrStreamlined forecastingprocess 54,432 89,802 95,256 239,490 195,267FtrCost savings from retiredlegacy planning solutions 212,500 314,500 314,500 841,500 689,388 1,287,942 2,204,277 3,056,385 6,548,604 5,288,880Ref.BenefitAtrOptimized staffing andinventory managementBtrIncremental gross profit upliftCtrTotal benefits (risk-adjusted)OPTIMIZED STAFFING AND INVENTORYMANAGEMENTEvidence and data. Interviewees praised PlanningAnalytics with Watson for its applicability to a diverserange of use cases. For example, organizations withf rontline operations used Planning Analytics withWatson to tightly manage and monitor their supplychains, staffing models, and inventory levels. In doingso, branch managers prevented overstaffing andoverstocking of their branches, and they achievedvisibility and transparency into their organizations’day-to-day operations.By leveraging Planning Analytics with Watson tokeep track of inventory levels, branch managersensured that each item was properly accounted for atthe end of each business day. This additional visibilityencouraged managers and associates to keepthemselves accountable and to ensure there was noaccidental product loss or shrinkage. The composite deploys IBM Planning Analyticswith Watson to three retail branches in Year 1, toseven branches in Year 2, and to 14 branches inYear 3. Each retail branch is staffed with 10 sales FTEs. The average level of inventory shrinkage prior tousing Planning Analytics with Watson was 0.2%of the organization’s total annual sales. The annual salary per sales associate is 81,250.This assumes a 25% overhead burden rate.“We have a much better employeeexperience today because ourbranches are always staffed withthe right number of people tosupport the workload on any givenday.”Director of FP&A, retailModeling and assumptions. For the compositeorganization, Forrester assumes the following:THE TOTAL ECONOMIC IMPACT OF IBM PLANNING ANALYTICS WITH WATSON8
ANALYSIS OF BENEFITSRisks. The impact of this benefit may vary based onthe f ollowing factors. The number and growth of Planning Analyticswith Watson deployments. The excess levels of staff and inventory related toits legacy environment.Results. To account for these risks, Forresteradjusted this benefit downward by 20%, yielding athree-year, risk-adjusted total PV (discounted at 10%)of 1.8 million.“In the midst of [the COVID-19pandemic], Planning Analytics withWatson helped us quickly respondto some issues in our approach tolabor planning, which helpedsupport our business in a dire timeof need.”Director of FP&A, retailOptimized Staffing And Inventory ManagementRef.MetricSourceYear 1Year 2Year 3A1Number of branchesComposite303335A2Percentage of branches leveraging IBMPlanning Analytics with WatsonComposite10%21%40%A3Number of retail branches leveraging IBMPlanning Analytics with WatsonA1*A23714A4Average store associates staffed perretail branch before IBM PlanningAnalytics with WatsonComposite101010A5Average store associates staffed perretail branch after IBM Planning Analyticswith WatsonComposite999A6Fully burdened sales associate salaryTEI Standard 81,250 81,250 81,250A7Staffing optimization using IBM PlanningAnalytics with WatsonA3*(A4-A5)*A6 243,750 568,750 1,137,500A8Average inventory shrinkage per retailbranch before IBM Planning Analyticswith WatsonB2*0.2% 53,333 48,485 45,714A9Average inventory shrinkage per retailbranch after IBM Planning Analytics withWatsonInterviews 10,667 9,697 9,143A10Improved inventory management usingPlanning Analytics with WatsonA3*(A8-A9) 128,000 271,515 512,000AtOptimized staffing and inventorymanagementA7 A10 371,750 840,265 1,649,500Risk adjustment 20% 297,400 672,212 1,319,600AtrOptimized staffing and inventorymanagement (risk-adjusted)Three-year total: 2,2890,212THE TOTAL ECONOMIC IMPACT OF IBM PLANNING ANALYTICS WITH WATSONThree-year present value: 1,817,3469
ANALYSIS OF BENEFITSseven branches in Year 2, and to 14 branches inYear 3.INCREMENTAL GROSS PROFIT UPLIFTEvidence and data. In addition to using PlanningAnalytics with Watson to promote operationalexcellence at the branch level, the interviewees’organizations also leveraged Planning Analytics withWatson to directly drive sales.Bef ore deploying Planning Analytics with Watson,individual sales associates did not have real-timeaccess to their current performance levels, andmanagers did not have the data to set realistic salesand growth targets for their associates. To proactivelydrive incremental growth, managers would insteadset targets based on historical performance ratherthan on real-time data.Using Planning Analytics with Watson, associatescould monitor their daily sales performance againstestablished targets and understand when theyneeded to push harder or utilize different tactics toincrease success rates. Similarly, managers couldperf orm A/B testing with different sales strategies andprovide coaching and retraining at the individual levelas needed. The average gross margins are 22%.“With high-quality data at such agranular level, [we] can make reallygood commercial decisions. Datadriven decision-making was a hugepart of our turnaround story.”Commercial manager, packagingRisks. The impact of this benefit may vary based onthe f ollowing factors: The number and growth of Planning Analyticswith Watson deployments. Individual gross margins.Results. To account for these risks, Forresteradjusted this benefit downward by 15%, yielding athree-year, risk-adjusted total PV of 424,000.Modeling and assumptions. For the compositeorganization, Forrester assumes the following: The composite deploys IBM Planning Analyticswith Watson to three retail branches in Year 1, to“Even though we were losing revenue during [the COVID-19 pandemic], we were actuallyable to increase our profitability because of the scenario-planning exercises we did withPlanning Analytics with Watson. Thanks to those, we were able to allocate the rightnumber of people to our growing resources and divest from our shrinking ones.”Chief financial officer, industrial servicesTHE TOTAL ECONOMIC IMPACT OF IBM PLANNING ANALYTICS WITH WATSON10
ANALYSIS OF BENEFITSIncremental Gross Profit UpliftRef.MetricSourceYear 1Year 2Year 3B1Number of retail branches leveraging IBMPlanning Analytics with WatsonA33714B2Annual sales per retail branchComposite 26,666,667 24,242,424 22,857,143B3Average percentage sales uplift usingIBM Planning Analytics with WatsonInterviews0.5%0.5%0.5%B4Incremental sales uplift using IBMPlanning Analytics with WatsonB1*B2*B3 400,000 848,485 1,600,000B5Average gross marginComposite22%22%22%BtIncremental gross profit upliftB4*B5 88,000 186,667 352,000Risk adjustment 15% 74,800 158,667 299,200BtrIncremental gross profit uplift (riskadjusted)Three-year total: 532,667STREAMLINED BUDGETING PROCESSEvidence and data. Interviewees said a commonpain point across their organizations is the time ittakes to complete an annual budgeting cycle. Forsome organizations, this process can take up to sixmonths from beginning to end, including the time tocreate budget templates, input historical andf orecasted data, compile and merge datasets, andreview and f inalize the consolidated plan. Producingthe annual budget involves input from variousf unctions, branches, and lines of business, eachof ten working with different templates and evendif ferent planning systems or software. The endresult is often a disjointed budgeting process that isiterative rather than cumulative and requiressignificant hours of rework and review.Interviewees said IBM Planning Analytics withWatson tackled these challenges by acting as acentral planning system that could be integratedacross different endpoints and planning workflowswithin their organizations. End users could thereforecreate their inputs with the confidence that they wereTHE TOTAL ECONOMIC IMPACT OF IBM PLANNING ANALYTICS WITH WATSONThree-year present value: 423,923working with the latest historical and forecast dataand under a singular view that was aligned and usedacross the organization — from executive leadershipdown to individual business managers. By accessinga single source of truth, the organizations increasedcommunication and collaboration during thebudgeting process, reduced the frequency andlikelihood of errors, and lessened the need formultiple, iterative review cycles.“[Previously,] any changes to thebudget carried a two-week cycletime. Now, all updates are done inthe same day. It sounds corny, butit really is [done with] just a click ofa button.”Commercial manager, packagingModeling and assumptions. For the compositeorganization, Forrester assumes the following:11
ANALYSIS OF BENEFITS The composite uses a bottom-up approach for itsannual budgeting process and each retail branchindividually contributes to the master plan. The number of retail branches grows organicallyf rom 30 in Year 1 to 33 in Year 2 and to 35 inYear 3. In Year 2, the composite deploys IBM PlanningAnalytics with Watson for operational andproduct-level planning that involves an additionalFTE per branch across the organization’sf ootprint for annual budgeting. The f ully burdened hourly rate per planning FTEis 60.Risks. The impact of this benefit may vary dependingon the f ollowing factors: Industry- and organization-specific characteristicsthat impact the complexity of the organization’sannual budgeting process. For example, smallorganizations often have less siloed planningworkf lows and processes compared to largerenterprises. The organization’s budgeting approach, whichcan impact the amount of overhead needed tocomplete its annual budgeting cycle. Forexample, using a top-down approach relies onf ewer inputs than using a bottom-up approach. The organization’s legacy planning environment,which will impact the efficiency of its annualbudgeting process prior to adopting IBM PlanningAnalytics with Watson, and ultimately, themagnitude of improvement it achieves with it.Results. To account for these risks, Forresteradjusted this benefit downward by 10%, yielding athree-year, risk-adjusted total PV of 1.2 million.THE TO
THE TOTAL ECONOMIC IMPACT OF IBM PLANNING ANALYTICS WITH WATSON 4 EXECUTIVE SUMMARY ROI Frontline benefits from Planning Analytics with Watson Internal benefits from Planning Analytics with Watson 159% 3.2M BENEFITS PV 5.3M NPV PAYBACK 14 months 689K 195K 1M 1.2M 424K 1.8M Cost savings from retired legacy planning solutions