Transcription
Economic Impact Study 2016
Table of ContentsExecutive Summary. 5History of Radford University. 6Methodology. 7The economic health of the region and the statedepend on a well-qualified workforce, whichRadford University supports through high qualityeducation and training for current and futureemployees of the region and beyond.Region of Impact. 8Radford University Profile. 11Revenue and Expenditures for Radford University.19Construction. 21State Appropriations. 22Radford Transit Impact.23Athletics and Special Events.23Total Economic Impact.25Radford University Capital Expenditures. 27Radford University Operations Expenditures.29Radford University Student Spending.31Radford University Visitor Spending .33Increased Earnings of Radford University Alumni.34Radford University Jobs Impact by Year.35Total Economic Impact of Radford University by Year.36Economic Impacts of Radford University in Virginia Statewide. 37Capital Expenditures. 37Appendix.38IMPLAN Model Outputs.39
List of Figures, Tables, and MapsTable 1 – Region of Impact, Select Demographic Characteristics, 2013 Estimates. 8Table 2 – Educational Attainment for the Region of Impact for Population 25 and Older . 8Table 3 – Radford University Student Enrollment and Residency. 11Table 4 – Student Spending by Locality. 12Table 5 – Radford University Employee Compensation.13Table 6 – Faculty/Staff Spending by Locality.14Table 7 – Median Income for the Population 25 and Older.15Table 8 – Proportion of Undergraduate vs. Graduate Students, 1996-2015.16Table 9 – Estimates of Additional Annual Earnings by Radford University Alumni, 2014.16Table 10 – Radford University Revenues and Expenditures by Fiscal Year (July-June), 2010-15.20Table 11 – State Appropriations as Share of Radford University Revenues. 22Table 12 – Radford University Home Athletic Attendance.24Table 13 – Radford University Capital Expenditures in the Region of Impact. 27Table 14 – Radford University Operations Expenditures in the Region of Impact.29Table 15 – Economic Effects of Additional Earnings by Radford University Alumni inRegion of Impact, 2016.34Table 16 – Economic Effects of Additional Earnings by Radford University Alumni in Virginia, 2016.34Table 17 – Total Economic Effects of Radford University on Region of Impact by Year.36Table 18 – Radford University Spending and Economic Impact in Virginia (Statewide). 37Figure 1 – Economic Impacts of Radford University Capital Expenditures by Fiscal Year. 27Figure 2 – Radford University Operations Impact by Fiscal Year.29Figure 3 – Radford University Student Spending Impact by Fiscal Year.31Figure 4 – Radford University Visitor Spending Impact by Fiscal Year.33Figure 5 – Regional Jobs Supported by Radford University.35Figure 6 – Radford University Total Economic Impact.36Map 1 – Radford University Region of Impact. 9Map 2 – Radford University Student Permanent Address Map. 17Map 3 – Radford University Alumni Distribution Map — Virginia. 17Map 4 – Radford University Alumni Distribution Map — U.S.18Map 5 – Radford University Faculty/Staff Distribution Map.18Economic Impact Study 20163
Executive SummaryAs a comprehensive institution of higher educationwithin the Commonwealth of Virginia, RadfordUniversity is focused on fulfilling its primary missionof teaching, research and service. In servicing thismission, the University has had a profound impacton the surrounding communities as well asacross Virginia.In 2015, Radford University contributed 361 millionto the statewide economy and, when combined withthe induced impact of its alumni, contributed 1.056 billion statewide, all supporting anestimated total of 8,421 jobs in the Commonwealth.Regionally, Radford University contributed in excessof 313 million to the regional economy (New Riverand Roanoke valleys) and a total of 475.2 million,supporting an estimated total of 4,176 jobs, whencombined with the induced impact of alumni inthe region. 1.056 billion statewide total direct,indirect and induced impact,supporting 8,421 jobs.Key findings of this report are as follows: 1.056 billion statewide total direct, indirect andinduced impact, supporting 8,421 jobs. Radford University supports 2,845 jobs in theregion and 3,221 statewide based on direct andindirect spending. Alumni earnings total more than 232.3 million in2016, which produces over 162 million in sales atlocal businesses and thus supporting 1,331 jobs inthe region, and earning 787.8 million state-wide,producing 695 million in sales and supportingmore than 5,200 jobs.For each dollar of state support, the impactsrepresent a return on investment of 22 statewideand 10 regionally, based on an investment of 47.3million received in general appropriations. 272 million was spent on construction andrenovation projects, while Virginia businessesreceived over 80 percent of these contractualagreements since 2009.This economic impact study further details thevaluable contributions the University makes to theregional and statewide economies. Serving theCommonwealth of Virginia has been fundamentalto the University’s success, educating one of thehighest concentration of in-state students relativeto its size. For example, 93.2 percent ofundergraduate students were in-state residentsin academic year 2015-16. On average, 86 percent ( 47.3 million) of studentspending occurs in the region of impact, withslightly more than half of that occurring withinthe City of Radford.Radford University takes great pride in thecommunity in which it operates and values everystakeholder: students, alumni, faculty, staff andvisitors alike. This community focus continuesto expand beyond campus boundaries, inclusiveof each stakeholder who shares in the RadfordUniversity experience. The impact of theserelationships reflects a cohesive system yieldingboth financial and nonfinancial benefits. Visitors of the University bring an additional 4.5 million in spending to the region. Each 1 of state support equals impact of 22statewide and 10 within the region of impact.As previously indicated, Radford University providesa significant benefit to both the regional and stateeconomies. The University has been named to the“Best Colleges and Universities in the Southeast” list,according to the Princeton Review, for the past 14years. With the University’s commitment to providinga well-rounded educational experience, the Universityis well positioned to remain a major economic driver.Economic Impact Study 20165
History of Radford UniversityMethodologyIMPLANRadford University was founded in 1910 by theVirginia General Assembly and has provided qualityeducation for Virginia residents for more than 100years. The University is a major economic engine ofthe New River Valley and surrounding counties, andit benefits the overall economic well-being of theCommonwealth of Virginia.This report uses IMPLAN economic impact modelsto estimate the direct and indirect economic effectsthat Radford University generates in a defined regionof impact (see page 8) through the University’sspending on operations, salaries, and capitalprojects, and spending by students and visitors.IMPLAN (Impact Analysis for PLANning) isan economic input-output modeling softwarepackage first developed by the University ofMinnesota and the U.S. Forest Service in the1970s. The modeling software and the IMPLANproprietary data set was expanded uponby the Minnesota IMPLAN Group, a privatecompany based in Stillwater, Minnesota, thatcurrently maintains the software. IMPLANis widely used by a number of universities,economic consultants, economic developmentprofessionals and others involved in estimatingeconomic impacts of programs and events.IMPLAN models the flow of expendituresthrough industries and institutions of a regionaleconomy. More information on the IMPLANmodel and data set can be obtained atwww.implan.com.Radford University provided a variety of data tocharacterize the economic activity that RadfordUniversity generates, including operations budgets,capital expenditures, salary data, enrollmentfigures and events information for the past fiveyears. The New River Valley Regional Commission(NRVRC) developed surveys for distribution tostudents, faculty, and staff to gather additional dataon regional economic activity. The surveys weredeveloped with input and guidance from universitystaff and included questions regarding locationof residence, salary, spending habits, and visitorinformation (see appendix). The report provides asummary of the resulting data aboutRadford University.Highlighted below is a brief history of the university: State Normal and Industrial School for Womenfounded in 1910. 1924 — School’s name changed to StateTeachers College. 1943 — Merger proposed between Radford andnearby Virginia Polytechnic Institute (VPI) aspart of a statewide effort to consolidate highereducation institutions and give students the mostadequate opportunity for a broad professionaland technical education. 1964 — Radford College dissolved therelationship with VPI. 1972 — Men first admitted as undergraduates. 1979 — Radford College was granted universitystatus, and its name was changed to the nameknown today: Radford University. 2008 — Douglas and Beatrice CovingtonCenter for Visual and Performing Arts openedand became one of the most technologicallyadvanced arts facilities and arts educationresources in Southwest Virginia. 2011 — Radford University granted firstdoctoral degrees. 2012 — Completion of the College of Businessand Economics (COBE) building. 2013 — 2014 Student Fitness and WellnessCenter was constructed. 2013 — 2015 Center for the Scienceswas constructed. 2014 — 2016 College of Humanities andBehavioral Sciences was constructed.16Additional me/about/history.htmlAs Radford University has grown, the surroundingcommunities have also experienced growth. TheCity of Radford has grown from a population of4,202 in 1910 to nearly 17,000 residents today.Radford is part of the Blacksburg-ChristiansburgRadford Metropolitan Statistical Area (MSA), whichhas approximately 180,000 residents1. The impactof Radford University on the region continues togrow in the 21st century, with enrollment increasingsignificantly over the last decade and a burst inrecent construction and renovation ofcampus buildings.The NRVRC worked with the RoanokeValley-Alleghany Regional Commission to use thisdata to calculate inputs for use in the IMPLANeconomic data and modeling tool. The IMPLANsoftware estimates the total economic impact ofRadford University by using statistical models ofrelationships in the regional economy to calculatehow economic activity at Radford Universitycirculates through the local and regional economy,and how it creates additional economic activity inthe region and throughout Virginia.An IMPLAN analysis quantifies the economiceffects that expenditures for a project(construction) or an activity (industry, tourismor events) have on a region’s economy. Themodel quantifies the ways that RadfordUniversity’s expenditures to construct abuilding, or a visitor’s purchase of items suchas lodging and gasoline, create additionaleconomic activity in various sectors of theregional economy. For instance, the purchaseof furniture or landscaping services for a newlyconstructed building provides additional incomefor the businesses selling these services, andin turn, these businesses spend this income onadditional consumer and business purchases.This process ripples throughout the regionaleconomy, creating jobs and economic activitybeyond the initial investment. The IMPLANanalysis provides estimates of these effects interms of jobs (#) and regional economicactivity ( ).Source: U.S. Census Bureau, 2010-2014 American Community Survey 5-Year EstimatesEconomic Impact Study 20167
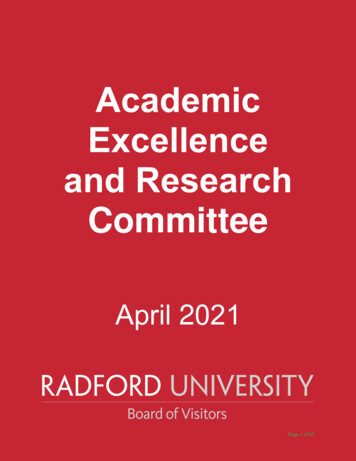
Region of ImpactThis study defines the “region of impact” as theentirety of Blacksburg MSA (the counties of Floyd,Giles, Montgomery and Pulaski and the City ofRadford); the counties of Botetourt, Franklin,Roanoke and Wythe; and the cities of Roanoke andSalem (see map on page 9). The IMPLAN modeluses this “region of impact” to calculate economicimpacts because this region is where faculty andstudents predominantly live, work and contribute tolocal economies.Radford University contributes to the overalleconomic health of the region of impact in manyways, including the salaries of faculty and staff;purchases of equipment and services fromregional businesses; and the combined impact ofspending in the region by nearly 10,000 studentsand 1,600 employees. The average income forfull-time Radford University employees (facultyand staff) was 55,183 in 2014-15, well above theaverage median income for full-time workers in theBlacksburg MSA ( 40,406) or the broader regionof impact ( 40,556), supporting homeownershipand consumer spending in the regional economy2.Radford University also provides quality highereducation options in a region where bachelor’sand graduate degree attainment levels are belowthe state average (see Table 2). Higher educationalattainment leads to higher earning potential onaverage, contributing further to regional economicactivity and growth.2Table 1 – Region of Impact, Select DemographicCharacteristicsDemographicsRegion of impactVirginiaPopulation514,8958,185,131Median household income 47,832 64,792Per capita income 25,786 33,958Unemployment5.96%5.54%Map 1: Radford University Region of ImpactU.S. Census Bureau, 2010-2014 American Community Survey 5-Year EstimatesTable 2 – Educational Attainment for the Region ofImpact for Population 25 and OlderEducational attainment levelRegion of impactVirginiaLess than high school graduate13.3%12.2%High school graduate29.7%25.0%Some college orassociate’s degree29.5%27.1%Bachelor’s degree16.9%20.7%Graduate orprofessional degree10.6%15.0%U.S. Census Bureau, 2010-2014 American Community Survey 5-Year EstimatesU.S. Census Bureau, 2010-2014 American Community Survey 5-Year Estimates; Radford Universityemployee data for FY13-14Created by NRVRC, 2016, Sources: Radford University; U.S. Census BureauEconomic Impact Study 20168Photo credit: Visit Virginia’s Blue Ridge9
Radford University ProfileRoanoke Higher Education CenterStudent ProfileAfter reaching a record high of 9,928 totalstudents enrolled in fall 2013, RadfordUniversity’s fall 2016 enrollment was 9,401students (headcount), reflective of the generalfluctuation seen in Virginia with a similarlyfluctuating number of eligible college applicants.Undergraduates represent 90 percent of thetotal students enrolled, and graduate studentsrepresent 10 percent.Radford University offers 67 bachelor’s degreeprograms in 38 disciplines, 22 master’s degreeprograms in 17 disciplines and three doctoralprograms. Several post-graduate certificationsand degree minors provide numerous options forstudents to achieve desired curriculum goals.More than 90 percent of students attendprograms offered at the main campus inRadford, while the University offers off-campusprograms at several locations in southwestVirginia. Students enrolled in program offerings inRoanoke account for the majority of off-campusenrollment (12 programs at the Roanoke HigherEducation Center and one at the Carillion Clinic/Jefferson College of Health Sciences). Otherlocations include the New College Institute inMartinsville and the Southwest Virginia HigherEducation Center in Abingdon.10Table 3 – Radford University Student Enrollmentand ResidencyTermTotal studentheadcountEnrolled on main Lives in acampusdormFall 20098,8788,3352,678Fall 20109,0078,4072,967Fall 20119,3708,9303,125Fall 20129,5739,1103,138Fall 20139,9289,4063,232Fall 20149,7989,2533,179Fall 20159,7439,2073,033Source: Radford University, 2016Approximately one-third of students enrolled at themain campus live in on-campus dormitories, withthe rest living in off-campus housing. In 2015, thisamounted to 6,174 students commuting to courseson the Radford campus (note: many students’records list their parents’ address, so the numberof students living in the region is likely much higherthan the 2,281 students who listed an address in theUniversity region of impact).Economic Impact Study 201611
Survey Results —Radford University StudentsFaculty and Staff ProfileAs of the 2015-16 academic year, Radford Universityhad 1,291 full-time employees and 306 part-timeemployees. The overwhelming majority of facultyand staff reside in the Blacksburg-ChristiansburgRadford MSA that includes the City of Radfordand the counties of Floyd, Giles, Montgomeryand Pulaski. A large number of faculty and staffalso reside in the Roanoke area. Overall, nearly 94percent of employees live within the University’sarea of impact jurisdictions, and 98 percentlive in Virginia. Map 5 illustrates the geographicdistribution of faculty and staff (page 18).A survey was distributed to Radford Universitystudents to develop estimates of the economicimpact students have on the City of Radfordand the surrounding region of impact. Surveydistribution occurred in October and November2013, with 450 responses.Student SpendingStudents estimated that they spent nearly 500/month on goods and services, with nearly half( 232) of spending on personal consumption items(food, groceries, supplies, etc.). Students spent anaverage of 99 on transportation costs, and 154on services. In addition, students who indicated thatthey live off-campus spent an average of 505/month on housing. Students reported an estimatedmonthly income of 350/month, so it is assumed thatmany rely on assistance from their parents or studentloans to cover their expenses. The average surveyrespondent received 3,900/year in financial aid.Students estimated that nearly 86 percent oftheir monthly spending occurs within the RadfordUniversity region of impact, with the remaining 15percent likely spent in their home communities.Nearly 44 percent of that estimated monthlyspending occurs in the City of Radford, but othertop areas include Montgomery County(20 percent) and Pulaski County (18 percent).Student Visitor SpendingIn addition to students’ spending on housing andpersonal goods, family and friends who travel toRadford to visit students bring additional spendingto the regional economy. Students estimated thattheir guests visit the region two nights per year onaverage. Over 95 percent of survey respondentssaid their visitors would dine at a restaurant duringtheir trip, with other popular activities includingshopping (65 percent), entertainment (45 percent)and outdoor recreation (45 percent). Together,students and visitors to Radford University spendover 40 million in the local economy each year,accounting for an estimated 3-10 percent of sales incertain retail sectors in the Blacksburg metro area(see Table 4).Table 4 – Regional Sales and Radford University Student SpendingThe salaries of the University’s full-time andpart-time employees contribute directly to theeconomy as faculty and staff spend their earningson goods and services in their communities. Thesesalaries drive additional spending within the regionon housing, groceries, entertainment and othergoods and services. Radford University has spentover 360 million in employee salaries in the pastfive years, with total annual salaries of nearly 79.2million in Academic Year (AY) 2015-16 alone(see Table 5).Radford University has been a relatively stablesource of jobs for faculty and staff despite therecent recession. Between 2009 and 2015, the totalnumber of employees has grown by 17 percent, andtotal annual salaries have grown by 36 percent, withparticular growth in both the number and averagesalary of part-time employees. Over the sameperiod, the number of full-time employees grew by11 percent, and full-time salaries by 30 percent.Table 5 – Radford University Employee CompensationAcademic YearFull-Time employeesTotal full-time salaryPart-Time employeesTotal part-time salary2009-101,160 56,754,976200 1,323,064Retail sectorRadford salesBlacksburg MSAsalesRadford student/ visitor % of MSA sales fromspendingstudents/visitors2010-111,152 56,459,827218 2,332,579Hotels 4,740,272 46,501,605 1,431,6203.1%2011-121,153 58,833,594279 5,241,627Restaurants 33,415,484 288,324,590 7,856,4602.7%2012-131,188 61,370,203332 5,840,365Grocery stores 6,179,766 78,419,208 6,596,1808.4%2013-141,226 66,537,815329 6,274,650General merchandise 917,832 89,871,792 7,258,0608.1%2014-151,263 69,711,145340 7,064,105Real estate leasing 31,528,407 265,752,799 25,182,0009.5%2015-161,291 73,564,838306 5,604,55912Economic Impact Study 201613
Radford University, 2016Alumni ProfileRadford University provided a source of jobs andincome indirectly as well, through spending onoperations and capital projects that support jobs inregional construction and service industries(see page 35).Radford University has 72,861 living alumni. Nearly70 percent of these alumni live in Virginia, followedby large numbers in North Carolina, Maryland,Florida and Georgia. Maps 3 and 4 illustratewhere alumni live in Virginia and around the US,respectively (pages 17-18).Survey Results —Radford University FacultyA survey was distributed to Radford Universityfaculty and staff as part of efforts to developestimates of the economic impact that facultyand staff have on the City of Radford and thesurrounding region of impact. Survey distributionoccurred in October and November 2013, with287 responses.Survey respondents estimated that they spentan average of 2,290 per month on housing,transportation, and goods and services. Nearly halfof this spending went to housing ( 1,013/month),followed by personal consumption items (food,groceries, supplies, etc., 656/month; services, 410/month; and transportation, 210/month.)Survey respondents estimated that approximately92 percent of their spending occurs in RadfordUniversity’s region of impact jurisdictions.Montgomery County received the most spendingby University employees, followed by Radford,Pulaski County and Roanoke (see Table 6).Table 6 – Faculty/Staff Spending by LocalityLocality14Similar to the results of the student survey, facultyand staff estimated that their visitors spent anaverage of two nights per year in the region. Diningand shopping were the most popular activities forvisitors, but faculty and staff visitors are more likelyto participate in arts/entertainment and communityand cultural events than the visitors coming to seestudents (see page 12).Universities create wealth for communities in manyways, including the increased earnings potentialof college graduates. The median annual incomeof workers with bachelor’s or advanced degreesis significantly higher than income of workers withlower education levels. Table 7 illustrates the extentof this trend for Virginia and the Radford Universityregion of impact (calculated using county-leveldata, weighted by population).Table 7 – Median Income for the Population 25and OlderEducational attainment level Median annual incomePercent of total spendingMontgomery County32.8%Radford21.9%Pulaski County21.1%Roanoke10.2%Other7.8%Floyd County4.7%Giles County1.6%Radford University Faculty and Staff Survey, 2013Radford University Faculty and StaffSurvey, 2013Of the 50,595 alumni that live in Virginia, many staynear Radford University. Approximately 29 percentof Virginia alumni reside in the region of impact,especially in Radford, Christiansburg, Blacksburg,Roanoke and Salem (see Map 3). The RadfordUniversity region of impact has the largest numberof alumni (14,443), but Virginia’s large metro areasattract many Radford University alumni as well.The largest groups of Virginia-based alumni are inthe Northern Virginia (10,867 alumni), Richmond(5,687) and Hampton Roads (4,796) metro areas.RU region of impactVirginiaLess than high school graduate 21,960 21,618High school graduate(includes equivalency) 28,589 29,421Some college orassociate’s degree 32,300 36,525Bachelor’s degree 42,427 55,637Graduate orprofessional degree 54,762 79,473U.S. Census Bureau, 2010-2014 American Community Survey 5-Year EstimatesIn the region of impact, the median annual incomefor workers with a bachelor’s degree is 13,838higher than that of workers with only a high schooleducation, and 26,173 higher for workers with agraduate degree (master’s, doctoral or professionaldegree). The increase in earnings over workerswith only a high school diploma is even greater forVirginia statewide, with median incomes 26,216higher for workers with a bachelor’s degree and 50,052 higher for graduate degrees. These higherfigures reflect higher incomes in Virginia metroareas, especially Northern Virginia. The incomes ofRadford University alumni that live in Virginia’s largemetro areas likely reflect these regional variations3.The following calculations provide an estimate of theincreased earnings that Radford University graduatesexperienced, compared to what they would be ableto earn without an advanced degree (high schoolgraduate only). These calculations assume that theproportion of University alumni with bachelor’sdegrees and graduate degrees in Virginia is thesame as the proportion of these degrees awarded byRadford University overall. The University awardeda total of 37,351 degrees from 1996-2015, of which82 percent were bachelor’s degrees and 18 percentwere graduate degrees. Although the University’stotal enrollment over that period indicates a higherproportion of undergrads (88 percent) vs. graduatestudents (12 percent) than the degree awards (seeTable 8), enrollment figures include students who donot finish their degree at Radford University.3Self-reported salaries of Radford University grads provide some evidence for this ol Radford University/SalaryEconomic Impact Study 201615
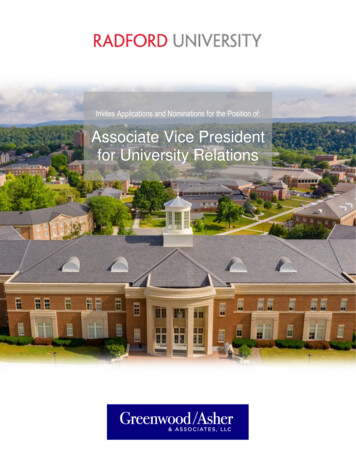
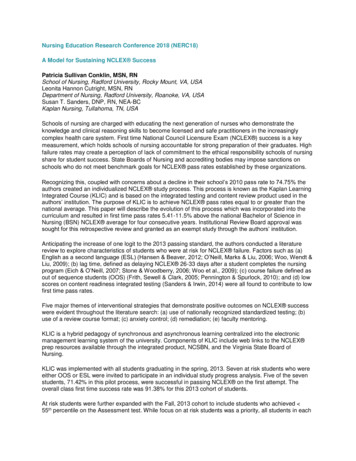
Map 2: Radford University Student Permanent Address MapTable 8 – Proportion of Undergraduate vs.Graduate Students, 1996-2015Total degrees awardedNumberPercent of totalBachelor’s degrees34,18781.7%Graduate degrees(Master’s and Ph.D.)7,63318.3%Total student enrollmentNumberPercent of totalUndergraduate students,1996-2015163,47285.4%Graduate-level students,1996-201527,89614.6%LegendStudent Distribution Count10 or Less11–2021–5051–100101–200More than 200Zip Code Boundary2015 Radford University Factbook, available at: https://ir.radford.edu/factbook0
1 Source: U.S. Census Bureau, 2010-2014 American Community Survey 5-Year Estimates Methodology This report uses IMPLAN economic impact models to estimate the direct and indirect economic effects that Radford University generates in a defined region of impact (see page 8) through the University's spending on operations, salaries, and capital