Transcription
The Total Economic Impact Of The Qlik Data IntegrationPlatformCost Savings And Business BenefitsEnabled By The Qlik Data Integration PlatformAUGUST 2021A FORRESTER TOTAL ECONOMIC IMPACT STUDY COMMISSIONED BY QLIK
Table Of ContentsConsulting Team: Sri Prakash GuptaExecutive Summary . 1The Qlik Data Integration Platform CustomerJourney . 7Key Challenges . 7Solution Requirements . 7Composite Organization . 8Analysis Of Benefits . 9Savings From Data Management Efficiencies . 9Real-Time Data Integration And GovernanceBenefits. 10Savings Enabled By Simplified Reporting . 12Unquantified Benefits . 13Flexibility . 13Analysis Of Costs . 14Licensing And Professional ServIces Costs. 14Planning, Ongoing Management, And ResourceCosts . 15Financial Summary . 17Qlik: Overview . 18Appendix A: Total Economic Impact . 19Appendix B: Supplemental Material . 20ABOUT FORRESTER CONSULTINGForrester Consulting provides independent and objective research-based consulting to help leaders succeed in theirorganizations. For more information, visit forrester.com/consulting. Forrester Research, Inc. All rights reserved. Unauthorized reproduction is strictly prohibited. Information is based onthe best available resources. Opinions reflect judgment at the time and are subject to change. Forrester , Technographics ,Forrester Wave, RoleView, TechRadar, and Total Economic Impact are trademarks of Forrester Research, Inc. All othertrademarks are the property of their respective companies.THE TOTAL ECONOMIC IMPACT OF THE QLIK DATA INTEGRATION PLATFORM
Executive SummaryOrganizations are realizing that having lots of diverse data doesn’t magically createmeaningful insights without migration, integration, transformation, enrichment, andorchestration. Poorly integrated data leads to bad business decisions, bad customerexperiences, less competitive advantage, and slow innovation and growth. As aresult, organizations are investing in self-service and real-time data architectures thatscale easily, automate data ingestions, and stream data in real time.The Qlik Data Integration Platform allowsorganizations to accelerate the discovery andKEY STATISTICSavailability of comprehensive, accurate, and up-todate information for business intelligence andanalytics. Qlik data integration increases businessagility by creating integrated data environments thatenable companies to respond to change morequickly, leverage new technologies better, andReturn on investment (ROI)Net present value (NPV)develop innovative products and services.306% 9.5 millionQlik commissioned Forrester Consulting to conduct aTotal Economic Impact (TEI) study and examinethroughout their data-to-insights journeys. Thesethe potential return on investment (ROI) enterpriseslimitations led to serval issues. For example:may realize by deploying the Qlik Data Integration Platform. The purpose of this study is to provideThe organizations struggled to convert insightsinto action due to disjointed systems and datareaders with a framework to evaluate the potentialsilos.financial impact of the Qlik Data Integration Platformon their organizations. They were unable to manage growing datavolumes and complexity, and they could not fulfillTo better understand the benefits, costs, and risksthe need for high-speed data ingestion.associated with this investment, Forrester interviewedfour customers with experience using the Qlik Data Poorly integrated business data led to badIntegration Platform. For the purposes of this study,business decisions, bad customer experiences,Forrester aggregated the experiences of theless competitive advantage, and slow innovationinterviewed customers and combined the results intoand growth.a single composite organization. The organizations couldn’t fully democratize dataPrior to using the Qlik Data Integration Platform, theto allow business users to access and leveragecustomers used disconnected in-house and externaldata themselves to support faster and moresolutions for data management. Previous dataaccurate business decisions.integration attempts yielded limited success and leftcustomers with pain points and frustrationsTHE TOTAL ECONOMIC IMPACT OF THE QLIK DATA INTEGRATION PLATFORM1
EXECUTIVE SUMMARYAfter the investment in the Qlik Data Integrationtheir business-decision making processes, theyPlatform, the customers experienced the followinggained significant competitive advantages over theirbenefits:peers. Consolidated data to gain a single view of trustedbusiness data.KEY FINDINGSImproved and standardized data integrationQuantified benefits. Risk-adjusted present valueenvironments across regions and business units.(PV) quantified benefits include:Increased business agility and time-to-market by Ingesting and replicating data in real timeproviding data intelligence, adopting a data-leads to data management efficiencies thatdriven approach, democratizing access to data,save 10.5 million over three years. Beforeand turning data into actionable insights.deploying the Qlik Data Integration Platform, theImproved the ability to effectively meet business-interviewees’ organization struggled to ingest anduser demands for more self-service and trusteddeliver data from multiple sources. Datadata so they could create their own dashboardsengineers and IT staff had to spend lots of timeand business insights.extracting, transforming, and loading data intowarehouses. This required additional Accelerated decision-making with improved dataadministration, the data processing wasintegration and analytics-ready data.haphazard, and the quality of data wasinconsistent.With the Qlik Data Integration Platform, theorganizations could ingest massive volumes of“There has been an exponentialgrowth of data and increasingbusiness dependency for decisionmaking on a single source of truth.This made it extremely important forour organization to focus on dataintegration investments. [The QlikData Integration Platform] enabledbusiness agility and flexibility.”transaction data in real time from multiplesources and build scalable data pipelines. Datasources such as databases, data warehouses,legacy mainframe systems, enterpriseapplications, and other sources, fed directly into adata lake. On average, the interviewees’organizations reduced the average workload ofdata engineers and IT FTEs by up to 25%. Forthe composite organization, this leads to annualcost savings of more than 3 million.Director of solution delivery andmaintenance, financial services Seamless data integration and governancesaves 1.6 million over three years. The QlikData Integration Platform allowed theinterviewees’ companies to democratize dataAccording to the interviewees, the Qlik Dataaccessibility, which improved their businessIntegration Platform enabled swift and smartdecisions and customer experiences.decision-making to help their organizations captureDemocratized data also led to fewer extract,opportunities, gain competitive advantages, andtransform, and load (ETL) job requests sent tomanage risks. With the digital insights at the core ofdata engineers from business lines and fasterTHE TOTAL ECONOMIC IMPACT OF THE QLIK DATA INTEGRATION PLATFORM2
EXECUTIVE SUMMARYtime-to-delivery for requests that could betickets and waiting for other teams to providesatisfied through Qlik’s solution.reports, teams could get answers to theirquestions themselves within minutes. For theThe Qlik Data Integration Platform improved datacomposite organization, this enables businessgovernance and security because it integratedfunctions to use insights for more strategicaccess through virtualization with datadecisions.cataloging, quality, and stewardship capabilitiesthat allowed the organizations to develop andImproved agility and flexibility. Theinterviewees’ organizations gained the ability toinitially looking to migrate data (e.g., to make itdeploy in any cloud configuration and rapidlymore accessible to data scientists or engineers)integrate with an ever-increasing array of datamay not need to undertake potentially significantsources, targets, and platforms.efforts. enforce policies. With virtualization, companies Increased operational efficiency and reducedSimplified reporting saves more thanrisks. The automation of coding intensive tasks 500,000 over three-years. With the Qlik Dataminimized error-prone processes and freed timeIntegration Platform, the interviewees’for data engineers to focus on higher-value tasks.organizations made it faster and easier forbusiness users to directly access data, to selfprovision data for their analysis as well as AI andmachine learning initiatives, and to get immediateinsights without relying on technical teams to getCosts. The composite organization experiencesimplementation costs and annual license fees ashighlighted below. Risk-adjusted PV costs include: Qlik Data Integration Platform license andthis data for them. The organizations’ technicalprofessional services costs of 2.4 millionteams saved time by no longer having to fieldover three years. The composite organizationrequests from business users to pull lists andpays license costs of 750,000 in the initialanalyze data on their behalf. The technical teamsperiod and then in year 2 and 3 for the Qlik Datagained the ability to easily access data withinIntegration Platform. It also pays 112,500 in up-their own systems, conduct their own datafront platform deployment and professionalqueries, analyze data combined with other dataservices fees, which include installation, post-sets, and create their own models and reports.installation support, configuration setup, analysisand modeling, and testing. The compositeorganization pays 100,000 in professionalUnquantified benefits. Additional benefits thatcustomers experienced but were not able to quantifyinclude: services fees in years 2 and 3. Planning, ongoing management, andresource costs of nearly 672,000.Improved efficiencies in data-driven decision-Interviewees said deployment of the Qlik Datamaking. Implementing the Qlik Data IntegrationIntegration Platform was straightforward andPlatform facilitated data exploration and inspiredrequired minimal resource time. Successfulmany teams across the organizations to ask anddeployments typically required resources toget answers to critical business questions thatspend a few weeks on project feasibility,they previously could not have resolved. Thisimplementation, and testing. Once the solution iscreated cultures of data curiosity as more usersup and running, the composite organizationgained access to the platform. Instead of filing ITdedicates 50% of the time of four FTEs toTHE TOTAL ECONOMIC IMPACT OF THE QLIK DATA INTEGRATION PLATFORM3
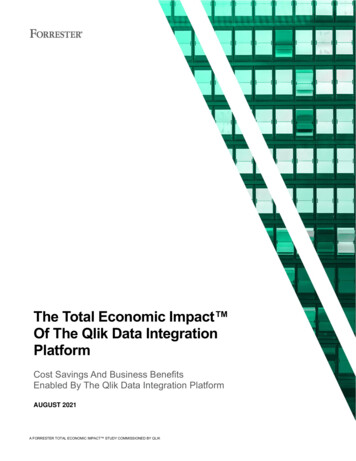
EXECUTIVE SUMMARYoversee, manage, and monitor the deployment inyears 1 and 2. In Year 3, the organization needsthe FTEs to spend only 25% of their time onthese tasks.Annual license and implementation costs will varydepending on the size and scope of theimplementation. Readers are encouraged tocontact Qlik for a quote based on specificrequirements and planned business outcomes.The customer interviews and financial analysis foundthat a composite organization experiences benefits of 12.6 million over three years versus costs of nearly 3.1 million, adding up to a net present value (NPV)of 9.5 million and an ROI of 306%.The Qlik Data Integration Platformenabled data accuracy, flexibility,transparency, and faster responsetime. It allowed us to connect differentdata sources and improve decisionmaking for business.— Director of data services, banking and financial servicescompanyTHE TOTAL ECONOMIC IMPACT OF THE QLIK DATA INTEGRATION PLATFORM4
EXECUTIVE SUMMARYROIBENEFITS PVNPVPAYBACK306% 12.6 million 9.5 million6 monthsFinancial SummaryTotal benefits PV, 12.6MPayback period: 6 monthsTotal costs PV, 3.1MInitialYear 1THE TOTAL ECONOMIC IMPACT OF THE QLIK DATA INTEGRATION PLATFORMYear 2Year 35
EXECUTIVE SUMMARYTEI FRAMEWORK AND METHODOLOGYFrom the information provided in the interviews,Forrester constructed a Total Economic Impact framework for those organizations considering anDUE DILIGENCEInterviewed Qlik stakeholders and Forresteranalysts to gather data relative to the Qlik Datainvestment in the Qlik Data Integration Platform.Integration Platform.The objective of the framework is to identify the cost,benefit, flexibility, and risk factors that affect theCUSTOMER INTERVIEWSInterviewed four decision-makers atinvestment decision. Forrester took a multisteporganizations using the Qlik Data Integrationapproach to evaluate the impact that the Qlik DataIntegration Platform can have on an organization.Platform to obtain data with respect to costs,benefits, and risks.COMPOSITE ORGANIZATIONDesigned a composite organization based oncharacteristics of the interviewed organizations.FINANCIAL MODEL FRAMEWORKConstructed a financial model representative ofthe interviews using the TEI methodology andDISCLOSURESrisk-adjusted the financial model based onReaders should be aware of the following:issues and concerns of the interviewedThis study is commissioned by Qlik and delivered byForrester Consulting. It is not meant to be used as acompetitive analysis.organizations.Forrester makes no assumptions as to the potential ROIthat other organizations will receive. Forrester stronglyadvises that readers use their own estimates within theframework provided in the study to determine theappropriateness of an investment in Qlik Data Integration.Qlik reviewed and provided feedback to Forrester, butForrester maintains editorial control over the study and itsfindings and does not accept changes to the study thatcontradict Forrester’s findings or obscure the meaning ofthe study.Qlik provided the customer names for the interviews butdid not participate in the interviews.THE TOTAL ECONOMIC IMPACT OF THE QLIK DATA INTEGRATION PLATFORMCASE STUDYEmployed four fundamental elements of TEI inmodeling the investment impact: benefits, costs,flexibility, and risks. Given the increasingsophistication of ROI analyses related to ITinvestments, Forrester’s TEI methodologyprovides a complete picture of the totaleconomic impact of purchase decisions. Pleasesee Appendix A for additional information on theTEI methodology.6
The Qlik Data Integration Platform Customer JourneyDrivers leading to the Qlik Data Integration Platform investmentInterviewed cial servicesHeadquartered in EuropeDirector of solution delivery andmaintenanceRevenue: 100 billionEmployees: 50,000Metals and miningHeadquartered in BrazilData integration analystRevenue: 30 billionEmployees: 50,000Banking and financial servicesHeadquartered in CanadaDirector of data servicesRevenue: 25 billionEmployees: 50,000SoftwareHeadquartered in the USVice president of businessintelligenceRevenue: 80 millionEmployees: 500KEY CHALLENGESThe interviewees said their organizations struggledwith common challenges before investing in the QlikData Integration Platform. “Qlik helped us to unite data silos andgain a unified view. This is vital for thecompany to predict future behaviorand to make the right strategicdecisions to serve customers.”The organizations struggled to convert insightsinto action due to disjointed systems and datasilos. The organizations were unable to manageincreasing amounts of data and complexity andData integration analyst, metals and miningthe need for high-speed data ingestion. The organizations had poorly integrated businessdata that led to poor business decisions,bad customer experiences, reduced competitiveadvantages, and slower innovation and growth. The organizations were unable to democratizedata to allow business users to access andleverage data themselves to support faster andmore accurate business decisions. The organizations were unable to fully migrate toSOLUTION REQUIREMENTSThe interviewed organizations searched for a solutionthat could: trusted business data.the cloud, but decision-makers wanted to prepareto make that transition in the future. Most of theConsolidate data and provide a single view of Increase business agility and time-to-market bycompanies recognized the value of cloud storageproviding data intelligence, adopt a data-drivenand operations, but many were unable to migrateapproach, democratize access to data, and turndue to regulations or legacy workloads.data into actionable insights. Effectively meet business users’ demands formore self-service and trusted data so they couldTHE TOTAL ECONOMIC IMPACT OF THE QLIK DATA INTEGRATION PLATFORM7
THE QLIK **PRODUCT** CUSTOMER JOURNEY create their own dashboards and businesssources spread across hybrid, multicloud, and on-insights.premises environments.Accelerate decision-making with improved dataintegration and analytics-ready data. Improve and standardize data integrationenvironments across regions and business units.The interviewees said the Qlik Data IntegrationPlatform enabled swift and smart decision-making tocapture opportunities, gain competitive advantages,and manage risks. With digital insights at the core oftheir business decision-making processes, theyKey assumptions Global organization 5 billion annualrevenue 20,000 employeesgained significant advantages over their competitors.After a request for proposal (RFP) and business caseprocess evaluating multiple vendors, the interviewedorganizations chose the Qlik Data IntegrationPlatform and began phased approaches todeployment.With Qlik’s Data Integration Platform, theorganizations gained flexible deployment methodssuch as multicloud environments (e.g., public cloud,private cloud, on-premises), which provided moreflexibility.COMPOSITE ORGANIZATIONBased on the interviews, Forrester constructed a TEIframework, a composite company, and an ROIanalysis that illustrates the areas financially affected.The composite organization is representative of thefour companies that Forrester interviewed and isused to present the aggregate financial analysis inthe next section. The composite organization has thefollowing characteristics:Description of composite. The global, multibilliondollar B2C organization provides a high volume ofsales support, customer support, andservice/warranty support for its products. It has astrong brand with global operations, an employeebase of about 20,000, and annual revenue of 5billion. It had a massive amount of data from multipleTHE TOTAL ECONOMIC IMPACT OF THE QLIK DATA INTEGRATION PLATFORM8
Analysis Of BenefitsQuantified benefit data as applied to the compositeTotal BenefitsYear 1Year 2Year 3TotalPresentValue 3,375,000 4,050,000 5,400,000 12,825,000 10,472,389Real-time data integration andgovernance benefits 421,875 675,000 843,750 1,940,625 1,575,296Savings enabled by simplifiedreporting 168,750 225,000 225,000 618,750 508,405 3,965,625 4,950,000 6,468,750 15,384,375 12,556,090Ref.BenefitAtrSavings from datamanagement efficienciesBtrCtrTotal benefits (risk-adjusted)SAVINGS FROM DATA MANAGEMENTEFFICIENCIESEvidence and data. The interviewees said theirorganizations struggled to ingest and deliver data“There have been instant benefits withthe Qlik Data Integration Platform. Itreplaced outdated, traditional methods ofmanually managing data sets, scrubbingthem, and loading them into theindividual data lake or warehouseenvironment. That was a tedious task.”from multiple sources. Data engineers and IT staffhad to spend time extracting, transforming, andloading data into warehouses. But data processingwas haphazard, data quality was inconsistent, andthis process required additional administration.With the Qlik Data Integration Platform, theorganizations gained the ability to ingest massiveamounts of transaction data in real time from multipleVice president of business intelligence, softwaresources and build scalable data pipelines. Datasources such as databases, data warehouses, legacymainframe systems, enterprise applications, andother sources are directly fed into a data lake.On average, the organizations reduced the averageorganization’s digital footprint. It has 25 dataworkloads of data engineers and IT FTEs by up tosources in Year 1, 30 in Year 2, and 40 in Year 3.25%. For the composite organization, this leads to annual cost savings of more than 3 million.Modeling and assumptions. For the compositeorganization, Forrester assumes that: IT staff and data engineers experience timesavings of 25%. The average fully loaded annual salary of aresource is 75,000.The volume of data and the variety of datasources will continue to grow with theTHE TOTAL ECONOMIC IMPACT OF THE QLIK DATA INTEGRATION PLATFORM9
ANALYSIS OF BENEFITSSavings From Data Management EfficienciesRef.MetricSourceYear 1Year 2Year 3A1Total number of data sourcesComposite253040A2Data engineers and technology FTE timeneeded to manage data sources beforeusing the Qlik Data Integration PlatformComposite888A3Percentage of data engineers andtechnology FTE time saved with the QlikData Integration PlatformComposite25.00%25.00%25.00%A4Fully burdened annual salary pertechnology FTEAssumption 75,000 75,000 75,000AtSavings from data managementefficienciesA1*A2*A3*A4 3,750,000 4,500,000 6,000,000Risk adjustment 10% 3,375,000 4,050,000 5,400,000AtrSavings from data managementefficiencies (risk-adjusted)Three-year total: 12,825,000Three-year present value: 10,472,389Risks. Savings from data management efficiencieswill vary with: The number of data sources the organizationuses. The types of data sources (including structuredand nonstructured data). The number of data engineers and IT staff 10.5 millionthree-yearbenefit PVinvolved.83% The time savings from having data ingestion anddata delivery from multiple sources. The average cost of a resource.Savings from data management efficiencies: 83%of total benefitsResults. To account for these risks, Forresteradjusted this benefit downward by 10%, yielding athree-year, risk-adjusted total PV of 10.5 million.REAL-TIME DATA INTEGRATION ANDimpacts on the customer experience. HavingGOVERNANCE BENEFITSdemocratized data also led to fewer ETL requestsEvidence and data. The Qlik Data IntegrationPlatform allowed the interviewees’ organizations todemocratize data accessibility. This improvedsent to data engineers from business lines and fastertime-to-delivery for requests that could be satisfiedthrough the Qlik Data Integration Platform.business decision-making, value, and the resultingTHE TOTAL ECONOMIC IMPACT OF THE QLIK DATA INTEGRATION PLATFORM10
ANALYSIS OF BENEFITSReal-Time Data Integration And Governance BenefitsRef.MetricSourceYear 1Year 2Year 3B1Data engineers and business analystFTEs needed before using the Qlik DataIntegration PlatformComposite151515B2Percentage of data engineers andbusiness analyst FTE time saved due tohaving automated data collectionComposite25.00%40.00%50.00%B3Fully burdened annual salary per dataengineer and business analystAssumption 125,000 125,000 125,000BtReal-time data integration andgovernance benefitsB1*B2*B3*B4 468,750 750,000 937,500Risk adjustment 10% 421,875 675,000 843,750BtrReal-time data integration andgovernance benefits (risk-adjusted)Three-year total: 1,940,625The solution improved data governance and securityThree-year present value: 1,575,296 because it integrated access through virtualizationwith data cataloging, quality, and stewardshipcapabilities. This allowed the companies to developanalysts involved. migrate data may not need to undertake thesepotentially significant efforts.Modeling and assumptions. For the compositeorganization, Forrester assumes that: analytics-ready data. The average cost of a resource.Results. To account for these risks, Forresteradjusted this benefit downward by 10%, yielding athree-year, risk-adjusted total PV of 1,575,296.15 data engineers and business analysts supportbusiness lines. The time savings from having fully automateddata pipelines, transformation, and creation ofand enforce centralized policies.Through virtualization, companies initially looking toThe number of data engineers and business13%The efficiency to load and query data improveseach year as users become more proficient usingthe Qlik Data Integration Platform. Theorganization becomes 25% more efficient in Year 1.6 millionthree-yearbenefit PV1, 40% more in Year 2, and 50% more in Year 3. The average fully loaded annual salary of aresource is 125,000.Savings from real-time data integration andRisks. Savings from seamless data integration andgovernance: 13% of total benefitsimproved governance will vary with:THE TOTAL ECONOMIC IMPACT OF THE QLIK DATA INTEGRATION PLATFORM11
ANALYSIS OF BENEFITSSAVINGS ENABLED BY SIMPLIFIED REPORTINGEvidence and data. Interviewees said implementingRisks. Savings from simplified reporting will vary withthe average cost of resources.the Qlik Data Integration Platform led to labor andResults. To account for these risks, Forrestertime savings in the following ways:adjusted this benefit downward by 10%, yielding a The solution allowed the organizations to make itthree-year, risk-adjusted total PV of 508,000.easier for their business users to directly accessdata more quickly, to self-provision data for their4%analysis as well as AI and machine-learninginitiatives, and to get immediate insights without relying on technical teams to provide data. 508,405Technical teams saved time by no longer fieldingthree-yearbenefit PVrequests from business users to pull lists andanalyze data on their behalf. Technical teams gained the ability to easilyaccess data within their own systems and toconduct their own queries of data, analyze datacombined with other data sets, and create theirSavings enabled by simplified reporting: 4% oftotal benefitsown models and reports.Modeling and assumptions. Forrester assumes thecomposite organization would need to add twoadditional FTEs to produce reports in its manuallydriven legacy environment and to match thereporting/visualization capabilities of the Qlik DataIntegration Platform.Savings Enabled By Simplified ReportingRef.MetricSourceC1FTE savings on reportingCompositeC2Average fully burdened annual salary perFTECtCtrYear 1Year 2Year 31.52.02.0Assumption 125,000 125,000 125,000Savings enabled by simplified reportingC1*C2 187,500 250,000 250,000Risk adjustment 10% 168,750 225,000 225,000Savings enabled by simplified reporting(risk-adjusted)Three-year total: 618,750THE TOTAL ECONOMIC IMPACT OF THE QLIK DATA INTEGRATION PLATFORMThree-year present value: 508,40512
ANALYSIS OF BENEFITSUNQUANTIFIED BENEFITSAdditional benefits that customers experienced butwere not able to quantify include: Flexibility would also be quantified when evaluated aspart of a specific project (described in more detail inAppendix A).Improved efficiencies in data-driven decisionmaking. Implementing the Qlik Data IntegrationPlatform facilitated data exploration and inspiredmany teams across the organizations to ask andget answers to critical business questions thatthey previously could not have resolved. Thiscreated cultures of data curiosity as more usersgained access to the platform. Instead of filing ITtickets and waiting for other teams to providereports, teams could get answers to theirquestions themselves within minutes. For thecomposite organization, this enables businessfunctions to use insights for more strategicdecisions. Improved agility and flexibility. Organizationcould gain the ability to deploy in any cloudconfiguration, rapidly integrate with an everincreasing array of data sources, targets, andplatforms. Increased operational efficiency and reducedrisks. The automation of coding intensive tasksis minimizing error prone processes and free updata engineers time to focus on higher-valuetasks.FLEXIBILITYThe value of flexibility is unique to each customer.There are multiple scenarios in which a customermight implement Qlik data integration platform andlater realize additional uses and businessopportunities, including: Improved IT and business alignment. IT canquickly build scalable data pipelines and enforcecentralized security and governance – whilegiving data consumers the self-sufficiency toeasily find, understand, and take action on data.THE TOTAL ECONOMIC IMPACT OF THE QLIK DATA INTEGRATION PLATFORM13
Analysis Of CostsQuantified cost data as applied to the compositeTotal CostsRef.CostDtrLicensing andprofessional servicescostsEtrPlanning, ongoingmanagement, andresource costsTotal costs (riskadjusted)InitialYear 1Year 2Year 3TotalPresentValue 948,750 0 935,000 935,000 2,818,750 2,423,957 79,200 274,560 282,797 145,631 782,188 671,931 1,027,950 274,560 1,217,797 1,080,631 3,600,938 3,095,888LICENSING AND PROFESSIONAL SERVICESRisks. Implementation costs will vary depending on:COSTS The complexity of the deployment.Evidence and data. Interviewees said deploying the The size and scope of the implementation.Qlik Data Integration Platform included paying licenseand professional services costs.Results. To account for these risks, Forresteradjusted this cost upward by 10%, yielding a three-Modeling and assumptions. For the compositeorganization, Forrester assumes that: year, risk-adjusted total PV (discounted at 10%) of 2.4 million.The composite organization pays
THE TOTAL ECONOMIC IMPACT OF THE QLIK DATA INTEGRATION PLATFORM 6 EXECUTIVE SUMMARY TEI FRAMEWORK AND METHODOLOGY From the information provided in the interviews, Forrester constructed a Total Economic Impact framework for those organizations considering an investment in the Qlik Data Integration Platform.