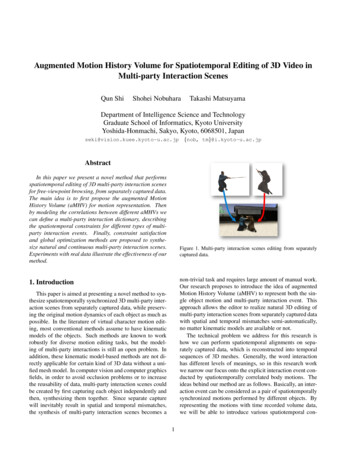
Transcription
Spatiotemporal andstratigraphic trends in salt-waterdisposal practices of the PermianBasin, Texas and New Mexico,United StatesCasee R. Lemons, Guinevere McDaid, Katie M. Smye,Juan P. Acevedo, Peter H. Hennings, D. Amy Banerji,and Bridget R. ScanlonABSTRACTSubsurface disposal of salt water coproduced with oil and gas hasbecome a critical issue in the United States because of linkages withinduced seismicity, as seen in Oklahoma and northcentral Texas.Here, we assess the spatiotemporal and stratigraphic variations ofsalt-water disposal (SWD) volumes in the Permian Basin. The resultsof this analysis provide critical input into integrated assessmentsneeded for handling of produced water and for emerging concerns,such as induced seismicity.Wellbore architecture, permits, and disposal volumes were compiled, interpreted for disposal intervals and geologic targets, andsummarized at formation, subregion, a 100-mi2 (260-km2) area, andmonthly volumes for the years 1978–2016. Geologic targets wereinterpreted by intersecting the disposal intervals with gridded stratigraphic horizons and by reviewing well logs where available.A total of 30 billion bbl ( 5 trillion L) were disposed into 73geologic units within 6 subregions via 8201 active SWD wells for39 yr. Most disposal occurred in the Midland Basin and Central BasinPlatform (CBP) over the first 34 yr but shifted from the CBP to theDelaware Basin over the last 5 yr (2011–2016) with the expansion ofunconventional oil and gas production. Approximately half of the saltwater is disposed above the major unconventional reservoirs intoGuadalupian-aged formations, raising concerns of overpressuring andinterference with production. Operators are exploring deeper SWDtargets; however, proximity to crystalline basement poses concernsfor high drilling costs and the potential for induced seismicity byreactivation of deep-seated faults.Copyright 2019. The American Association of Petroleum Geologists/Division of EnvironmentalGeosciences. All rights reserved.Manuscript received March 4, 2019; provisional acceptance June 20, 2019; revised manuscript received August16, 2019; final acceptance September 19, 2019.DOI:10.1306/eg.06201919002Environmental Geosciences, v. 26, no. 4 (December 2019), pp. 107–124107AUTHORSCasee R. Lemons Sourcewater, Inc.,Houston, Texas; casee@sourcewater.comCasee Lemons is currently the director ofgeoscience at Sourcewater, Inc., in Houston,Texas. At the time of this research, Casee wasthe principal investigator for Texas Injectionand Production Analytics within the TexNetresearch initiative at the Texas Bureau ofEconomic Geology. Casee’s expertise is inintegrated geological studies in the oil andgas industry.Guinevere McDaid Texas Bureau ofEconomic Geology, The University of Texasat Austin, Austin, Texas; guin.mcdaid@beg.utexas.eduGuinevere McDaid is an energy data andgeographic information systems analyst at theBureau of Economic Geology, The Universityof Texas at Austin. She received a B.Sc. ingeography and anthropology as well as anM.S. in geography from Texas State UniversitySan Marcos. Her expertise is in geodatabasecreation and management, geospatial dataanalyses, map design, and data mining.Katie M. Smye Texas Bureau ofEconomic Geology, The University of Texas atAustin, Austin, Texas; katie.smye@beg.utexas.eduKatie Smye is a geologist at the Bureau ofEconomic Geology, The University of Texas atAustin. She received a B.Sc. in geology from theUniversity of Oklahoma and a Ph.D. from theUniversity of Cambridge. Her research interestsinclude geologic and petrophysical analysis ofshale gas and oil plays and characterization ofintervals used for disposal of flowback andproduced water.Juan P. Acevedo Jackson School ofGeosciences, The University of Texas atAustin, Austin, Texas; jpa2274@utexas.eduJuan Acevedo was born in Bogotá, Colombia,and has lived in different countries includingColombia, Mexico, England, and the UnitedStates. In 2018, Juan earned a B.Sc. ingeophysics from Texas A&M University. He iscurrently working on his M.Sc. in energy and
earth resources at The University of Texasat Austin.INTRODUCTIONPeter H. Hennings Center forIntegrated Seismicity Research (CISR), TexasBureau of Economic Geology, The Universityof Texas at Austin, Austin, Texas;peter.hennings@beg.utexas.eduEnergy and environmental futures depend on water managementsolutions that strategically account for safe, economic management ofoil and gas wastewater. Safe practices are essential for reducing adverseimpacts on the environment, including potentially human-inducedseismic activity from wastewater disposal (National Research Council, 2013; Ground Water Protection Council and Interstate Oil andGas Compact Commission, 2017). Before reliable strategies can bedeveloped, a comprehensive understanding of historical wastewatermanagement linked to subsurface geology should be developed.Peter Hennings is a research scientist at theBureau of Economic Geology, The Universityof Texas at Austin, where he is principalinvestigator at the CISR and a lecturer in thedepartment of geological sciences. Peterworked in the petroleum industry for 25 yearsas a research scientist (Mobil Oil and PhillipsPetroleum) and technical manager(ConocoPhillips).D. Amy Banerji Texas Bureau ofEconomic Geology, The University of Texasat Austin, Austin, Texas; amy.banerji@beg.utexas.eduDamayanti Amy Banerji is a geologist andstratigrapher at the Texas Bureau of EconomicGeology with more than 10 years of experience,including 6 years in the oil and gas industry.She has analyzed a wide range of stratigraphicsettings to characterize geology of thesubsurface, and understands its impacton underground resources.Bridget R. Scanlon Texas Bureau ofEconomic Geology, The University of Texas atAustin, Austin, Texas; bridget.scanlon@beg.utexas.eduBridget Scanlon is a senior research scientistat the Texas Bureau of Economic Geology.She serves as an associate editor for WaterResources Research and EnvironmentalResearch Letters and has authored orcoauthored approximately 100 publications.Bridget Scanlon is a fellow of the AmericanGeophysical Union and of the GeologicalSociety of America and a member of theNational Academy of Engineering.ACKNOWLEDGMENTSThe authors would like to thank the RailroadCommission of Texas and New Mexico OilConservation Division for their cooperationand communication regarding salt-waterdisposal permitting policies, data acquisition,108Permian Basin Salt-Water Disposal TrendsProduced WaterOil and gas production generally result in the coproduction of waterfrom the wellbore. This water is primarily briny formation waterbut may contain some water that was injected into the reservoirfor hydraulic fracturing (flowback water) or water flooding. Variousterms are used to describe the produced water (PW), includingflowback and PW (Nicot et al., 2014), or, in many cases, simply PW(US Geological Survey, 2018). The United States produced an average of 10 bbl (1590 L) of water per barrel of oil in 2012, althoughPW volumes can range from a few barrels ( 500 L) to 200 bbl( 32,000 L) of PW per 1 bbl (159 L) of oil (Veil, 2015). Theseestimates do not distinguish between PW from conventional, highpermeability reservoirs and unconventional, low-permeability reservoirs. Frequently, PW from conventional reservoirs is managed byinjecting it back into the reservoir to maintain reservoir pressure foroil production or to increase oil production using water flooding,both of which we group into the secondary recovery (SR) scheme.Water may also be permanently injected into the subsurface withthe intention of not affecting production in any way; we refer to thispractice as salt-water disposal (SWD). Studies of PW managementpractices across the United States show that PW injection was divided almost equally between SR and SWD in 2007 (Clark andVeil, 2009) and 2012 (Veil, 2015).Underground Injection Control ProgramThe Underground Injection Control (UIC) Program regulates SWDand SR wells. The UIC Program was established in 1974, whenCongress passed the Safe Drinking Water Act (SDWA) as the basisfor regulating UIC wells and granted authority to the EnvironmentalProtection Agency (Environmental Protection Agency, 2016). TheEnvironmental Protection Agency has grouped injection wells intosix classes (classes I–VI) based on the type of wastewater being injected, thus affecting wellbore design (Clark et al., 2006; Environmental Protection Agency, 2016). All injection wells related to oiland gas activity are class II wells, including SWD and SR. Theagency later awarded primacy, or authority to regulate, class II
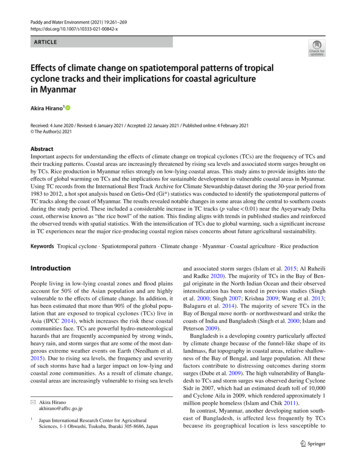
wells to many states under Section 1425 of the SDWA. In 1982,primacy was awarded to the Railroad Commission of Texas (RRC)and the New Mexico Oil Conservation Division (NMOCD) (Environmental Protection Agency, 2018).Class II Well Typesand trends. Funding for this project isprovided by the state of Texas through theTexNet research collaborative. The softwarethat was used includes IHS Petra version 3.8.3for the relational database and ArcMapversion 10.3.1 for geographical informationsystems mapping.In this paper, we discuss SWD and SR class II wells, with a focuson SR in the Permian Basin (Figure 1). Texas and New Mexico havedifferent cataloging schemes for class II wells, although both stateseffectively distinguish SWD from SR. For Texas, we use the RRCtypification scheme and consider types 1 and 2 as SWD and type 3as SR. The RRC type 1 is disposal into a zone not productive of oiland gas; RRC type 2 is disposal into a zone productive of oil and gas;and RRC type 3 is enhanced oil recovery or SR (CDM Smith, 2014;Railroad Commission of Texas, 2014). Because disposal is designedto have no impact on production, type 2 disposal typically occurs in aformation that was formerly productive but is no longer economic inthat location. New Mexico has a simpler cataloging scheme of disposal and injection class II well types (New Mexico Oil ConservationDivision, 2004), with no distinction between disposal into productive versus nonproductive formations. For simplification, we groupTexas’ types I and II into the SWD scheme and New Mexico’s injection wells into the SR scheme. Texas and New Mexico also permit avariety of other class II well types that are not discussed in this paper.Texas and New Mexico Permitting RegulationsTexas and New Mexico permitted values for class II wells includemaximum wellhead injection pressure, top and bottom depths ofinjection interval, and packer depth. Other parameters that may beincluded in the permit are target formation name (Texas and NewMexico), tubing size (New Mexico), permitted fluids (Texas), andcasing integrity test frequency (Texas) (New Mexico Oil Conservation Division, 2019; Railroad Commission of Texas, 2019a). NewMexico SWD and SR maximum wellhead injection pressures arepermitted at a gradient (psi/ft), and injection depths are permittedtop to base, in feet. New Mexico permitted injection pressure mayor may not include a maximum pressure value. Texas maximumwellhead injection pressure is permitted at 0.5 psi/ft (3.5 kPa/m)up to the top of the injection interval. The 0.5 psi/ft (3.5 kPa/m)pressure regulation applies across most of the state of Texas with afew exceptions (Railroad Commission of Texas, 2019b), the Permian exception being the Delaware Mountain Group in the Delaware Basin, which is permitted at a maximum wellhead pressureof 0.25 psi/ft (1.7 kPa/m) as of 2019 (A. Rios, 2019, personalcommunication).The top and bottom depths of the injection interval are typicallyapplied for and approved at a depth range that is greater than what isused by the wellbore perforation design. Therefore, it is necessary toLemons et al.109
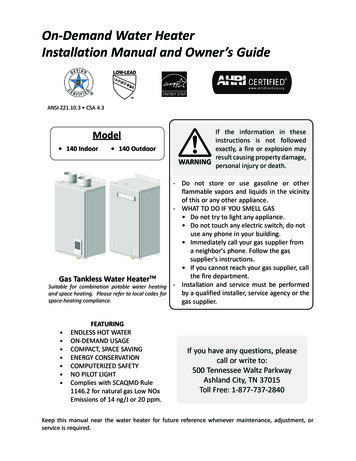
Figure 1. The Permian study has six subregions of focus, with class II wells in the Permian Region actively injecting water any time from1978–2016. Wells are mapped according to their surface hole location. If a well was active as more than one Underground Injection Control(UIC) class II type, the well is mapped twice. Permits were extracted from the New Mexico Oil Conservation Division and RailroadCommission of Texas websites and are classified by the UIC class II permit types. New Mexico injection wells are combined with Texassecondary recovery wells and are shown in orange.extract active perforations within the permitted rangeto ascertain the actual disposal interval. Similarly, thepermitted formations cover the entire expanse of thepermitted injection interval and the formation namemay or may not be included in the permit. To interpretthe formation for injection, it is necessary to first extract110Permian Basin Salt-Water Disposal Trendsthe active disposal interval and land it inside structural–stratigraphic zones, which we have done in this paper.In New Mexico, permits are granted depending onwhether the targets are noneconomical or noninterferingwith production yields; thus, the permitting of certainformations has changed over time. For example, New
Mexico freely permitted disposal into the time-equivalentDelaware Mountain and Artesia Groups until 2010,when New Mexico Administrative Code 19.15.16.15went into effect. The new “horizontal rule” authorizedwell laterals to exceed 4500 ft (1372 m) and made theseformations newly economical for production, greatlyreducing permitting for SWD in the Delaware Mountainand Artesia Groups (P. Goetze, 2017, personal communication). To prevent interference with production,New Mexico is currently not permitting new SWDwells into Guadalupian strata near actively producinglocations. New Mexico is no longer issuing any newpermits for disposal into the Ellenburger Group toprevent seismicity induced by injection near basementseated faults (P. Goetze, 2017, personal communication).Seismicity Associated with Fluid InjectionBecause of links to induced seismicity, particularly inOklahoma, there is increasing concern about the management of PW (Keranen et al., 2013, 2014; Hough andPage, 2015; Walsh and Zoback, 2015). A new classification scheme of induced seismicity has been proposedas those related to oil and gas wastewater fluid injection(Doglioni, 2018). Positive correlations were found between the number of earthquakes, magnitude of earthquakes, and subsurface fluid exchange via SWD wells(Keranen et al., 2014; Hornbach et al., 2015, 2016), SRwells (Improta et al., 2015), hydraulic fracturing wells(Horton, 2012; Maxwell et al., 2015), and oil and gasproduction wells (Davis et al., 1995; Frohlich andBrunt, 2013). Previous studies have linked SWD-relatedseismicity to SWD injection rates (Weingarten et al.,2015; Barbour et al., 2017), cumulative SWD volumes(Suckale, 2009; Ellsworth, 2013; McGarr, 2014; Walterset al., 2015), and proximity of the SWD geologic targetto the basement (Ellsworth, 2013; Maxwell et al., 2015;Hornbach et al., 2016; Hincks et al., 2018). McGarr’s(2014) case history analyses emphasized total volume offluid injected into the subsurface as the primary determinant of seismicity, whereas other case studies showedrate change as the primary impact factor for inducingseismicity in the midcontinent United States (Weingartenet al., 2015), Osage County, Oklahoma (Barbour et al.,2017), and the Val d’Agri Basin in onshore Europe(Improta et al., 2015). Some studies concluded thatboth total volume and fluid rates can cause seismicity,as long as those fluids cause the pore pressure at a faultto exceed the critical failure threshold (Keranen et al.,2013, 2014; Improta et al., 2015; Abrahams et al.,2017). An update (Scanlon et al., 2017) of the Weingarten et al. (2015) study added 3.5 yr of Oklahoma dataand a new basement map showing that cumulative regional SWD volumes, as well as proximity of SWD to thebasement, were all linked to seismicity in Oklahoma.This study shows that limited seismicity in other majorunconventional oil plays has been attributed mostly toshallow SWD above the unconventional oil and gas reservoirs in Bakken, Eagle Ford, and Permian Basin plays.The region around the city of Pecos, Texas, iscurrently experiencing the highest rate of earthquakeoccurrences in Texas, greatly exceeding historical rates(Frohlich et al., 2019). Whether these earthquakes arelinked to SWD, hydraulic fracturing, oil and gas production, other potential causes, or a complex combination of factors is currently unknown. Areas in thePermian Basin, such as Scurry and Kent Counties, haveshown a high potential for fault slip from small porepressure changes (Lund Snee and Zoback, 2016) thatare most likely being induced by oil and gas activities(Davis and Frohlich, 1993; Frohlich et al., 2016),demonstrating the need for quantitative delineationof disposal volumes, both geospatially and stratigraphically. West Texas has experienced an increasein seismicity rates, with as many as 12 events, includingearthquakes with magnitudes greater than 3.0, peryear since 2008 (Frohlich et al., 2016). According tothe scoring and categorization system proposed byFrohlich et al. (2016), this increase in local seismicityin the Permian Basin is almost certainly induced,though the mechanisms remain unknown. The likelihood of seismicity depends on variability in rockproperties determined by local geological conditionsplus local pore pressure changes and fluid flow, possibly caused by influx of salt water during disposal.Rock properties, such as porosity and permeability,change vertically and spatially across the basin. Therefore, geospatial and subsurface zones will experiencevarying sensitivity to SWD or SR (Shah and Keller,2017). It is important to analyze volumes, rates, andsubsurface targets of SWD because both geologic character and SWD practices are contributing factors toinduced seismicity and are important considerationsfor future wastewater management.Study ObjectivesThe objective of this study was to quantify SWD volumes in terms of the temporal changes related to geography and stratigraphy. The primary driver of thisLemons et al.111
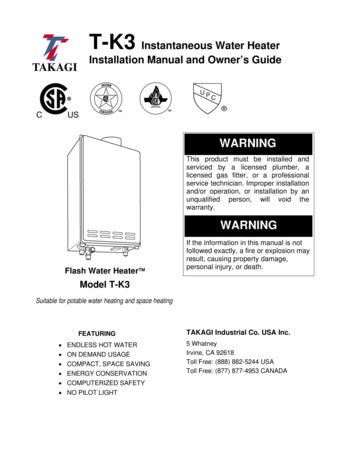
work was to understand net fluid budgets and subsurface capacity because of impacts on pressure andpotential links to seismicity. Novel aspects of thiswork include the extended time period examined(1978–2016), the large number of SWD wells evaluated (8201), detailed evaluation of SWD volumesby mining data from state commissions coordinatedwith well-specific, quality-controlled monthly SWDvolumes, and linking disposal intervals to a threedimensional stratigraphic model with 73 stratigraphichorizons in the Permian Basin. The stratigraphic column developed in this study was based on severaldifferent structural and stratigraphic interpretations(e.g., Jones, 1953; West Texas Geological Society,1958, 1976; Keller et al., 1980; Hills and Kottlowski,1983; Dutton et al., 2004; Hentz et al., 2016; Ruppel,2019). Interpretations of the geologic targets aremuch more highly resolved vertically and horizontallythan in previous analyses. This study analyzes a longertime period and interprets stratigraphy at higher resolution than the recent reconnaissance analysis ofSWD in the Permian Basin related to general disposalintervals (shallow, intermediate, and deep) in producing intervals over a short time period (2008–2016)(Scanlon et al., 2017, 2018). The results presentedin this study are more detailed than any single-year analysis(Murray and Holland, 2014), 5-yr analysis into 12stratigraphic zones (Murray, 2015), or statewideanalyses of estimated injection volumes and permittype distributions (Clark and Veil, 2009; Veil, 2015).METHODSThe Permian Basin is divided into six subregions: theNorthwestern Shelf, Delaware Basin, Val Verde Basin,Central Basin Platform (CBP), Midland Basin, and EasternShelf (Figures 1, 2A). Within each subregion, a stratigraphic correlation chart (Figures 3A; 4; 5) was developedbased upon the following: (1) previous structural andstratigraphic work; (2) operator-reported naming conventions of formation tops reported in W-2 completionforms from the RRC; and (3) structural–stratigraphic gridsof Bureau of Economic Geology researcher top picks,log tops, and operator-reported tops. The spatiotemporaldistribution of SWD volumes in each subregion isshown in Figure 2B.Permits from the UIC from the New Mexico OilConservation Division (2019) and Railroad Commission of Texas (2019a) were placed into a relational112Permian Basin Salt-Water Disposal Trendsdatabase software using the 10-digit API number asprimary key. A total of 8201 SWD wells were activelydisposing fluids into the subsurface from 1978 through2016 in the Permian Basin. Quality control for dataentry errors included comparison of monthly disposalvolumes with average and maximum wellhead pressures with a graphic overlay of each data set. Disposaldepth intervals and associated geologic targets wereidentified using a combination of permit parameters,structural–stratigraphic grids, and lease depths. Ifmultiple formations were targeted for disposal ina single well, volumes were normalized across the targetsaccording to the count of formations intersecting thedisposal interval. Annual and cumulative volumeswere mapped within 100-mi 2 (260-km2) grid blocks.Disposal intervals were identified for each SWDand SR well. Disposal intervals are not readily availablefrom any one source, but they are interpreted basedon large data sets, quality control, and per-well evaluations. The disposal depth intervals were selectedby integrating the wellbore’s history, including drilling,completions, and permit histories with 73 structural–stratigraphic grids and operator-reported formationtops and nearest-neighbor correlations. Structural–stratigraphic horizons were created across the sixsubregions to compute the structural thickness of SWDtarget zones. Approximately 765,000 well-based formation tops were used in grid construction via a prioritized ranking system based upon the stratigraphicpicks of internal researchers, commercial tops, andoperator-reported tops. Interpretation of the disposal interval was based upon extraction of active perforations within the wellbore’s completion history of eachwell to match with the H10 annual reported depths(Texas), permitted depths (Texas and New Mexico),and/or test depths (New Mexico). The disposal topand bottom, typically a subinterval of the permitteddepth range, were selected as the most accurate representation of the wellbore’s currently active perforation scheme. Where available, Delaware MountainGroup well logs were used to confirm disposal intothe Delaware Mountain Group in the Delaware Basin.Structural–stratigraphic contour surfaces for eachformation were created and then were sampled toSWD wells. Interpreted disposal depths were landedinside the contours to evaluate which formation(s)were being actively disposed into.A generalized chart of the stratigraphic interval ofdisposal across the Permian Basin was colored by thetotal volume disposed from 1983–2016 (Figures 3, 4).
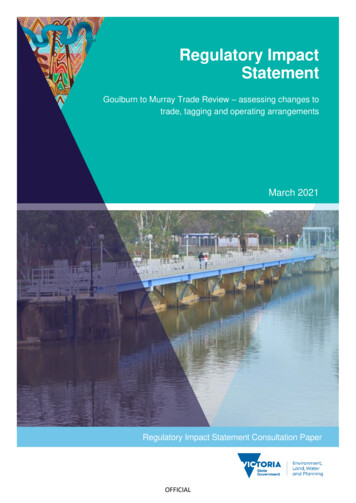
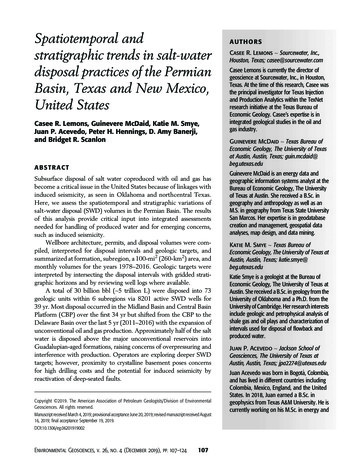
Figure 2. (A) Permian subregions. The subregion color scheme acts as a location reference guide throughout the images. (B) Qualitycontrolled monthly salt-water disposal volumes (1978–2016) are stacked in order with highest total volume (Midland Basin) on top to lowesttotal (Val Verde Basin) on bottom.Lemons et al.113
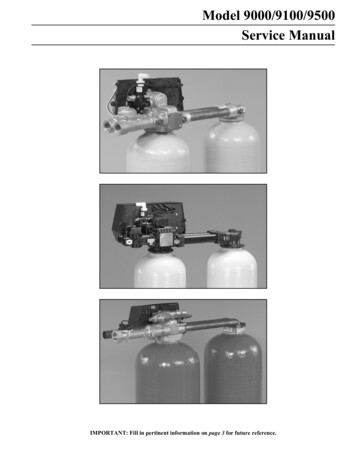
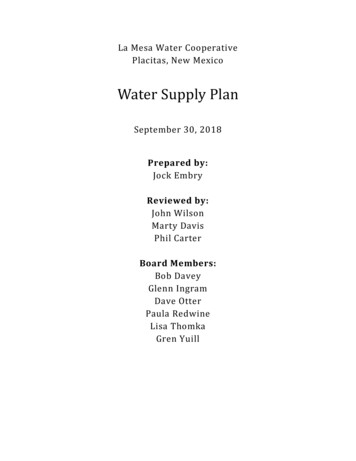
Figure 3. Geographic, geologic, and temporal variation in salt-water disposal (SWD) activity for the Permian Region, Texas, from1983–2016. (A) Cumulative disposal volumes (1983–2016) are differentiated into 40 major geologic targets using the cumulative disposalvolumes color scale, for which blue indicates the lowest volume and red indicates highest volumes. (B) Cumulative SWD volumes aremapped in 100-mi2 (161-km2) block grids using the same color scale. (C) Time series chart with monthly SWD volumes (gray area) andmonthly active well counts overlain by monthly earthquake counts (magenta) and running cumulative disposal volume (dash). USGS USGeological Survey.114Permian Basin Salt-Water Disposal Trends
Formation names shown on the chart were selectedfrom the current naming conventions of operatorsand regulators to generate a practically applicable use.Common-use names, or those recorded during permitting and drilling, were retained and preferentiallyused for the chart. Local formation names or archaicreservoir descriptors (e.g., “6250 sand”) were reclassifiedaccording to the most common equivalent formationin the subregion. Most formation classifications werestraightforward, with the exception of the Cisco, Canyon,and Strawn Groups in the Eastern Shelf, which are permitted for SWD into 25 different members. For simplicity, the 25 members were reclassified into theirparent Cisco, Canyon, or Strawn Groups for Figure 4;these groups are expanded to show differentiation intothe 25 permitted members in Figure 5. Formation blockheights within the correlation chart indicate the relative depositional time span and formation age, notformation thickness. Each formation name blockis filled with a color scale that represents the cumulative colors in the correlation chart range blue to red ina heat-style scale.Cumulative SWD volumes were allocated into eachSWD target and shown within the stratigraphic correlation chart using a color scale that matches the geographic distribution of volumes seen in the maps. TheSWD volumes were mapped using 100-mi2 (260-km2)block grids. Disposal wells were spatially assigned tothe 100-mi2 (260-km2) block grids using a spatial joinusing geographic mapping software. Total cumulative disposal volumes per well for each block werethen calculated. Disposal volume maps were coloredby cumulative volumes spatially distributed acrossblocks. Temporal variation in SWD volumes is shownin Figures 3B and 6. Monthly SWD volumes wereplotted across time, along with monthly active SWD wellcounts and cumulative disposal volumes. A monthlycount of earthquake occurrences (US Geological Survey, 2019) was overlain with the monthly SWD volumes in Figure 3C. All maps created for the purposeof this research were done using ArcMap 10.6. Mapswere projected in NAD 1927 StatePlane Texas CentralFIPS 4203 coordinate system.SPATIOTEMPORAL TRENDS OF SALT-WATERDISPOSALFrom 1978–2016, 30 billion bbl ( 5 trillion L) weredisposed into 73 stratigraphic horizons of the PermianBasin via 8201 SWD wells (Figures 3A; 4; 5; Table 1).The early data from 1978–1982 are limited to NewMexico because monthly reporting was not required inTexas during time (Figure 6). Most disposal occurred inthe Midland Basin and the CBP over the first 35 yrbut shifted by decreasing in the CBP and increasing inthe Delaware Basin over the last 5 yr (2011–2016,Figure 2B) because of the expansion of unconventionaloil and gas production. Low volumes from 1986–1989(Figure 6) reflect the 1980s oil bust, with a maximumdecline of 91% in 1986 from the previous peak in1985. Large SWD volumes in the Midland Basin andCBP from 1983–2010 (Figure 2B) reflect producedwastewater from conventional production. Beginning in 2010, production unconventional reservoirs vialateral wells resulted in large SWD volume increases(Figure 6) locally in the Delaware and Midland Basincenters (Figure 2B). Volumes of SWD in the Northwestern and Eastern Shelves have been generally constant over time (Figure 2B). New Mexico’s recent reductionin SWD permitting into the strata of Guadalupian ageand the Ellenburger Group is seen as a slight drop inactivity in the Northwestern Shelf (Figure 2B). Activityin the Val Verde Basin shows small, constant disposalvolumes from 2006–2016 (Figure 2B) because of lowproduction activity in the Val Verde.Cumulative disposal volumes from 1978–2016 weremapped in 100-mi2 (260-km2) blocks and across time(Figure 3B, C). The highest volumes of cumulativeSWD lie near the margins of the Delaware Basin, CBP,and Midland Basin (Figure 3B). The Eastern Shelf andNorthwestern Shelf have high SWD volumes along theshelf margins that decrease away from the basins; theNorthwestern Shelf shows decreasing volumes southto north, and the Eastern Shelf shows decreasing volumes west to east. Cumulative SWD volumes aredisplayed in the stratigraphic column that indicatesthe lateral variation of disposal in chronostratigraphictime.In the New Mexico part of the Delaware Basin,SWD into Guadalupian strata has been constant because of conservative permitting, whereas Texas disposalinto Guadalupian strata is increasing rapidly in Texas.Increasing SWD volumes in the Delaware Basin since2011 (Figure 2) can be almost entirely attributed to SWDinto Guadalupian strata within Texas. However, NewMexico is currently not permitting new SWD wells intoGuadalupian strata near active production areas, nor is itissuing any new permits for disposal into the EllenburgerGroup (P. Goetze, 2017, personal communication).Lemons et al.115
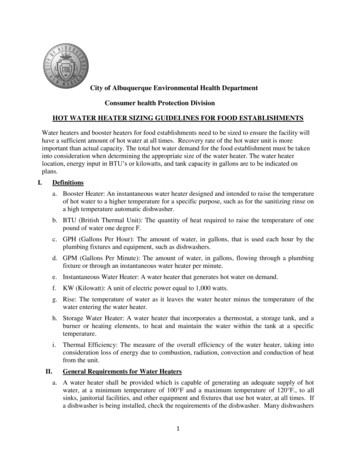
Figure 4. Stratigraphic correlation chart with disposal targets within each Permian subregion. Subregion colors in the header correspondto the map colors in Figure 2. Colors indicate disposal volume in million barrels; white indicates no volume; gray indicates no formationdeposition; height of block indicates time of deposition; Cambrian base is cropped. The color scale is shown for 1978–2016 cumulativedisposal volumes. The volumetric color scale used in block maps in Figure 3A and B is the same volumetric color scale used in thestratigraphic correlation chart shown in Figures 5 and 6. Modified from Jones (1953), West Texas Geological Society (1958, 1976), Iglehart(1967), Keller et al. (1980), Galloway et al. (1983), Hills and Kottlowski (1983), Childs (1985), Ward et al. (1986), Olson and Johnson (1993),Powers (1993), Grant et al. (1994), Yang and Dorobek (1995), Montgomery (1996), Murphy and Salvador (1999), Christmann (2004), Duttonet al. (2004), Lucas (2004), Broadhead et al. (2005), Menning et al. (2006), Ruppel (2008, 2019), Hamlin and Baumgardner (2012),LimaNeto and Misságio (2012), Walker et al. (2013), and Jones (2016). Gp. Group; L. Lower;
39 yr. Most disposal occurred in the Midland Basin and Central Basin Platform (CBP) over the first 34 yr but shifted from the CBP to the Delaware Basin over the last 5 yr (2011-2016) with the expansion of unconventional oil and gas production. Approximately half of the salt water is disposed above the major unconventional reservoirs into