Transcription
La Mesa Water CooperativePlacitas, New MexicoWater Supply PlanSeptember 30, 2018Prepared by:Jock EmbryReviewed by:John WilsonMarty DavisPhil CarterBoard Members:Bob DaveyGlenn IngramDave OtterPaula RedwineLisa ThomkaGren Yuill
La Mesa Water Cooperative2018 Water Supply PlanChange HistoryDraft 3 (Final) Updated Terminology sectionAdded references to AWWA "Distribution System Requirements for Fire Protection"Added discussion on water levels in tanks to meet fire protection requirementsAdded section on Water ConservationAdded section to explain rationale for well #3 treatment flow sizingAdded Sources section to identify spreadsheets that provide tables and figuresMinor edits and correctionsDraft 2 Added Terminology sectionData was updated to include all of 2017 and first half 2018Except for yearly demand, all other demand charts and tables were changed to be gallons per house(rather than gallons per capita), and adjusted for unbilled water.Corrected Figure & Table numbersChanged Forecast section to cover peak month and peak day estimatesChanged to insert Excel charts as Special Microsoft Office Graphic ObjectDraft 1 Based on Water Supply Plan, 12/29/2015Reorganized sectionsRevised demand charts and tables to show demand per capita instead of per house (based on 1.95residents per house); added data from smart meters.Updated well capacity materialRevised: 10/22/2018 8:37 AM
La Mesa Water Cooperative2018 Water Supply PlanTable of ContentsMission Statement .1Executive Summary .1Terminology .2Assumptions, Requirements, and Goals .3Water Demand and Historical Measurements .4Historical Demand .4Short Term Demand .7Distribution of Demand by House .11Unintended Water Use .13Highest Water Users .17Unbilled and Unaccounted Water .18Demand – Peak Month .19Trends .20Capacity .21Tanks and Distribution System .21Tanks .22Water Storage Level Required for Fire Protection.22Wells .23Demand Compared to Well Capacity .27Duty Cycle .29Forecast .30Projected Demand .30Projected Capacity Requirements .30Annual Water Demand .32Water Rights .33Alternatives.33Mix Water .33Drill a New Well .33Household Treatment such as Reverse Osmosis .33Use Well #3 Water Only for Landscaping .34Water Conservation .34Water Treatment for Well #3 Water .35Upgraded Well #3 and New Arsenic Treatment Facility Capacity .35Load Balancing Across Three Wells .35Contingency Plans.36Recommendations .36References .37La Mesa Water Coop .37Water Supply Plans .37Well Completion Reports .37American Water Works Association (AWWA) .37New Mexico Environment Department (NMED), Drinking Water Bureau (DWB) .37New Mexico Bureau of Geology and Mineral Resources .37Sources .38Revised: 10/22/2018 8:37 AMi
La Mesa Water Cooperative2018 Water Supply PlanFiguresFigure 1 – Historical and Forecast Demand and Capacity, 2002 - 2028 .1Figure 2 – Water Demand Categories.2Figure 3 – Annual Demand .5Figure 4 – Average Monthly Gallons Pumped and Billed .6Figure 5 – Estimated Daily Demand, June 1 – July 7, 2018 .7Figure 6 – Estimated Hourly Demand .8Figure 7 – Hourly Demand on June 29, 2018 .9Figure 8 – Hourly Demand on July 4, 2018 .9Figure 9 – Average Gallons Billed per House per Day, by Percentile.11Figure 10 – Histogram of Water Demand, January 2018.12Figure 11 – Histogram of Water Demand, June 2015, 2016, 2017 & 2018 .12Figure 12 –Unintended Water Use Events for One Example House, 2010 - 2017 .13Figure 13 – Wasted Water Events, 2010 - 2018 .14Figure 14 – Volume and Number of Wasted Water Events, 2010 - 2018.15Figure 15 – Gallons Wasted Compared to Gallons Pumped in Peak Months 2010 - 2018 .16Figure 16 – Water Used by Top Users in Peak Months, 2010 - 2018 .17Figure 17 – Unbilled Water in Peak Months, 2010 - 2018 .18Figure 18 – Water Pumped in Peak Months, 2001 - 2018 .20Figure 19 – Schematic of Water Cooperative Key Components .21Figure 20 – La Mesa Cooperative Wells, July 2018 .24Figure 21 – Well #5 Static and Pumping Levels from Well Tests, 2007 - 2018 .25Figure 22 – Well #6 Static and Pumping Levels from Well Tests, 2014 - 2018 .25Figure 23 – Well #5 Static and Pumping Water Levels from Transducer, 2/2017 – 7/2018 .26Figure 24 – Well #6 Static and Pumping Water Levels from Transducer, 12/2016 – 7/2018 .26Figure 25 – Monthly Average Demand and Well Capacity, 1/2005 – 6/2018 .27Figure 26 – Well #5 Duty Cycle, 2/2017 – 7/2018 .29Figure 27 – Well #6 Duty Cycle, 1/2017 – 7/2018 .29Figure 28 – Historical and Projected Demand and Capacity, 2002 - 20228.31Figure 29 – Historical and Forecast Gallons Pumped per Year, 2001 - 2038 .32TablesTable 1 – Numbers of Houses and Lots as of September 2018 .3Table 2 – Yearly Gallons Pumped, and Average Gallons Pumped per House and per Capita per Day .4Table 3 – Estimated Daily Demand, June 1 – July 7, 2018 .7Table 4 – Estimated gpm by Zone on Peak Days .10Table 5 –Demand in Peaks Months, 2001 – 2018 .19Table 6 – La Mesa Water Cooperative Wells .23Table 7 – Possible Demand Planning Values .30Table 8 – Demand Forecast, 2019 to Full Buildout .31Table 9 – Load Balancing .36Revised: 10/22/2018 8:37 AMii
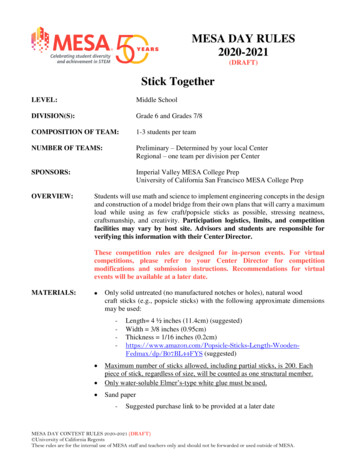
La Mesa Water Cooperative2018 Water Supply PlanMission StatementTo provide a safe, reliable, long-lasting water supply to Members, at acceptable costs.Executive SummaryThis is the continuation of Supply Plan documents prepared by the Cooperative every several years. It provides adetailed review of current demand and capacity, and a forecast out ten years. Current capacity is sufficient to meetcurrent demand for a peak month. Of more immediate concern is the fact that by operating on two wells (#5 and#6), there is not sufficient capacity to meet demand if one of those is out of service in the summer. We cannotmeet demand with only one well. Wells #2 and #3 are kept on standby, and are not used. Well #3 has plenty ofcapacity, but has not been used since 2008 because water from it exceeds the maximum allowable level forarsenic. Well #2 has also exceeded the maximum allowable arsenic level. The project plan to build an arsenictreatment facility for well #3 and put it into regular operation will provide the needed redundancy and capacity outto 2028 and beyond. Figure 1 shows past peak demand and capacity, and projections for the next ten years.300Peak Demand and Capacity35030020025015020015010010050Number of HousesGallons per Minute2504005000Demand: Peak Month (@60%)Demand: Peak Day (@100%)Total Pumping CapacityFallback CapacityNumber of HousesFigure 1 – Historical and Forecast Demand and Capacity, 2002 - 2028 Demand in peak month is forecast to be same as highest month in past ten years (June 2013, 400 gallonsper house per day), and does not go up or down.Monthly demand is to be met by operating all wells at no more than 60% duty cycle.Peak day demand, estimated at 125% of monthly average, to be met with one well out of service, andremaining wells running up to 100% duty cycle.Well #3 arsenic treatment facility is in operation for June 2020.Revised: 10/22/2018 8:37 AMPage 1
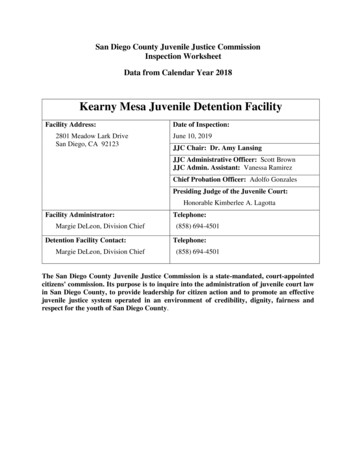
La Mesa Water Cooperative2018 Water Supply PlanTerminologyBilled Water is all the water delivered to Cooperative members, as measured by individual house water meters.Capacity is the amount of pumped water that could be produced, measured in gpm. For each well, this is afunction of the aquifer, well design and construction, and pump and motor. In some cases (such as well #3),changing just the pump and motor may increase pumping capacity.Demand is the amount of pumped water required at any particular time.Fallback Capacity is the total pumping capacity of the Cooperative with the highest capacity well out of service.Gallons per Minute (gpm) is the common metric for water flow.Intended Use is the portion of billed water that the resident expected to use, so excludes leaks, etc.Known Unbilled Water is unbilled water for which we have a measurement or can make an estimate, such as: Fire hydrant flushing Well flushing Distribution systems leaks that are found and fixed Water sold to non-Cooperative members, such as that provided to the North Ranchos Water District inearly 2018 while they drilled a new wellNeeded fire flow (NFF). The NFF is the rate of flow considered necessary to control a major fire in a specific1building for a certain duration. .Pumped Water is the total amount of water produced, as measured by well water meters.Pumping Water Level (PWL) is the number of feet from the top of the well casing to the below ground watersurface, when the well pump is running. As normal for most wells, this increases (water level drops) the longer thepump runs.Static Water Level (SWL) is the number of feet from the top of the well casing to the below ground water surface,when the well pump is not running. This decreases (water level comes up) the longer the pump is off, and finallystabilizes after a day or so.Unaccounted for Water is the difference between pumped water and billed water, and accounting for knownunbilled water. This may be: Unknown leaks in the distribution system Water not measured due to inaccurate water meters. For example, as meters age, they tend to get lessaccurate, or not even record very low flows, such as for a swamp cooler. And it is very difficult to calibrateor verify the accuracy of the well meters. Water stolen from fire hydrantsUnbilled Water is pumped water that is not delivered to houses.Unintended Use, also called leaked, wasted or fugitive water, is caused by things such as: Leaks or breaks in pipes, fittings, valves, etc. on house side of water meter Hose left running Drip irrigation system malfunction, such as a valve stuck open Water softener malfunctionThe relationships between different demand categories are shown in Figure 2.Pumped Water (Total Demand)Billed WaterIntended UseUnintended UseUnbilled WaterKnown Unbilled WaterUnaccounted for WaterFigure 2 – Water Demand Categories1NFF definition from "Distribution System Requirements for Fire Protection"Revised: 10/22/2018 8:37 AMPage 2
La Mesa Water Cooperative2018 Water Supply PlanAssumptions, Requirements, and Goals1.2.3.4.5.6.7.The Cooperative should always maintain sufficient capacity to meet estimated demand.Estimated future demand is based on historical demand and projected growth, without any significantchanges in water use patterns. For example, we are assuming that we will not have to supply a new orchard orvineyard, or that people will not remove all landscaping.Well duty cycle will normally not exceed 60%.The Cooperative should be able to meet normal demand with the highest capacity well (#5 in 2018 and #3 inthe future) out of service for as long as three months. In the case of a well outage, the target duty cycle maybe exceeded for the well(s) remaining in service.The Cooperative should meet the letter and spirit of water quality regulations. For example, the arsenic rulesays that a system is in violation when the running average concentration of four consecutive quarterlysamples is above the limit (10 parts per billion, ppb). The Cooperative plans to not have a single quarterlysample exceed the limit.The Cooperative should be able to meet the Needed Fire Flow (NFF) recommended by the American WaterWorks Association (AWWA) of 500 gpm at a minimum residual pressure of 20 psi for at least two hours(60,000 gallons). Since the two water tanks together hold about 20,700 gallons per foot, this means that thetanks should never go below three feet, with five feet (103,000 gallons) providing some margin. Note that NFFcan be provided to most of the Cooperative service area, even without power. Until the booster system isreplaced or updated, NFF is not provided by houses and hydrants on that system.One new house will be added per year until full build-out. See Table 1.La MesaSundance MesaTotalHouses149181Undeveloped Lots1621Total165202Table 1 – Numbers of Houses and Lots as of September 201833037367Notes:o This includes three La Mesa lots that are not currently Cooperative members.o This excludes three La Mesa houses on private wells that are not Cooperative members.o In Sundance Mesa, an undeveloped lot owned by the neighboring homeowner, that has a watermeter and receives service is billed and treated here as a house.8. The number of houses using private wells (three) will not change. One house that has a private a well and isalso a member of the Cooperative is included in demand estimates, since they could use water at any time.9. The La Mesa HOA CC&Rs allows lots to be subdivided; the Sundance Mesa HOA CC&Rs does not. It is assumedthat additional lots created by subdividing will be roughly balanced by existing empty lots that are never builton.10. Full time vs part time house occupancy will not change.11. Cooperative demographics are not significantly different than Placitas overall, and will not change. The 2010 Census has the Placitas population as 4,977 people in 2,556 houses. This is an average of 1.95 residents per house ("per capita").12. Unaccounted for water each month should be less than 10% of total pumped.Revised: 10/22/2018 8:37 AMPage 3
La Mesa Water Cooperative2018 Water Supply PlanWater Demand and Historical MeasurementsThere are several sources of data to show how much water is pumped and billed: Well meter readings (flow and gallons pumped) are recorded for each well, each month (usually the 1st or2nd day); data goes back to 9/1/1998. This is probably fairly accurate data since the wells have highquality meters. There is not a simple way to calibrate or validate the well meters. This data does not showthe amount of water pumped within a month, such as by day or week. Billing data for each house for each month; data goes back to 1/31/2010. From experience and industryreports, household meters tend to under-report low flow as they age. Smart water meters (with Orion endpoints from Badger Meter) collect data hourly. The Cooperativebegan replacing old meters with these in early 2016. As of May 2018, all houses have new smart meters. Surveillance data, collected through a telemetry system from Mission Communications, includes tanklevel, booster system pressure, and flow rate into and out of the tanks. In 2015 and 2016, Mission systemswere installed for wells #6 and #5, respectively, to collect pressures, flow rates, and water levels in eachwell. This data is normally reported every two minutes, and is available back to 12/2013 for the tank site.This data is somewhat noisy for a number of reasons, is moderately accurate, and allows for demandanalysis by hour and day. We also have Telog surveillance data from 2001 through 2013; that data wasnot used in this study.Historical DemandFrom the monthly well meter readings, Table 2 shows the annual gallons pumped, the number of houses, and theaverage Gallons per Capita per Day (GPCD), for the period 2001 - 2017. For comparison, Santa Fe reports GPCD as95 (2014), the lowest of western cities and Albuquerque GPCD was 135 in 2013. It is not clear how non-residentialwater users are reflected in GPCD measurements.YearAverage GallonsAverage GallonsPumped perPumped perHouse per DayCapita per e26,846,989243125Standard Deviation1,600,351157Average 2005-201727,959,910239123Max 2001-201729,667,814264135Table 2 – Yearly Gallons Pumped, and Average Gallons Pumped per House and per Capita per DayRevised: 10/22/2018 8:37 AMTotal GallonsPumpedNumber ofHousesPage 4
La Mesa Water Cooperative2018 Water Supply PlanFigure 3 shows this annual demand data for the past several ,000,0008015,000,0006010,000,000405,000,000Gallons per DayGallons per YearAnnual Demand2000Total Gallons Pumped per YearAverage Gallons Pumped per Capita per DayFigure 3 – Annual DemandSeveral observations on the annual data: The period 2001 to 2005 reflects the major development of Sundance Mesa. From 2005 on, total demand has been about 28,000,000 gallons per year. There was a drop in demand from 2012 – 2015, which was reversed in 2016 and 2017 (see below). Because of the wide variation between winter and summer demand (see below), yearly averages are notmuch use in capacity planning.Revised: 10/22/2018 8:37 AMPage 5
La Mesa Water Cooperative2018 Water Supply PlanFigure 4 shows the water pumped (from the well meter readings) and billed (from the house meter readings), bymonth, for the past several years. These are shown as gallons per house per day, to normalize for number ofhouses and days in month.Gallons per House per DayMonthly Demand500450400350300250200150100500Pumped WaterBilled WaterFigure 4 – Average Monthly Gallons Pumped and BilledSeveral observations from this chart: There is a large seasonal variation; summer demand is two to three times winter use. The difference between pumped and sold (“unaccounted for water” and other unbilled uses, such ashydrant flushing) is relatively constant over this time. The slight bulges for April – May and August 2017reflect water used for the well #3 arsenic treatment pilot tests. Winter demand has stayed relatively constant, with a slight decrease. From 2012 through 2015, demand in the peak summer month declined; this trend ended in 2016. (From2010 to 2017, the number of houses served went from 320 to 329.) In 2016, there were a number of unintended water use events at houses, that appear as increaseddemand. In February and March 2018, the Cooperative provided water to North Ranchos Water District, sopumped water is substantially greater than billed (which only covers household meters). They werecharged for the water provided.Revised: 10/22/2018 8:37 AMPage 6
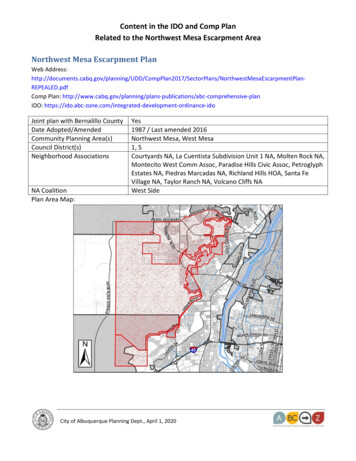
La Mesa Water Cooperative2018 Water Supply PlanShort Term DemandEstimated daily demand, based on data collected from smart meters for the peak demand month in 2018, June, is2shown in Figure 5 and Table 3. These numbers have been adjusted to include un-billed water; hence "estimated".Gallons per House per DayDaily Demand - June 5/2018Estimated Water Pumped6/22/20186/29/20187/6/2018Monthly AverageFigure 5 – Estimated Daily Demand, June 1 – July 7, 2018Estimated Gallons Pumped perHouse per DayAverage324Minimum229Maximum404Standard Deviation39Maximum : monthly average125%Table 3 – Estimated Daily Demand, June 1 – July 7, 2018Observations from this table and chart: All houses had smart meters during this period. The first week of July 2018 is included, because of the peak demand on July 4, 2018. There is not an obvious trend or pattern, such as a peak every seven days, or weekends. The average for the period, 324 gallons per house per day, is close to the monthly average for just June2018 (320) from well meter readings shown in Figure 4. So readings and data collection from the wellmeters and the house meters are consistent, indicating there are not any significant inaccuracies orerrors. The ratio of one day maximum compared to the average, 125%, is used later in this document to projectpeak short term demand.2To get estimated gallons pumped per day, the gallons billed (total of house meters) each day were divided by theratio of monthly total gallons billed to total gallons pumped (97% in June 2018).Revised: 10/22/2018 8:37 AMPage 7
La Mesa Water Cooperative2018 Water Supply Plan3Estimated total demand (including billed and unbilled water), based on hourly data collected from 330 smartmeters (all houses) for the peak week, June 24-30, 2018, is shown in Figure 6.Hourly Demand - June 24-30, 2018Gallons per Minute250200150100500Estimated Water PumpedDaily AveragesFigure 6 – Estimated Hourly DemandObservations from this chart: There is a very distinct pattern of two peaks each day, with the high between 6 and 10 AM, and a lowerpeak between 6 and 9 PM. Peak demand (204 gpm) in a day, about 8 AM, is 12 times the low demand (17 gpm), around midnight,and about 2.5 times average daily demand (81 GPM). This reinforces the important role that the two storage tanks play in the system on a day-to-day basis.During this period, the wells were able to keep the two tanks filled between the desired 12' and 12.5',substantially above the 5' considered necessary for fire protection.3The adjustment to get total demand by hour is the same described above for daily data, that is, divide the hourlybilled water (reported by house meters) by 97% (percent of pumped water that was billed in June 2018).Revised: 10/22/2018 8:37 AMPage 8 p
La Mesa Water Cooperative 2018 Water Supply Plan . Revised: 10/22/2018 8:37 AM Page 2 . Terminology . Billed Water. is all the water delivered to Cooperative members, as measured by individual house water meters. Capacity. is the amount of pumped water that could be produced, measured in gpm. For each well, this is a