Transcription
Paddy and Water Environment (2021) 42-xARTICLEEffects of climate change on spatiotemporal patterns of tropicalcyclone tracks and their implications for coastal agriculturein MyanmarAkira Hirano1Received: 4 June 2020 / Revised: 6 January 2021 / Accepted: 22 January 2021 / Published online: 4 February 2021 The Author(s) 2021AbstractImportant aspects for understanding the effects of climate change on tropical cyclones (TCs) are the frequency of TCs andtheir tracking patterns. Coastal areas are increasingly threatened by rising sea levels and associated storm surges brought onby TCs. Rice production in Myanmar relies strongly on low-lying coastal areas. This study aims to provide insights into theeffects of global warming on TCs and the implications for sustainable development in vulnerable coastal areas in Myanmar.Using TC records from the International Best Track Archive for Climate Stewardship dataset during the 30-year period from1983 to 2012, a hot spot analysis based on Getis-Ord (Gi*) statistics was conducted to identify the spatiotemporal patterns ofTC tracks along the coast of Myanmar. The results revealed notable changes in some areas along the central to southern coastsduring the study period. These included a considerable increase in TC tracks (p value 0.01) near the Ayeyarwady Deltacoast, otherwise known as “the rice bowl” of the nation. This finding aligns with trends in published studies and reinforcedthe observed trends with spatial statistics. With the intensification of TCs due to global warming, such a significant increasein TC experiences near the major rice-producing coastal region raises concerns about future agricultural sustainability.Keywords Tropical cyclone · Spatiotemporal pattern · Climate change · Myanmar · Coastal agriculture · Rice productionIntroductionPeople living in low-lying coastal zones and flood plainsaccount for 50% of the Asian population and are highlyvulnerable to the effects of climate change. In addition, ithas been estimated that more than 90% of the global population that are exposed to tropical cyclones (TCs) live inAsia (IPCC 2014), which increases the risk these coastalcommunities face. TCs are powerful hydro-meteorologicalhazards that are frequently accompanied by strong winds,heavy rain, and storm surges that are some of the most dangerous extreme weather events on Earth (Needham et al.2015). Due to rising sea levels, the frequency and severityof such storms have had a larger impact on low-lying andcoastal zone communities. As a result of climate change,coastal areas are increasingly vulnerable to rising sea levels* Akira Hiranoakhirano@affrc.go.jp1Japan International Research Center for AgriculturalSciences, 1‑1 Ohwashi, Tsukuba, Ibaraki 305‑8686, Japanand associated storm surges (Islam et al. 2015; Al Ruheiliand Radke 2020). The majority of TCs in the Bay of Bengal originate in the North Indian Ocean and their observedintensification has been noted in previous studies (Singhet al. 2000; Singh 2007; Krishna 2009; Wang et al. 2013;Balaguru et al. 2014). The majority of severe TCs in theBay of Bengal move north- or northwestward and strike thecoasts of India and Bangladesh (Singh et al. 2000; Islam andPeterson 2009).Bangladesh is a developing country particularly affectedby climate change because of the funnel-like shape of itslandmass, flat topography in coastal areas, relative shallowness of the Bay of Bengal, and large population. All thesefactors contribute to distressing outcomes during stormsurges (Dube et al. 2009). The high vulnerability of Bangladesh to TCs and storm surges was observed during CycloneSidr in 2007, which had an estimated death toll of 10,000and Cyclone Aila in 2009, which rendered approximately 1million people homeless (Islam and Chik 2011).In contrast, Myanmar, another developing nation southeast of Bangladesh, is affected less frequently by TCsbecause its geographical location is less susceptible to13Vol.:(0123456789)
262possible cyclone paths (Fritz et al. 2009). However, in 2008,Cyclone Nargis (category 4 on the Saffir–Simpson scale),which displayed a peak wind speed of above 200 km/h,followed an unusual eastward track and made landfall inthe Ayeyarwady Delta in Central Myanmar (Yamada et al.2010). Myanmar’s vulnerability to TCs was demonstratedwhen the resulting storm surge caused catastrophic damage to human lives and property with official death tollestimates exceeding 146 thousand fatalities making it theseventh deadliest cyclone ever recorded worldwide withdamage estimates at over US 10 billion (Fritz et al. 2009).Myanmar is a country that is highly affected by extremeweather events, and had the third-highest global climate riskindex over 1997–2016 due to the overwhelming effects ofthis cyclone, whereas Bangladesh ranked sixth over the sametime period (Eckstein et al. 2017).Anthropogenic climate change effects on TCs must beexamined in terms of their frequency and tracks (Krishna2009). The path of Cyclone Nargis, which was characterizedby an eastward movement toward Myanmar after a recurvature over the Bay of Bengal, is considered to be a rare occurrence (Yamada et al. 2010). However, Wang et al. (2013)proposed an atmospheric model consisting of observationaldata and numerical simulations, which can be used to predict conditions favorable for TC intensification and eastwardmovement toward Myanmar in future. This model revealedthat the frequency and tracks of TCs will be altered by variations in the monsoon circulation induced by climate change.Moreover, a collaborative project by the Myanmar government and international organizations counting the number ofhistorical landfalls of TCs in 1947–2008 suggested that therecurvature latitude is continually declining; therefore, TCsare more likely to hit Myanmar in future (Myanmar Government 2009). Meanwhile, Knutson et al. (2010) revieweda variety of modeling studies and reported that there wasno conclusive evidence for changes in TC tracks, indicatinga high variability of modeling results. Furthermore, Walsh(2012) suggested that TC tracks, particularly in the Northern Hemisphere, where the presence of mountain ranges inmid-latitude regions interferes with numerical simulations ofwind patterns, will be less predictable in future compared toits southern counterpart. In essence, the question of whetherclimate change has any statistical effects on tracking patternsof TCs in a given area is still debatable.The 30-year period of 1983–2012 was reported to bethe warmest period in the last 1400 year in the latest IPCCAssessment Report (IPCC 2013). Moreover, a more recentstudy indicated a continuing rise in temperature even afterthis 30-year period (Lenssen et al. 2019). As such, thehypothesis in this study is that there were some localities exhibiting increased or decreased probability of beingimpacted by TCs—including, but not limited to, landfalling TCs—under these unprecedented planetary conditions.13Paddy and Water Environment (2021) 19:261–269The rare recurvature pattern of Cyclone Nargis could possibly be attributed to the change in such spatial patterns. Theassessment of spatiotemporal patterns of TC tracks duringthis period may therefore provide insights into the effectsof global warming on TC tracks and their implications onsustainable development in potentially vulnerable coastalareas. In addition to the fact that this period representeda time of global warming, TC track records are expectedto be more reliable compared with earlier dates (MyanmarGovernment 2009), making them suitable for formal statistical evaluation. This study focused on the vulnerable coastalareas of Myanmar.The purpose of this study was, therefore, to perform aformal statistical evaluation of the changes in the spatiotemporal patterns of TC tracks under the ongoing warming trenddue to climate change over a 30-year span (1983–2012). Theevaluation should enable the identification of patterns, providing insights into future effects on agricultural sustainability in Myanmar. Given the economic importance of riceproduction and sustainable development in Myanmar, particularly in the prominent rice-producing coastal areas, it isvaluable to statistically evaluate changes in the occurrenceof TC tracks along the coast of Myanmar over time.Specifically, the spatial patterns of TC tracks are examined by comparing the first 15-year (1983–1997) and thesecond 15-year (1998–2012) periods of the study (hereafterreferred to as first interval and second interval, respectively).This is because the first interval represents a time of rapidrise in global mean surface temperature (GMST), whereasthe second interval represents a time widely known as theglobal warming hiatus during which global warming trendsdeclined (IPCC 2013). England et al. (2014) reported thatdespite observations of GMST showing an unequivocalwarming over the twentieth century, the overall trend ofGMST had been interrupted by periods of weak warmingor even cooling; the most recent of such interruptions—theglobal warming hiatus—coincided with the second interval. It is generally agreed that the mechanism of the globalwarming hiatus was related to the cooling of the central toeastern tropical Pacific Ocean resulting in the acceleratedtrade winds which then lead to a substantial deceleration insurface warming through increased subsurface ocean heatuptake (England et al. 2014). Critically, the sea surface temperature (SST) is a direct measure of the energy balance thatdrives ocean circulation and ultimately defines the climate(Kumar et al. 2016). It is of particular interest to note thatKumar et al. (2016) reported an SST anomaly in the NorthIndian Ocean, which includes the region studied, herein asthe SST continued to rise through the first and second intervals and the SST of the second interval was higher than thatof the first interval by approximately 0.12 C/decade, whilethe GMST stagnated in the second interval. A similar trendwas reported by Dong and McPhaden (2016) stating that the
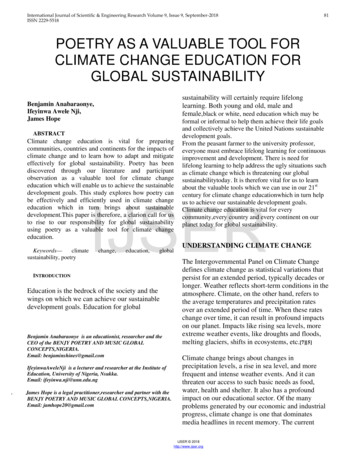
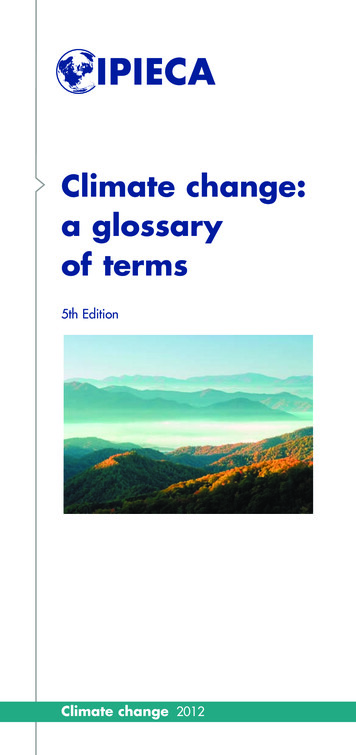
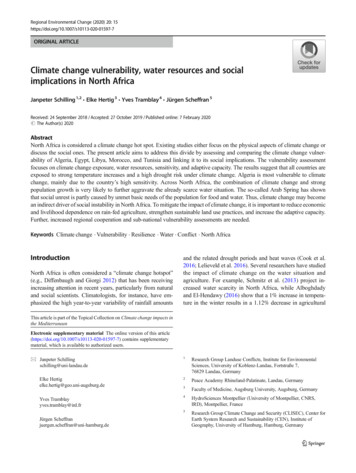
Paddy and Water Environment (2021) 19:261–269SST in the Bay of Bengal kept increasing over the 30-yearperiod (1984–2013); however, the rate of increase in thesecond interval was significantly lower than that of the firstinterval in the North Indian Ocean. Contrarily, when looking at the patterns of the standardized yearly coastal SSTat a local scale, the SST off the coast of most of Myanmarexhibited a unique pattern; coastal SST decreased in the firstinterval, then increased in the second interval (Liao et al.2015). Overall, the region of this study was under substantially different climatic conditions between the two intervals(before and during the global warming hiatus).Materials and methodsStudy area (Myanmar)Myanmar is the second largest country in Southeast Asia(area: 676,577 km2) after Indonesia (Myanmar Government2015). The country has three primary agroecological zones(Fig. 1; Myanmar Government 2012): (i) central dry, (ii)coastal, and (iii) hilly. These zones can be further subdividedinto eight physiographic regions: (i) northern hilly, (ii) central dry, (iii) Rakhine coastal, (iv) western hilly, (v) easternhilly, (vi) Ayeyarwady Delta, (vii) Yangon Deltaic, and (viii)southern Myanmar coastal.Agriculture forms the primary livelihood in Myanmar,with rice being a major agricultural commodity plantedon approximately 50% of the cultivated area. Among the263countries in the Association of Southeast Asian Nations(ASEAN), Myanmar ranks fourth in rice production (28million tons/year; ASEAN Food Security Information System 2018). The major rice-producing physiographic regionsin Myanmar are the Ayeyarwady Delta, central dry zone,Yangon Deltaic, and Rakhine coastal areas (Myanmar Government 2013). Thus, the rice production in Myanmar reliesstrongly on low-lying coastal regions, which are vulnerableto TC-associated risks. Therefore, any changes in the spatiotemporal patterns of TC tracks could considerably affectthe sustainability of agricultural activities in these regions.Among these physiographic regions, the AyeyarwadyDelta, known as “the rice bowl” of Myanmar, occupies anarea of approximately 35,000 km2 and is home to 21 millioninhabitants. The delta has a monsoonal climate, with meanannual rainfall of 1500–2000, 2500, and 3500 mm in itsnorthern, southeastern, and southwestern regions, respectively. More than 90% of the rainfall occurs during the southmonsoon season between mid-May and mid-November (vanDriel and Nauta 2015). This region was the most affectedby the storm surge caused by Cyclone Nargis in 2008. Theconversion of coastal mangrove forests into agriculturalland further contributed to the damage (Webb et al. 2014).The storm surge flooded approximately 7830 k m2 of paddyfields and destroyed approximately 33% of the rice crop inthe delta, with the majority of rice seeds stored in bamboocontainers receiving damage (Stone 2009). Most rice farmers, particularly smallholders with paddy fields merely 3 mabove the sea level, were impacted. Since Cyclone Nargis,Fig. 1 Map of Myanmar’s aagroecological and b physiographic zones (adapted fromMyanmar Government, 2012)13
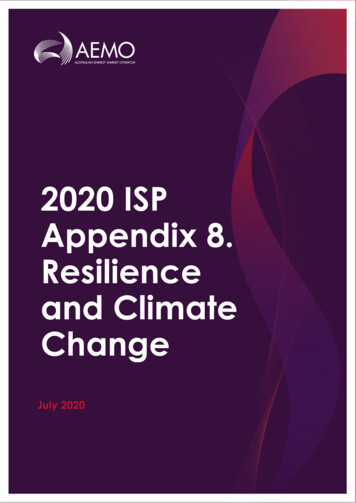
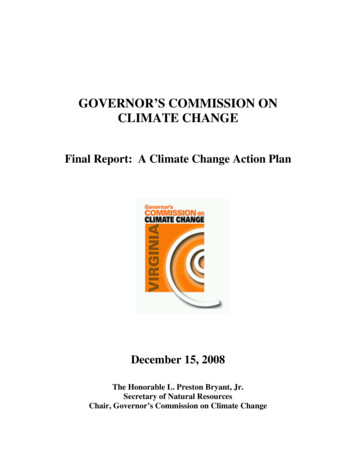
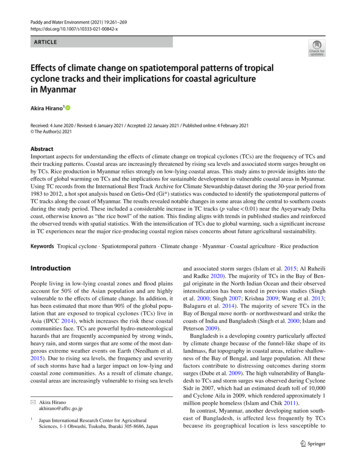
264TC-generated storm surges have not been observed in thisregion. The main rice varieties planted across the deltainclude Paw San and Paw San Yin, which are local varietiesthat have a high market value but are not salt-tolerant andare vulnerable to TC-associated risks such as storm surges(Department of Agriculture Labutta Township 2020). Salttolerant Sin Thwe Latt and Let Yone Gyi varieties are alsoplanted; however, they are not generally favored by localfarmers as their market values are not high (May Toe AungMyint 2020, personal communication, 7 September).Tropical cyclone track datasetThe International Best Track Archive for Climate Stewardship (IBTrACS), which is managed by the National Oceanic and Atmospheric Administration (NOAA) in the UnitedStates of America, is one of the most comprehensive globaldatabases of past TC tracks. In this study, IBTrACS wasused for the visualization of historical cyclone tracks. Themajority of the global TC datasets include quality estimatesof storm positions and intensities at 6 h intervals; these dataare termed “best track” data. In this study, the IBTrACSdataset was used as the primary input for cyclone track computations because it combines track and intensity estimatesfrom numerous international and regional meteorologicalorganizations and provides a centralized platform, includingall factors of global climatology (for review, see Knapp et al.2010). In this study, the latest version of IBTrACS (KnappFig. 2 Historical tropicalcyclone (TC) tracks in the Bayof Bengal (1983–2012): thewhite arrow denotes the typical north- and northwestwardmovement of TCs. Black arrowsrepresent directions of someTCs around the periphery ofthe bay13Paddy and Water Environment (2021) 19:261–269et al. 2018), including best track data through 2018, wasused. Similar to many other global TC track datasets, theIBTrACS comprises data from 1940s onwards. However,because reliable satellite observations became availableafter 1976, only the data generated, thereafter, are generallyconsidered to be suitable for the assessment of interdecadalvariability due to climate change (Reynolds et al. 2002; Kossin et al. 2014).Historical tropical cyclones in the Bay of BengalTo depict the distribution of TCs in the Bay of Bengal, allcyclone tracks during the 30-year period of 1983–2012recorded in the IBTrACS dataset were plotted on a regionalbase map (see Fig. 2). The software ESRI ArcGIS forDesktop 10.6.1 was used for visualization. As mentionedearlier, this 30-year period was chosen in this study becauseit was reported to represent the most prominent global warming period in history (IPCC 2013). For visual comparison,TC tracks during the first and second intervals (1983–1997and 1998–2012, respectively) of the study period were colorcoded differently in blue and dark gray, respectively. Thedistinction was made because the second interval representsa period widely known as the global warming hiatus (IPCC2013). The comparison was made to investigate potentialdifferences in the spatial distribution of TC tracks underdifferent climatic conditions before and during the globalwarming hiatus.
Paddy and Water Environment (2021) 19:261–269Occurrence pattern for tropical cyclone tracksaround Myanmar before and during the globalwarming hiatusTo visually examine the occurrence pattern of TC tracksaround Myanmar, the TC frequency in grid cells in the regionwithin 9 –29 N and 91 –102 E was summarized at a 1 resolution. This region includes Myanmar’s entire territory andsurrounding areas. For comparison, two maps showing thenumber of TCs crossing each 1 grid cell for the two intervalseach (1983–1997 and 1998–2012) were prepared. Again, thesetwo intervals represent the 15 year of rapid temperature riseand the 15 year of global warming hiatus, respectively.Statistical analysis of the occurrence of tropicalcyclone tracks before and during the globalwarming hiatusThe visualization of the number of TCs across the area ofinterest was subject to the employed classification scheme. Toavoid subjectivity, Gi* statistics (Getis and Ord 1992) werecomputed for the two time periods, facilitating the quantitativemeasurement and evaluation of the spatiotemporal aspects ofTCs. Gi* statistics are commonly used for statistical hot spotanalysis and enable the identification of hot and cold spots of adesired feature by comparing the spatial pattern of either highor low values to a spatial pattern created by a theoreticallyrandom chance. In practice, a geographic information system(GIS) calculates the statistic for the observed distribution aswell as the statistic for a random distribution. The extent towhich the observed distribution deviates from the randomdistribution represents the extent to which the pattern is moreclustered or more dispersed than the random distribution. Gi*statistics measure the degree of clustering of high and low values and enable the comparison of patterns over time. Polygonswith 1 grid cells and corresponding data values were usedas input values. These values comprised the numbers of TCsthat crossed a specific grid cell during the two periods. Theprogram ArcGIS was used to compute statistics (p valuesand z scores) and generate color-coded maps of hot and coldspots with different confidence levels. Hot spots (in red) represent clusters of high occurrences of TC tracks, thus, indicatingareas at higher risk of being impacted by TCs. Conversely,cold spots in blue represent the clusters of low occurrencesof TC tracks, indicating areas at lower risk of being impactedby TCs.265Results and discussionHistorical tropical cyclone tracks in the Bayof BengalA total of 154 TCs were observed in the Bay of Bengalduring the 30-year period of this study (1983–2012), ofwhich 75 TCs occurred in the first interval (1983–1997)and 79 TCs in the second interval (1998–2012). Eventhough global warming was likely to have fueled the formation of more TCs, the number of TCs showed negligibleincrease across the study period. This is in agreement withthe findings of Webster et al. (2005), who concluded thatthere was no significant change in the frequency of globaltropical storms and hurricanes from 1970 to 2004, nor anysignificant change in TC numbers for any individual basinincluding the North Indian Ocean over that period. Meanwhile, the same literature indicated a substantial globalincrease in the number of severe TCs (Webster et al. 2005).Most TCs that originated in the Bay of Bengal duringthe 30-year period (1983–2012) moved north or northwestward, and an apparent concentration of TC trackswas observed along the coasts of India and Bangladesh(Fig. 2), which were consistent with those reported bySingh et al. (2001). Based on relevant scientific literature, most damages caused by storm surges, which werethe most destructive consequences of TCs, occurred oncoasts along the paths of the observed TCs (Needham et al.2015).Qualitative analysis of TC tracks can provide a broadcomparison of TC track spatial distribution between the firstand second intervals. Figure 2 shows the TC tracks in thefirst and second intervals (blue and dark gray, respectively),of which qualitatively there are no easily noticeable differences in the spatial pattern. A strand of TC track networkin the Bay of Bengal, both during the first and second intervals, exhibited an apparent concentration along the typicalnorth and northwestward movement; most TCs landed onthe Bangladeshi coastline. Further analysis indicates thatthe blue TC tracks (1983–1997) traveled slightly further intothe continent relative to the gray TC tracks (1998–2012).This tendency may have been caused by the higher surfacewind speed over the Bay of Bengal during the first intervalcompared to that during the second interval as reported inKumar et al. (2016). Surface winds exhibited a weakeningtrend from 1990 onwards, which lowered the latent heat fluxover the basin and thus contributed to the observed longterm increasing trend in SST (Kumar et al. 2016).Compared to the Bangladeshi and northern Myanmarcoastlines above 20 N (33 TCs), a low TC occurrence(16 TCs) was observed along coastlines south of 20 N,accounting for most of the coastal zones in Myanmar.13
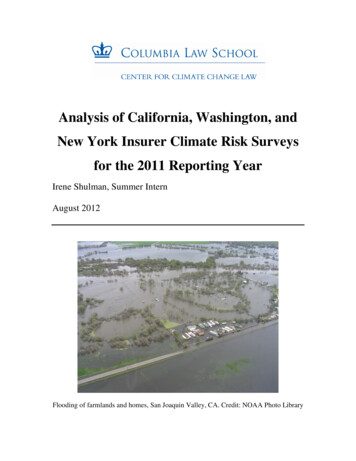
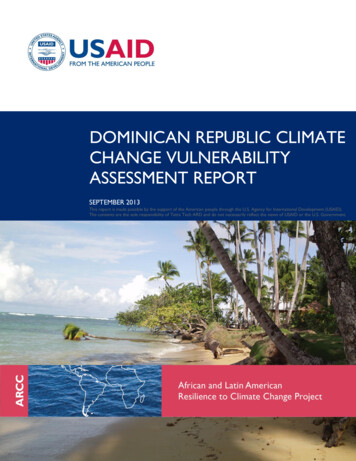
266Paddy and Water Environment (2021) 19:261–269Spatial distribution and occurrence of tropicalcyclone tracks around MyanmarA visual comparison of the maps showing the number ofTCs crossing each 1 grid cell from 1983 to 1997 and from1998 to 2012 revealed a decrease in TC occurrences aroundthe border of Myanmar and Bangladesh with time (Fig. 3).Another region, approximately 700 km off the southerncoastline of Myanmar, exhibited an abrupt decline in TCfrequency. Moreover, a region in northern Thailand thatexhibited a gradual decline in TC frequency in the secondinterval was observed, which reflects the decrease in TCtracks moving further into the continent in the second interval relative to the first interval as mentioned in the previoussection. However, in general, no more than three TCs wereobserved throughout the study area during each 15-yearinterval. Thus, making an objective interpretation of significant changes in the spatial patterns only by qualitative visualinspection of the numbers of TC occurrences was difficult,which called for a formal statistical evaluation.Statistical analysis of the spatial distributionand occurrence of tropical cyclone tracks over timeGi* statistics with a 99% confidence interval revealed significant hot and cold spots (Fig. 4). They were used to measurepatterns by comparing the actual and hypothetical randomdistribution of the same numbers of observed cyclones in thesame area. The distribution of the hot and cold spots sharesa similar pattern to that of the TC occurrences during thetwo intervals. However, several localities exhibited notabledifferences in the hot and cold spots.The second interval exhibited a hot spot with significantincrease compared to the first interval (p value 0.01) inthe area near the Ayeyarwady Delta coast, which is locatedbelow 20 N latitude, changing from “not significant” to “ahot spot with 99% confidence” (Fig. 4). Since Gi* statisticsare not subjective, this change indicates an actual increase inthe vulnerability to TC-derived disasters like storm surges.The southern tip of the Myanmar coast, which is alsolocated below 20 N latitude, exhibited a hot spot (pvalue 0.01) in the second interval with the degree of TCclustering of high values changing from “not significant” to“hot spot with 99% confidence” (Fig. 4). This also indicatesincreased TC tracks in the second interval. Critically, themajority of such TC tracks in this locality can be attributedto storms approaching from the east, which means that theycrossed the Thai–Malay peninsula and thereby had a lowerrisk of storm surge induction (see the black arrows in Fig. 2).The northern Myanmar coastal area bordering Bangladesh, which is located above 20 N latitude, exhibitedclusters of high values at a similar confidence level (pvalue 0.01) (Fig. 4), indicative of no change in spatial13Fig. 3 Spatial distribution of tropical cyclone tracks at a 1 resolution around Myanmar before and during the global warming hiatus: a1983–1997 (before) and b 1998–2012 (during)patterns between the two time intervals. Hence, the vulnerability of the northern Myanmar coastal areas to TC-associated disasters across both intervals was significantly highover the period.The area in southern China adjacent to the northerntip of Myanmar, which is located above 20 N latitude,
Paddy and Water Environment (2021) 19:261–269267TC-associated risks; however, no rice-producing areas inMyanmar exist near that vicinity.Changes to likelihood of tropical cyclone impacton Myanmar coastal agricultureFig. 4 Spatial distribution of hot and cold spots of tropical cyclonetracks at a 1 resolution around Myanmar before and during theglobal warming hiatus: a 1983–1997 (before) and b 1998–2012 (during)exhibited a change from “cold spot with 99% confidence” (p value 0.01) to “not significant” between thetwo intervals (Fig. 4), which indicates a slight increase inThe hypothesis of this study is that there were some localitiesthat exhibited a statistically significant increase or decreasein the probability of being impacted by TCs from the first tosecond interval, a time period (1983–2012) marked as thewarmest 30-year period in the last 1400 year (IPCC 2013).The statistical assessment of the occurrence of TC tracksover the first and second intervals, from 1983–1997 and1998–2012, indicates that, in general, the central to southern portion of the Myanmar coast exhibited a statisticallysignificant increase in the probability of experiencing TCsduring the second interval. Therefore, the vulnerability ofagriculture to TCs and associated storm surges in this areacan be regarded to have increased. Despite the stagnatingGMST during the global warming hiatus (England et al.2014), TCs increased in the second interval. This can beattributed to the regional climate trend in the Bay of Bengalcharacterized by the continuously increasing SST throughoutthe 30-year period (Kumar et al. 2016). The vulnerability ofthis area to TCs could increase in future because of ongoingregional warming trends and may be further exacerbate asperiods of global warming hiatus punctuate future globalwarming trends (England et al. 2014).Our findings suggest that the Ayeyarwady Delta is anexemplary region of where the vulnerability of rice production increases and future agricultural sustainability is at riskbecause of global warming induced climate change. Thisfinding and the emergence of an extensive hot spot along thecentral to southern Myanmar coast (south of 20 N) duringthe second interval reinforces findings from the MyanmarGovernment (2009), which indicated that TC recurvature inthe Bay of Bengal decreased in latitude from 1947 to 2008.Agriculture in Myanmar, particularly its rice production,is highly dependent on the well-being of its coastal agricultural areas. The increased probability of these coastal areasbeing impacted by TCs reported in this study is in agreementwith the results of other studies in which various numericalstorm surge models for the Bay of Bengal suggested favorable conditions for storm surge development (Jain et al. 2006;Tasnim et al. 2015). While Cyclone Nargis in 2008 was catastrophic (official death toll estimates 146,000; damage estimates US 10 billion [Fritz et al. 2009]), there have beennumerous other less known TCs and storm surges that havehit coastal agricultural areas in Myanmar within the last fewdecades (Dube et al. 2009). With the intensification of TCsdriven by global warming (Webster et al. 2005; Kossin et al.2020), an increased probability of TCs making landfall alongstorm surge-prone coastal areas in Myanmar is a cause for13
268Paddy and Water Environment (2021) 19:261–269concern for the food security and agricultural sustainabilityof Myanmar.assessment of TC-associated risk in each area. In addition, astudy overlaying the distribution of TCs over agriculturallyand economically important areas would also be relevant.ConclusionAcknowledgements This work was part of the “Designing weatherindex insurance of agricultural products to extreme events” project,a subtheme of the “Climate change measures in agricultural systems”research project (2016–2020) undertaken by the Japan InternationalResearch Center for Agricultural Sciences. I would like to express mysincere gratitude to the late Ms. Sachiko Hasegawa, the technical assistant of the project, for preparing some of the geographic informationsystem files for the tropical cyclone tracks used in this study. I amgrateful for Ms. May Toe Aung Myint, Department of Agriculture,Labutta Township, Ayeyarwady Province, Myanmar for providing valuable local information on rice varieties planted in the Delta. I wouldalso like to thank Editage (www.edita ge.com) for their English language editing services. The comments of three reviewers strengthenedthe final manuscript.In this study, the spatiotemporal patterns of TC tracksobtained using 1 grid cells during a 30-year period(1983–2012), reportedly the warmest in history, alongthe Myanmar coast were statistically evaluated to provideinsights into the effects of global warming on the futureagricultural sustainability of Myanmar, particularly alongthe major coastal rice-producing areas. A hot spot analysis based on Gi* statistics on the distribution of TC trackscomparing the first and second 15-year intervals revealeda notable increase in TC experiences near the AyeyarwadyDelta coast, otherwise known as “the rice bowl” of Myanmar. This indicates that future rice production in the country is at high risk to TCs.
Using TC records from the International Best Track Archive for Climate Stewardship dataset during the 30-year period from 1983 to 2012, a hot spot analysis based on Getis-Ord (Gi*) statistics was conducted to identify the spatiotemporal patterns of TC tracks along the coast of Myanmar.