Transcription
Colorado is losing low-costrental housingA CCLP issue brief2022-04-18By Charles Brennan
Colorado Center on Law and PolicyIssue brief: Colorado is losing low-cost rental housingKey findings Between 2010 and 2019, Colorado lost 41.2 percent of rental units with rents under 600. Thishousing would be considered affordable to households earning up to 24,000 in 2019. Thatyear, 23.0 percent of renter households had incomes below 24,000 in Colorado.Low-cost rental housing represented 10.1 percent of Colorado’s rental housing stock in 2019,down from 19.5 percent in 2010.Only 5.9 percent of rental units built in Colorado since 2010 had rents under 600. 66.1 percentof rental units built since then had rents between 1,000 and 1,999.33.4 percent of rental units in rural counties in Colorado had rents under 600 in 2019compared to 9.7 percent of rental units in urban counties. Urban counties accounted for 93.6percent of the net loss in Colorado’s stock of low-cost rental units between 2010 and 2019.While all regions of the state saw net losses of low-cost rental units, the fastest losses wereexperienced in urban Front Range regions. The Denver Metro region alone accounted for 60.0percent of the net loss in low-cost units between 2010 and 2019.Sixteen of Colorado’s 64 counties saw net gains in their stock of low-cost rent housing between2010 and 2019 led by Rio Grande, Archuleta, Moffat, Clear Creek, and Costilla counties. Thesixteen counties saw a net gain of 1,727 units with rents below 600. However, the remaining 48counties saw net losses of 91,099 units.29.9 percent of low-cost rental units were found in multifamily buildings with 3 to 19 units; andmobile homes made up approximately one in ten low-cost rental units in 2019. That same year,39.4 percent of renter-occupied mobile homes had rents under 600, the most of any housingtype.45.2 percent of low-cost renters experienced poverty in 2019, compared to 20.6 percent of allrenters in Colorado. This makes sense given the median income of a renter household living ina low-cost unit was 17,266 in 2019. Despite this, rates of housing cost burden were less amongrenters living in low-cost rental units when compared to the rate of housing cost burden for allrenters.1
Colorado Center on Law and PolicyIssue brief: Colorado is losing low-cost rental housingIntroductionWhile much of the discussion of affordable housing in Colorado focuses on how state and localgovernments can encourage the development of more affordable housing, less attention is paid to ourstate’s existing stock of low-cost rental housing units and how housing policies can encourage thepreservation of rental housing that is already affordable to most renters in the state. With inspirationfrom a blog from Harvard University’s Joint Center for Housing Studies (JCHS) 1 looking at this trendnationally, we examine changes in the stock of low-cost rental units in Colorado between 2010 and2019. We also look at the types of rental housing that were most likely to be low-cost rentals, as well asa select economic characteristics of renters who lived in these housing units in 2019.Here we follow the JCHS’s definition of “low-cost” as rental units that had a monthly contract rent 2below 600. Rents below 600 would be affordable to renter households with annual incomes up to 24,000 in 2019. 3 Approximately 23.0% of Colorado renter households had annual household incomesbelow 24,000 that same year. 4 Using a more familiar metric in affordable housing parlance, 24,000was equivalent to approximately 25.9 percent of area median income (AMI) in the Denver-AuroraLakewood metropolitan area for a household of four and 36.9 percent of AMI for a household of one. 5Table 1 shows the AMI equivalency for households with incomes of 24,000 in Colorado’s othermetropolitan areas. While this is not true across all areas, most households of four earning 24,000would be considered extremely low income (AMI less than 30 percent) according to the U.S.Department of Housing and Urban Development (HUD), while most one-person households would beconsidered very low income (AMI less than 50 percent).1 McCue, Daniel. “As low-cost units become increasingly scarce, low- and moderate-income renters are losingaccess to many neighborhoods.” Joint Center for Housing Studies, Harvard University (February 2022). Accessedfrom enters-are-losing-access on 12 April 2022.2 The U.S. Census Bureau defines contract rent as the rent amount agreed upon by the tenant and propertyowner. This may or may not include the cost of utilities and other fees that tenants are required to pay to theproperty owner or property manager in addition to their rent amount.A monthly rent of 600 would be 30 percent of a monthly income of 2,000, which is equivalent to an annualincome of 24,000. Here we use the standard that households should not spend more than 30 percent of theirincome on housing.34 CCLP analysis of 2019 1-Year American Community Survey microdata obtained from IPUMS USA: Version 11.05 “FY 2019 Income Limits Summary.” Program Parameters and Research Division, U.S. Department of Housingand Urban Development (2019). Accessed 019/select Geography.odn on 12 April 2022.2
Colorado Center on Law and PolicyIssue brief: Colorado is losing low-cost rental housingTable 1: 600 monthly rent as a percentage of area median income, 20194-personAMI 600 Rent asPercent of AMI1-personAMI 600 Rent asPercent of AMIDenver-Aurora-Lakewood 92,80025.9% 65,00036.9%Colorado Springs 81,40029.5% 57,00042.1%Fort Collins 87,20027.5% 61,10039.3%Boulder 113,60021.1% 79,60030.2%Greeley 79,20030.3% 55,50043.2%Pueblo 65,20036.8% 47,70050.3%Grand Junction 69,70034.4% 48,80049.2%Metropolitan AreaThe annual income for a household that could afford a 600 rent (i.e., a household who spends no more than 30% of monthly incomeon rent) would be 24,000 in 2019, regardless of household size.Source: “FY 2019 Income Limits Summary.” Program Parameters and Research Division, U.S. Department of Housing and UrbanDevelopment (2019).A note about the dataThe estimates presented in this issue brief come from both the 1-year and 5-year AmericanCommunity Survey (ACS) from the U.S. Census Bureau. We used 1-year ACS data when doing year-toyear comparisons, since there are no overlaps in the samples. However, the 1-year ACS has a smallersample size than the 5-year ACS, which represents a weighted average value for the 5-year periodsending in 2010 and 2019. Therefore, we refer to 5-year ACS data when making estimates about thecharacteristics of low-cost rental housing, such as the year a unit was built or the unit’s housing type.As a result, the estimates will differ depending on if data from the 1-year or 5-year ACS was used in theanalysis. 6 Finally, we excluded any rental units that did not have a cash rent.To control for the effects of inflation, we adjusted contract rent amounts to 2019 dollars whenanalyzing changes in low-cost rental units at the state level. For example, a 600 rent in 2019 wasequivalent to a 519 rent in 2010 using the All Items Less Shelter CPI for the Denver-Aurora-Lakewoodmetropolitan area. 7 However, due to data limitations, it was not possible to adjust county and regionalrents for inflation when we examined changes in low-cost rental units. 8 In such instances, the 2010estimate of units under 600 includes rental units that may have seen their rents increase above 600due to inflation, not due to landlords raising rents faster than the rise in the cost of living. Despite this6 For more on the differences between the 1-year and 5-year estimates from the American Community Survey,please see: ce/estimates.html.7 Consumer Price Index for the Denver-Aurora-Lakewood area, as measured by the CPI-U. U.S. Bureau of LaborStatistics. Our analysis uses the measure for all items less shelter to measure the change in value of a 600 rentrelative to non-housing items in the CPI. Shelter in the CPI includes both rental housing and housing that isowner-occupied.8 Our analysis for counties and regions relied on the summary tables prepared by the U.S. Census Bureau for theAmerican Community Survey results. As a result, we had to use the rent ranges established by the CensusBureau, which do not adjust for inflation year-to-year.3
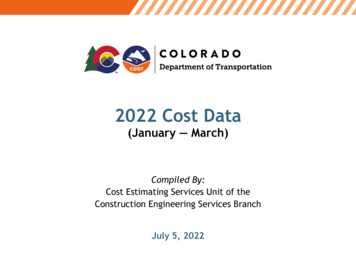
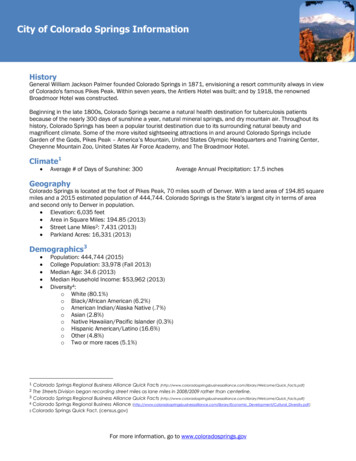
Colorado Center on Law and PolicyIssue brief: Colorado is losing low-cost rental housinglimitation, we still believe the analysis is useful in identifying the communities in Colorado that haveseen the greatest loss in low-cost rental units since 2010.Low-cost rentals are increasingly hard to findFigure 1: Colorado's rental housing stock, 2010 - 0Low-Cost UnitsAll Other Rental UnitsSource: CCLP analysis of 2010-19 1-Year American Community Survey microdata obtained from IPUMS USA: Version 11.0Between 2010 and 2019, we estimate that Colorado saw a net loss 9 of 51,866 low-cost rental units. 10 Thisrepresents a 41.2 percent decline in our state’s stock of low-cost rental housing since 2010. Over thissame period, Colorado saw a 13.9 percent net increase in the total number of rental housing units.Looking at low-cost housing as a share of all rental housing in the state, we estimate that 19.5 percentof Colorado’s rental housing had contract rents below 600 in 2010. This share shrunk to 10.1 percentof rental housing units in 2019, a decline of 9.4 percentage points. 11 Although the JCHS blog authorused a different period for his analysis, he found that Colorado experienced the greatest loss of lowcost rental housing of any state in the country between 2011 and 2019. 12New construction has not replaced lost low-cost rental unitsThe issue does not appear to be that Colorado communities are not creating new rental housing.Instead, the issue appears to be a loss of existing units combined with the lack of construction of low-9 There are a number of ways in which a low-cost unit might have been “lost” over this period including, but notlimited to: the landlord raised the rent above 600 (or it’s inflation-adjusted equivalent); the rental unit wasdestroyed or redeveloped; the unit switched from being renter-occupied to owner-occupied; or the rental isbeing used unit as a short-term rental. This is certainly not an exhaustive list.10 CCLP analysis of 2010-2019 1-Year American Community Survey microdata obtained from IPUMS USA:Version 11.011 CCLP analysis of 2010 and 2019 1-Year American Community Survey microdata obtained from IPUMS USA:Version 11.012 The JCHS blog used a national measure of inflation to adjust for cost of living instead of one more specific toColorado.4
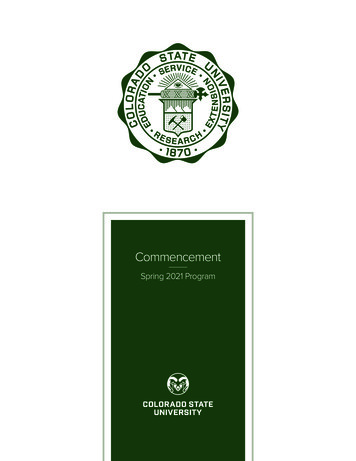
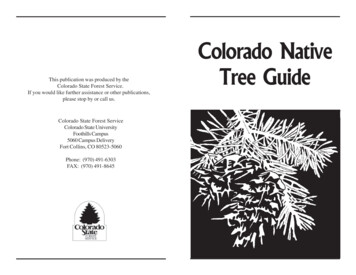
Colorado Center on Law and PolicyIssue brief: Colorado is losing low-cost rental housingcost rental units to take their place. Even if all the existing low-cost rental units in the state remainedlow-cost in the future, we would still need more units to replace the units we have lost since 2010.Figure 2: Rental units built since 2010 by 020102011Under 60020122013 600 to 999201420152016 1,000 to 1,99920172018201966.1% 2,000 or moreSource: CCLP analysis of 2010-19 1-Year American Community Survey microdata obtained from IPUMS USA: Version 11.0We estimate that just 5.9 percent of the rental units built in Colorado since 2010 were low-cost units. 13On the other hand 66.1 percent of the rental units built over this period had monthly contract rentsbetween 1,000 and 1,999 in 2019. Similarly, 3.9 percent of the low-cost rental units in Colorado in2019 were built after 2010 compared to 9.9 percent and 16.2 percent of units with contract rentsbetween 1,000 and 1,999 and 2,000 and up, respectively.This analysis suggests that the private housing market has been unable or unwilling to producehousing units with monthly rents that are affordable to close to one-in-four renter households inColorado over the past decade. This trend may change as Colorado allocates and spends the funds foraffordable housing the state received through the American Rescue Plan Act (ARPA), not to mentionthe additional funds allocated by the General Assembly to affordable housing during the years justprior to the pandemic.However, because the funds are currently proposed to support affordable housing projects servingrenter households with incomes as high as 170 percent of AMI, depending on the program andcounty, 14 we may continue to see production of rental housing that is out of reach for households that13 CCLP analysis of 5-Year American Community Survey microdata obtained from IPUMS USA: Version 11.0.The U.S. Census Bureau does not collect data on whether rental housing units are under some sort of rentrestriction or receive some sort of rental subsidy, such as through the Low-Income Housing Tax Credit programor the Housing Choice Voucher program. We cannot know from this data source whether these low-cost unitswere built through a federal, state, or local affordable housing program or through private market forces alone.14 As of the date of publication, SB22-159 would create a revolving loan fund in the Division of Housing (DOH) inthe Department of Local Affairs (DOLA) to fund projects serving renter households earning up to 120 percent ofAMI in their local community. This AMI limit can go up to 140 percent of AMI in rural resort counties. HB22-1304would create the Transformational Affordable Housing Grant Program and the Infrastructure and StrongCommunities Grant Program in the Division of Housing and the Division of Local Governments (DLG),5
Colorado Center on Law and PolicyIssue brief: Colorado is losing low-cost rental housingcan only afford to live in housing with rents under 600. Depending on the metropolitan area andhousehold size, units with rents of 1,000 or higher could be below the 80 percent of AMI ceilingproposed for urban counties in the Transformational Affordable Housing Grant Program which wouldbe created through HB22-1304, currently under consideration by our state legislature. In other words,ARPA funds could be used to subsidize private development of units that the market appears to havehad no trouble producing on its own over the past decade. 15 That said, ARPA funds will also beavailable to preserve and rehabilitate existing affordable housing units, which could provide muchneeded support towards stemming the loss of low-cost rental units in Colorado in the coming years.Table 2: 1,000 and 1,999 monthly rent as a percentage of area median income, 20194-person HouseholdMetropolitan Area 1,000 Rent asPercent of AMI 1,999 Rent asPercent of AMI1-person Household 1,000 Rent asPercent of AMI 1,999 Rent asPercent of rado Springs49.1%98.2%70.2%140.3%Fort 6%83.9%167.6%Grand Junction57.4%114.7%82.0%163.9%The annual income for a household that could afford a 1,000 rent or a 1,999 rent (i.e., a household who spends no more than 30%of monthly income on rent) would be 40,000 and 79,960 in 2019, respectively.Source: “FY 2019 Income Limits Summary”, Program Parameters and Research Division, U.S. Department of Housing and UrbanDevelopment (2019).How our 400 million in ARPA funds for affordable housing will be used remains to be seen. However,we believe this analysis indicates that there needs to be a greater emphasis on the preservation andproduction of units that are affordable to households below 50 percent or even 30 percent of AMI. Asthe Department of Local Affairs creates additional evaluation guidelines for how it awards grants andloans through these new programs, we hope that priority will be given to projects serving renters atthe lower ends of the proposed AMI limits so that Colorado can reverse its loss of low-cost rental units.respectively, both in DOLA. Both programs created by HB22-1304 would target renter households earning 80percent of AMI in urban counties, 140 percent of AMI in rural counties, and 170 percent of AMI in rural resortcounties. Note that the definitions of urban, rural, and rural resort counties are yet to be established and may ormay not reflect the definitions of urban and rural we used in this issue brief. The AMI limits proposed in bothbills may change as the bills work their way through the legislature.15 While it is likely that some rental units with rents between 1,000 and 1,999 were built with subsidies fromfederal, state and/or local affordable housing programs, it does not seem likely that two-thirds of the rental unitsbuilt in Colorado since 2010 received some sort of financial subsidy.6
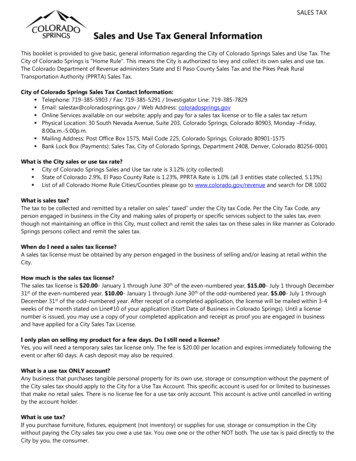
Colorado Center on Law and PolicyIssue brief: Colorado is losing low-cost rental housingSince most of the funds will be spent at the local level, it is worth taking a deeper dive into our state’sloss of low-cost rental units since 2010 by looking at changes in low-cost units in various parts ofColorado.Urban Counties Saw Greater Losses than Rural CountiesDespite accounting for 17.6 percent of the state’s low-cost rental housing in 2010, 45.1 percent of rentalhousing in rural counties had contract rents under 600 compared to 27.8 percent of rental units inurban counties. 16 Similarly, rural counties saw a slower decline in low-cost rental housing between2010 and 2019 than urban counties. Over that period, urban counties saw their number of low-costunits decrease by 57.1 percent, faster than the rate for the state. On the other hand, rural counties sawtheir number of low-cost units decline by 18.2 percent. Between 2010 and 2019, 93.6 percent of thelow-cost units lost in Colorado were in urban counties. 17 As a result, rural counties maintained agreater share of low-cost rental units in 2019 even with the losses experienced. That year just 9.7percent of rental units in urban counties were low-cost units compared to 33.4 percent of units in ruralcounties.Figure 3: Low-cost units as share of renter-occupied 5.0%0.0%45.1%33.4%27.8%9.7%20102019Urban CountiesRural CountiesUrban counties are defined as counties that were part of a metropolitan statistical area (MSA) in Colorado in 2019, as defined by theU.S. Office of Management and Budget. Rural counties are defined as counties that were not part of a metropolitan statistical area.These estimates were not adjusted for inflation.Source: 2006-10 and 2015-19 5-year American Community Survey, U.S. Census Bureau.Looking at regional trends across the state allows us to understand with greater detail where Coloradohas lost the greatest amount of low-cost rental units. All regions 18 of the state lost low-cost rental unitsbetween 2010 and 2019.16 2006-10 5-Year American Community Survey, U.S. Census Bureau.17 2015-2019 5-Year American Community Survey, U.S. Census Bureau.18 The regions used in this issue brief are based on the Colorado Workforce Development regions andsubregions.7
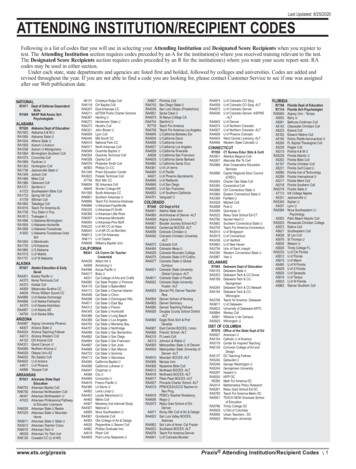
Colorado Center on Law and PolicyIssue brief: Colorado is losing low-cost rental housingFigure 4: Regional Percent Change in Low-Cost Rental Units, 2010-19These estimates were not adjusted for inflation.Source: 2006-10 and 2015-19 5-year American Community Survey, U.S. Census Bureau.The Denver Metro region accounted for 60.0 percent of the low-cost units lost over this period,followed by the Pikes Peak region (17.6 percent) and the North Front Range region (11.7 percent). 19This finding is not too surprising when we consider that these regions have seen some of the greatestpopulation growth in our state. These three regions also saw the largest rate of loss of low-cost units—each lost over half of the low-cost rental units they had in 2010 by 2019. Outside of the Front Range, theRural Resort (33.5 percent), Mesa (31.1 percent) and Eastern (31.0 percent) regions all lost close to onethird of their low-cost units. Despite accounting for just 5.5 percent of lost low-cost units statewide, thelosses experienced in these regions since 2010 represent a significant loss of the low-cost rentalhousing stock in those communities.19 CCLP analysis of 2006-10 and 2015-19 5-Year American Community Survey data, U.S. Census Bureau.8
Colorado Center on Law and PolicyIssue brief: Colorado is losing low-cost rental housingFigure 5: Share of low-cost rental units lost by region, 2010-192.5%60.0%17.6%11.7%2.0%2.4%Metro DenverPikes PeakNorth Front RangeEasternPuebloMesaRural ResortSoutheastWesternSouthwestUpper ArkansasSouth-CentralNorthwestThese estimates were not adjusted for inflation.Source: 2006-10 and 2015-19 5-year American Community Survey, U.S. Census Bureau.Two regions of our state saw a slight change in low-cost rental units between 2010 and 2019—theNorthwest and South-Central regions. These two parts of the state experienced a 2.5 percent and 1.5percent decline in low-cost units over this period, respectively. 20 As a result, these regions collectivelynearly doubled their share of the state’s low-cost rental units from 2.9 percent of all low-cost units in2010 to 5.7 percent of low-cost rental units in 2019. Despite seeing the slowest percent change in lowcost units, the South-Central region experienced one of the greatest percentage point swings in theshare of regional rental housing that is made up by low-cost units. In 2010, 83.0 percent of the rentalunits in the region had rents under 600. By 2019, this share dropped 23.1 percentage points to 59.9percent of the rental stock. A combination of a slight loss of low-cost rental units combined with thelargest percent increase in rental housing of any region in the state resulted in this large swing in theshare of rental units with rents below 600 in the South-Central region.20102019These estimates were not adjusted for inflation.Source: 2006-10 and 2015-19 5-year American Community Survey, U.S. Census Bureau.20 CCLP analysis of 2006-10 and 2015-19 5-Year American Community Survey data, U.S. Census %50.0%40.0%30.0%20.0%10.0%0.0%75.8%Figure 6: Low-cost rental units as a share of total renter-occupied units, by region
Colorado Center on Law and PolicyIssue brief: Colorado is losing low-cost rental housingIndeed, we gain even more insight into regional trends when we look at the gains and losses of lowcost rental units experienced by counties. For example, one reason the South-Central region did notsee as fast a decrease in low-cost rental units as other regions is because the 677 units lost in Saguache,Alamosa, and Conejos counties were offset by an increase of 624 low-cost rental units in Mineral, RioGrande, and Costilla counties. 21 A similar trend is at play in the Northwest region.Figure 7: Percentage change in low-cost rental housing, 2010-19These estimates were not adjusted for inflation.Source: 2006-10 and 2015-19 5-year American Community Survey, U.S. Census Bureau.Looking just at county-level net gains and losses, we see that between 2010 and 2019 16 of Colorado’s64 counties saw a net increase in their supply of low-cost rental units. Rio Grande County led the waywith an increase of 506 units, followed by Archuleta, Moffat, Clear Creek, and Costilla counties.Because some of these counties did not start 2010 with many low-cost rental units, even this modestincrease in units resulted in a sizable percentage increase. In total, the counties that added units saw anet increase of 1,727 low-cost rental housing units. This number is tiny in comparison to the countiesthat saw a net loss of low-cost units. Collectively these counties saw a net loss of 91,099 units between2010 and 2019. 2221 2006-10 and 2015-19 5-Year American Community Survey data, U.S. Census Bureau.22 2006-10 and 2015-19 5-Year American Community Survey data, U.S. Census Bureau.10
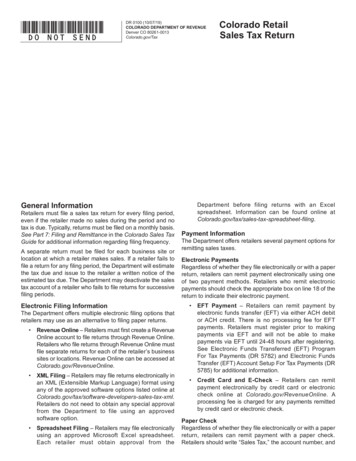
Colorado Center on Law and PolicyIssue brief: Colorado is losing low-cost rental housingFifteen of the state’s 64 counties lost more than half of their low-cost rental units between 2010 and2019. Gilpin County led the way with a 90.9 percent decline in units with rents under 600, followed byEagle, San Juan, Arapahoe, and Broomfield counties. Three of these counties were in the DenverMetro region, accounting for 26.1 percent of the units lost in that region since 2010. 23While a regional- and county-level look at the state’s change in low-cost rental units is useful inunderstanding which areas of our state fared better or worse in terms of lost units, we cannot forgetthat certain parts of our state provide greater economic opportunities than others. For example, 87.8percent of Colorado’s jobs were in urban counties in 2018, up from 85.8 percent in 2008 prior to theGreat Recession. 24 The fact that the Front Range regions of our state experienced the greatest loss oflow-cost units since 2010 suggests that there is a connection between areas of our state that aregrowing economically and the loss of affordable housing. That said, we should not neglect the housingneeds of rural Coloradans. Plenty of rural counties also saw losses to their stock of low-cost rentalhousing over this period.Profile of Low-Cost Rental Units & RentersWhile we have dedicated the first half of this issue brief to documenting the changes in Colorado’ssupply of low-cost rental housing, it is useful to understand more about the characteristics of low-costrental units in our state and the economic characteristics of renters who live in low-cost unit. Low-costrenters living in low-cost units in 2019 will be impacted by future losses of low-cost rental housing. Asour analysis shows, these households likely depend on the relative affordability of low-cost units tomake ends meet and cover their household’s basic needs.Small Multifamily Buildings and Mobile Homes Are Critical Low-Cost Housing TypesIn 2019, 29.4 percent of Colorado’s low-cost rental housing stock was made up of units in multifamilybuildings containing 3 to 19 units. 25 Single-family homes and multifamily buildings with 50 or moreunits accounted for 22.6 percent and 18.1 percent of our low-cost rental housing stock, respectively.Together, these three housing types made up 70.1 percent of all low-cost rental units in the state.While there were some shifts, these three types also made-up a similar 68.2 percent of all low-costrental housing in 2010.23 2006-10 and 2015-19 5-Year American Community Survey data, U.S. Census Bureau.24 Brennan, Charles and Lauren Contorno. State of Working Colorado. Colorado Center on Law and Policy (2020).Accessed from SWCO Final 122820 SM.pdf on 12 April 2022.25 CCLP analysis of 2015-19 5-Year American Community Survey microdata obtained from IPUMS USA: Version11.011
Colorado Center on Law and PolicyIssue brief: Colorado is losing low-cost rental housingFigure 8: Renter-occupied housing units by gle-FamilyDuplex/2 units3 to 19-unit multifamily building20 to 49-unitmulti-familybuilding50 or more-unitmulti-familybuilding2010 Low-cost rental units2010 all renter-occupied units2019 Low-cost rental units2019 all renter-occupied unitsMobile HomesSource: CCLP analysis of 2006-10 and 2015-19 5-Year American Community Survey microdata obtained from IPUMS USA: Version 11.0Low-cost rental units in multifamily buildings with 3 to 19 units accounted for 45.8 percent of the lowcost rental units lost in Colorado between 2010 and 2019. 26 Mobile homes accounted for the smallestshare of lost units over this period. In 2019, this housing type represented 10.1 percent of low-costrental units in Colorado, up from 7.7 percent of units in 2010. This is a positive trend since 39.4 percentof renter-occupied mobile homes in the state had rents under 600, the highest share of any housingtype in 2019. Despite making up a large share of low-cost rental units, just 10.9 percent of all rentalunits in multifamily buildings with 3 to 19 units had rents below 600. This is 7.9 percentage points lessthan in 2010.26 CCLP analysis of 2006-10 and 2015-19 5-Year American Community Survey microdata obtained from IPUMSUSA: Version 11.012
Colorado Center on Law and PolicyIssue brief: Colorado is losing low-cost rental housingFigure: 9: Share of rental housing that is low-cost, by housing type35.0%30.0%Single-Family Duplex/2 units3 to 0.0%20 to 49-unit 50 or more-unit Mobile 2.0%40.0%19.3%45.6%45.0%39.4%50.0%All HousingTypes2019Source: CCLP analysis of 2006-10 and 2015-19 5-Year American Community Survey microdata obtained from IPUMS USA: Version 11.0Geography is important in this conversation, as the housing types most likely to make up low-costrental units differ depending on where in the state we are looking at. For example, the most prevalentlow-cost rental housing type in the Denver-Aurora-Lakewood metropolitan area in 2019 weremultifamily buildings with 50 or more units, not buildings with 3 to 19 units as is the case when welook at the state as a whole. 27 Similarly, single-family homes and mobiles homes made up a smallershare of the Denver metropolitan area’s low-cost housing compared to the state. While 22.6 percent oflow-cost units in Colorado were single-family homes in 2019, this housing type made up just 14.1percent of Denver’s low-cost rental housing.Similarly, in non-metropolitan rural counties in Colorado, 31.6 percent of the low-cost rental housings
Between 2010 and 2019, Colorado lost 41.2 percent of rental units with rents under 600. This housing would be considered affordable to households earning up to 24,000 in 2019. That Low-cost rental housing represented 10.1 percent of Colorado's rental housing stock in 2019, down from 19.5 percent in 2010.