Transcription
Suffolk County Vector Control and Wetlands Management Long-Term PlanDraft Generic Environmental Impact Statement3May 3, 2006Suffolk County Background Information3.1.General Physical DataThe geographical extent of this DGEIS is all of Suffolk County. This includes the Orient PointMosquito Control District, although the County has no responsibility for vector control activitiesthere, and FINS, where NPS and the County are still determining the exact scope of mosquitocontrol to be conducted. The concepts, approaches, choices, and conclusions made for the rest ofthe County appear to be applicable in these two areas. The County believes that the Orient PointDistrict might wish to avail itself of the work conducted as part of this project, and considerrevamping its approach to vector control. Similarly, although NPS has special restrictionsregarding its ability to manage natural processes, the general conclusions regarding impactsassociated with potential means of mosquito control drawn for the rest of the County will applyon the barrier beach and William Floyd Estate, as well.Certain areas were used to determine the effects of the proposed action. This focused approachallowed for stronger conclusions to be drawn regarding potential impacts. The potential impactsand mitigations of those impacts were expanded to a County-wide extent as part of the impactassessment; nonetheless, most of the effort associated with the project was expended on the four“risk assessment” areas, the 21 “primary study” areas, and at the OMWM demonstration site atWertheim National Wildlife Refuge. The effects described for these sites were assumed to betransferable to the remainder of the County.This section briefly describes environmental and demographic attributes of the County as awhole. The pertinent aspects of the 26 study sites are described in Section 4 and Section 5,below, and the discussion of wetlands was particularly expanded in Section 5.3.1.1. Long Island GeographyLong Island consists of unconsolidated sediments lying above the bedrock platform.Theunconsolidated materials were laid down over essentially three time periods. Two basal layerswere deposited in the Cretaceous Era (60 to 100 million years ago). These sediments consistprimarily of sands and clays eroded and deposited along a continental margin. Beginning at anelevation of approximately 100 feet below mean sea level (msl), sands, gravels, clays and tillsCashin Associates, PC261
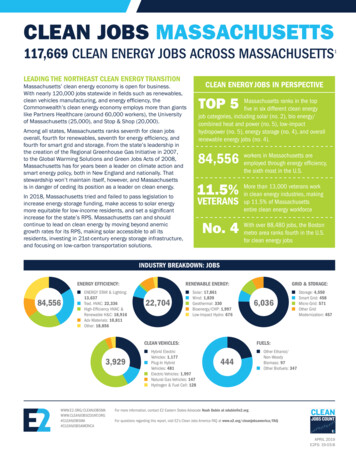
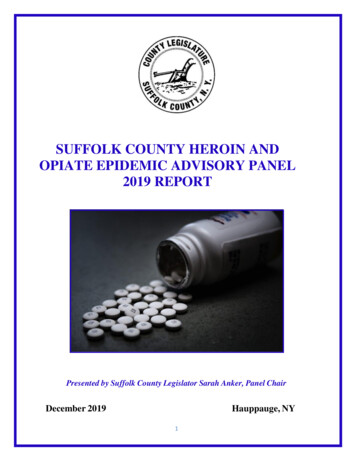
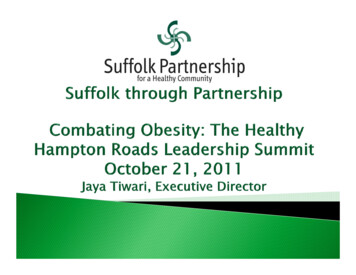
Suffolk County Vector Control and Wetlands Management Long-Term PlanDraft Generic Environmental Impact StatementMay 3, 2006were deposited by the Pleistocene glaciations unconformably over the older materials (Nemickaset al., 1989).Surface features on Long Island were demonstrably shaped by glacial forces, although the exactmechanisms that formed the overall topography are in dispute. One well-regarded theory is thatthe southern-most line of hills across Long Island marks a terminal moraine associated with thelast (Wisconsinan) continental glacial advance and retreat (Sirkin, 1980). The glaciers arrived atLong Island less than 25,000 years ago, and left approximately 20,000 years ago (some dates areas late as 18,000 years ago, and some are as early as 22,000 years ago) (Schaefer et al., 2005).The terminal moraine associated with the Wisconsinan glacier is commonly referred to as theRonkonkoma moraine, and in Suffolk County it extends from West Hills Park in Huntington,southeasterly through Ronkonkoma, Manorville, Southampton and out to Montauk Point. Thenorthern moraine, along the Long Island Sound shore line out through Plum Island and FishersIsland, is called the Harbor Hill moraine, and is thought to have been created as a recessionalmoraine after the Ronkonkoma moraine. There are at least two interlobate features (West Hillsand Dix Hills), and other recessional moraines have been described along the north shore of theSouth Fork, and forming the islands found in the Peconic Bay system (Robins Island, ShelterIsland, and Gardiners Island) (Sirkin, 1980). Use of a Digital Elevation Model (DEM) to assesssmall changes in elevation by researchers such as Bennington (Hofstra University) and Hanson(Stony Brook University) have resulted in some rethinking of the standard model. A DEM ofSuffolk County is shown in Figure 3-1. Interpretation of the DEM suggests that multipleadvances of the glacier from different directions may have been the cause of many of themoraines, and that the Ronkonkoma moraine appears to be much older than the more northernmoraines (as they appear to overlie it).Cashin Associates, PC262
Suffolk County Vector Control and Wetlands Management Long-Term PlanDraft Generic Environmental Impact StatementMay 3, 2006Cashin Associates, PC263
Suffolk County Vector Control and Wetlands Management Long-Term PlanDraft Generic Environmental Impact StatementMay 3, 2006The areas between the moraines are largely composed of outwash sands and gravels, as is theportion of the Island south of the Ronkonkoma moraine. Outwash also tends to lie under themoraines themselves (Nemickas et al., 1989).Long Island is approximately 120 miles long, and is 26 miles wide, at its widest point. A notablefeature are the two narrow forks extending east from the main portion of the Island, creating thefamiliar fish shape that led Walt Whitman to call the area Paumonok.The north shore,especially in western Suffolk County and farther west into Nassau County, is incised with northsouth trending harbors and bays. The south shore tends to be more regular, although a series ofsmall, unbranched, north-south stream systems cuts across the outwash and creates small coastalcrannies at the shoreline.South of the Island proper lies a series of barrier beaches; the mechanisms that form suchsystems are obscure, with the prevalent notion being that they are controlled by rising sea levels,and so have been moving shoreward with increasing sea level over at least the past 5,000 years.Sea level was approximately 100 to 200 feet lower during the glacial period, and so was foundfar offshore of the current Long Island shoreline. As the continental glaciers melted, sea levelrose. The rate of sea level rise has slowed considerably, stabilizing at a relatively modest rateapproximately 5,000 years ago. Sea level rises are affected by many factors, including tectonicrebound or depression (continental scale reactions to the change in loadings from the glacialretreat) and other local tectonic effects (such as uplift) and so sea level increases or decreasesneed to be determined locally (Cronin et al., 1981; Dillon and Oldale, 1978). In the New Yorkarea, sea levels continue to rise, and estimates are that half relates to tectonic rebound and half tocontinued continental glacial melt and ocean expansion due to global warming.Generally,therefore, it is thought that, if unstablized, the barrier beaches will continue to retreat towardsmainland Long Island across the South Shore Estuary (Williams and Meisburger, 1987).Long Island’s surrounding waters: Long Island Sound to the north Block Island Sound to the east the Atlantic Ocean to the south the East River tidal strait to the west.Cashin Associates, PC264
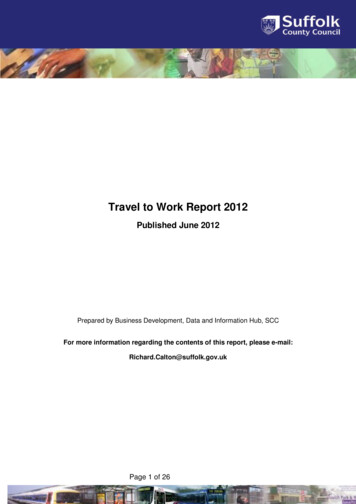
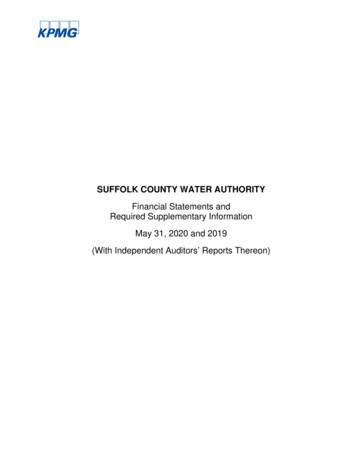
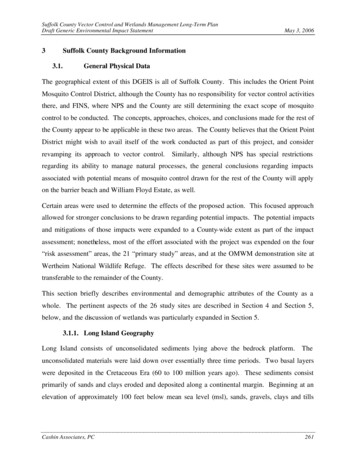
Suffolk County Vector Control and Wetlands Management Long-Term PlanDraft Generic Environmental Impact StatementMay 3, 2006The Peconic Estuary system lies between the North and South Forks of eastern Long Island. TheSouth Shore Estuary system lies between the barrier islands and the south shore of the Island.The important populated islands associated with Long Island include Fire Island off the southshore, Shelter Island in the Peconic Estuary between the two forks, and Fishers Island well northand east of the North Fork. Figure 3-2 illustrates important geographical features of Long Island.Cashin Associates, PC265
Suffolk County Vector Control and Wetlands Management Long-Term PlanDraft Generic Environmental Impact StatementMay 3, 2006Cashin Associates, PC266
Suffolk County Vector Control and Wetlands Management Long-Term PlanDraft Generic Environmental Impact StatementMay 3, 20063.1.2. Suffolk County GeologyPaleozoic bedrock can only be found on the surface of Long Island on its extreme northwesterntip. The bedrock is thought to dip evenly to the southeast, and is overlain by 2,000 feet ofunconsolidated material along the south shore of central Suffolk County (Nemickas et al., 1989).The unconsolidated sediments that underlie Long Island were essentially laid down in threeperiods. Two occurred in the Cretaceous Era. The first formed the Raritan Formation. This iscomposed of several hundred feet of sand with clay lenses (the Lloyd Member), lyingunconformably above the basement bedrock. The Lloyd Member is capped by several hundredfeet of clay (an unnamed formation). The surface of the Raritan Formatio n is found up to athousand feet below msl. It is generally approximately 500 feet thick (Nemickas et al., 1989).The Magothy Formation lies unconformably above the Lloyd Formation. These Cretaceous Erasands and clays (with some gravels) can be found close to the ground surface in some areas ofcentral Nassau County, and along the northwestern shoreline of Suffolk County into westernNassau County, but mostly the surface of this feature lies some 100 feet below msl. The surfaceof the Magothy Formation was eroded in places. It is usually 400 to 500 feet thick (Nemickas etal., 1989).Several hundred feet of Pleistocene deposits lie above the Magothy formation unconformably, orelse these sediments lie unconformably above other, older, usually Pleistocene, clay layers. ThePleistocene deposits are almost all outwash; tills and boulders mark morainal deposits. Holocenedeposits of beaches, surface soils, marsh sediments, etc., lie above the glacial deposits (Nemickaset al., 1989). Maximum elevations on Long Island are found in West Hills, and cap out at 400feet or so. Most of the south shore outwash plain is less than 50 feet above msl. Steep slopes arerare on the south shore, but are not uncommon on the hillier north shore, or on the two forks.Long Island soils tend to be well-drained, although some poorer draining soils can be foundassociated with the moraines. The north shore is dominated by deep, well-drained, moderatelycoarse soils that formed in a mantle of sandy loam. Beaches along Long Island Sound containgravel and cobble. In contrast, the beaches bordering the Atlantic Ocean are composed of sandand sand dunes, as they are composed of outwash materials from the glacier. Similarly, beachesalong the Peconic Estuary tend to be sandy to the north and rockier on the south – again, relatingto outwash/morainal material differences – although the distinction is not as clear cut as thatCashin Associates, PC267
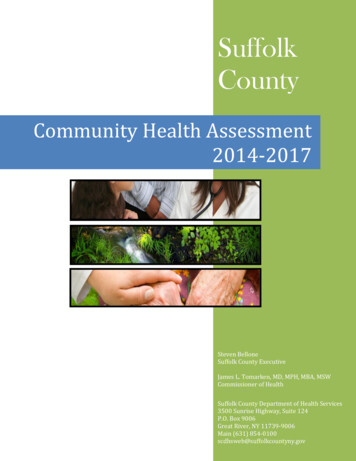
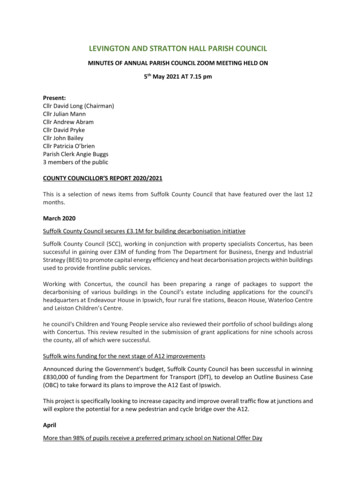
Suffolk County Vector Control and Wetlands Management Long-Term PlanDraft Generic Environmental Impact StatementMay 3, 2006between Long Island Sound and ocean beaches. Beaches furthest to the east on the ocean can besomewhat rockier or gravelly, due to erosion of materials from Montauk Point and othershoreline headlands. Soils south of the moraines tend to be much sandier and to be exceptionallywell-drained. Figure 3-3 shows the general distribution of soil types on Long Island (Warner etal., 1975).Table 3-1. Major Soil Types in Suffolk CountySOIL TYPESBeachesBridgehamptonCarverDune LandEscarp SudburyUdipsammetsUdorthentsUrban LandSOIL QUALITIESBeaches are made up of sandy, gravelly, or cobbly areas between water at means sea level anddunes or escarpments.Deep well drained to moderately well drained, medium textured soils that formed in thick siltydeposits over coarse sand and gravelDeep, excessively drained coarse textured soilsMounds or small hills of sand that have been piled up by the windBluffs that have slopes greater than 35 percentDeep, well drained, medium textured soils that have formed over stratified coarse sand and gravelVery deep, very poorly drained soils formed in partially decomposed organic material fro m salttolerant herbaceous plants.Deep, well drained to moderately well drained, moderately coarse textured to medium texturedsoils that formed in fine sandy loam or in a mantle of silt loam and loamVery deep, very poorly drained soils formed in partially decomposed organic material from salttolerant herbaceous plantsDeep, excessively drained, coarse textured that formed in a mantle of loamy sandor sand over stratified coarse sand and gravelDeep, well drained, moderately coarse textured soils that formed in a mantle of sandy loam or finesandy loam over thick layers of coarse sand and gravelDeep, moderately well drained, moderately coarse textured soils that formed in a mantle of finesandy loam or sandy loam over coarse sand and gravelVery deep, excessively drained to moderately well drained acid soilsVery deep, excessively drained acid soils in areas of sanitary landfillsAreas that are more than 80 percent covered by buildings and pavementsCashin Associates, PC268
Suffolk County Vector Control and Wetlands Management Long-Term PlanDraft Generic Environmental Impact StatementMay 3, 2006Cashin Associates, PC269
Suffolk County Vector Control and Wetlands Management Long-Term PlanDraft Generic Environmental Impact StatementMay 3, 20063.1.3. Geohydrology of Suffolk CountyAll of Nassau and Suffolk Counties’ water systems obtain water from groundwater. This makesthe Long Island aquifer system a sole source aquifer, as defined by USEPA (Nemickas et al.,1989).This fact has driven much of local governments’ environmental concerns and rule-making, as protection of the drinking water supply has been shown to be a function of land useand general environmental protection (Koppelman, 1978; Eckhardt and Stackelberg, 1995).The elevation of the water table tends to follow the overall topography of the ground surface.Highest water elevations tend to be found beneath the central Ronkonkoma moraine, whichtherefore establishes a ground water divide. That is, horizontal water flow tends to be to thenorth northwards of the Ronkonkoma moraine, and to the south southwards of the moraine(Buxton and Modica, 1992). The groundwater beneath the island forms a fresh water lens. Thelens is generally bounded by salt water interfaces with the Long Island Sound to the north, andthe South Shore Estuary-Atlantic Ocean complex to the south, and by bedrock below.Inessence, on the North Fork the salt water interfaces are with the Sound to the north and thePeconic Estuary to the south; salt water lies above the bedrock, and bounds the fresh water lensfrom below. The South Fork fresh water groundwater system is essentially similar. Surfacewater on Long Island occurs where the water table of the groundwater system intersects theground surface (Nemickas et al., 1989).Approximately 50 percent of the precipitation reaching the ground surface in Suffolk County (onthe order of 24 inches a year) recharges one of three aquifers: the Upper Glacial, which is the water table aquifer in Suffolk County the Magothy aquifer, which underlies the Upper Glacial aquifer, and which tends to beconfined, especially to the south the Lloyd aquifer, which is beneath the Magothy aquifer, and extends to bedrock. TheLloyd aquifer is confined.Modeling of the groundwater system has determined that approximately 60 percent of rechargeremains within the Upper Glacial aquifer. The horizontal movement of water within the aquifersranges from a maximum of one to one and a half feet per day (300 to 500 feet per year) to inchesper year. The rate is determined by the nature of the material the water is flowing through, andCashin Associates, PC270
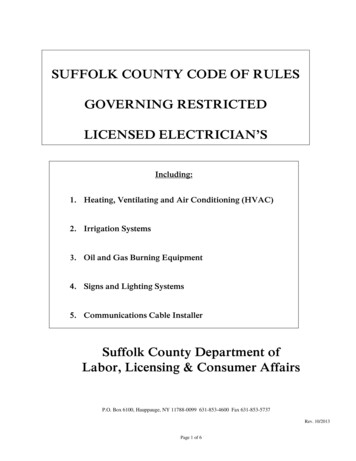
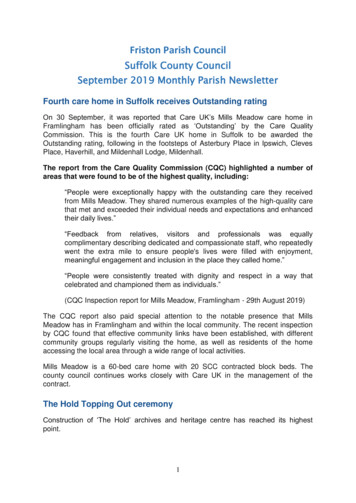
Suffolk County Vector Control and Wetlands Management Long-Term PlanDraft Generic Environmental Impact StatementMay 3, 2006the pressure (head) on the water. The water that is retained within the Upper Glacial aquiferdischarges to streams, at the shoreline, or generally within a hundred feet or so of the shoreline atthe salt water interface. Some 40 percent of recharge moves vertically through the Upper Glacialaquifer into the deeper two aquifers. This happens in the central portion of Long Island. Thearea where this tends to occur is called the Deep Recharge zones (Buxton and Modica, 1992).These zones are of special environmental concern, because recent land use has generally hadnegative impacts on the water quality of the Upper Glacial aquifer (Koppelman, 1978). Becausewater in the deeper aquifers flows more slowly, it is older, and so generally has better waterquality.A Long Island environmental principle is that protecting the quality of the waterrecharging to the deeper two aquifers will ensure there is an adequate supply of good qualitywater for future use (Koppelman, 1978; Eckhardt and Stackelberg, 1995; Nemickas et al., 1989).Water entering the deeper two aquifers can be retained within them for several hundred toseveral thousand years. Some of the water in the shallow Magothy flow discharges again to thebasal Upper Glacial aquifer, but most of the deeper two aquifer discharges occur offshore toeither Long Island Sound or the Atlantic Ocean (Buxton and Modica, 1992).The barrier islands and islands in the Peconic Estuary all have shallow fresh water lenses, fed byrecharge, that sit above salt water aquifers. On the barrier islands, drinking water can beobtained by drilling deeper into the confined Magothy or Lloyd aquifers, and tapping these freshwater systems.For most of Long Island, obtaining enough water is generally not an issue (having adequatequality of the available water may be a problem). However, on the North and South Forks, andfor the islands of the Peconic Estuary (specifically, Shelter Island), because the deeper aquifersare saline, sufficient quantities of water of acceptable quality can be problematic (Nemickas etal., 1989).Figure 3-4 is a generalized cross section of the Long Island aquifer system.Cashin Associates, PC271
Suffolk County Vector Control and Wetlands Management Long-Term PlanDraft Generic Environmental Impact StatementMay 3, 2006Figure 3-4. Long Island Aquifers (after Buxton and Modica, 1992)3.1.4. Suffolk County Surface WatersLong Island’s permanent surface waters are replenished by groundwater discharges. USGSdescribes stream baseflow on Long Island as 95 percent groundwater (Nemickas et al., 1989).This appears to be an underestimate of the baseflow relationship. The porous nature of LongIsland’s soils means that not only does precipitation generally percolate through the surface, butthat retaining water in natural features to supply draining streams is not common.There are four major streams in Suffolk County that are generally classified as rivers. Threeflow north-south: The Nissequogue River, which flows north to Long Island Sound in the central-westernpart of the County The Connetquot River, which flows south to the Great South Bay in the central-westernpart of the County The Carmans River, which flows south into Great South bay in the central part of theCountyThe Peconic River flows east to Riverhead, its terminus at Fla nders Bay. The headwaters of theNissequogue and Connetquot Rivers are relatively close to each other, in the Hauppauge-Islandiaarea. Both the Carmans and Peconic Rivers have headwaters just west of Brookhaven NationalLaboratory, in Upton. Variations in flow in these waterbodies tend to follow the relatively slowCashin Associates, PC272
Suffolk County Vector Control and Wetlands Management Long-Term PlanDraft Generic Environmental Impact StatementMay 3, 2006changes in aquifer water levels, although precipitation-driven run-off can increase flows quickly.Nonetheless, compared to streams where snowmelt or seasonal rainfall controls flow rates, flowsin Long Island streams tend to be more constant. Although precipitation does lead to increasedflows, extensive flooding is unusual, partly due to many dams, and partially because run-off isgenerally minimized by the nature of Long Island soils (Cashin Associates, 2004). The highlypermeable soils also tend to result is quick absorption of floodwaters should any County streamor river overtop its banks, unless the elevation of the local water table exceeds the elevation ofthe ground surface.There are many smaller stream systems. Most flow north-south. Most harbors on the northshore have a small stream draining into their southern end. The proximity of the Harbor Hillmoraine to the shore makes most of these stream courses short. On the south shore, manystreams arise south of the Ronkonkoma moraine. There appear to be residual stream beds fromwhen the water tables on Long Island were much higher, perhaps due to a trapped meltwater lakebehind the Ronkonkoma moraine. This may have resulted in many groundwater fed streamsflowing from the moraine south to the ocean, streams that had much greater flow than thestreams currently occupying the water courses, as noted through DEM analyses by Benningtonand Hanson. This means the valleys associated with the current streams are over- large for theircurrent tenants, and tend to be dry in their northern reaches.Long Island has one moderate-sized lake, Lake Ronkonkoma. As with most ponds on LongIsland, it appears to be a kettle pond. That is, it was formed when a chunk of ice fell from theglacier. Either the fall of the ice caused a depression in the ground surface, or its presenceprevented outwash from occupying the space. When the ice melted, it left a layer of relativelyimpermeable till behind. Those kettle holes intercept either the general water table or a perchedwater table filled with water. Nearly all of these are landlocked. There are some ponds andlakes in conjunction with streams and rivers.However, almost all of these are man- madethrough weirs and dams (Tarr, 1899).Figure 3-5 locates the major surface water bodies of Suffolk County.Cashin Associates, PC273
Suffolk County Vector Control and Wetlands Management Long-Term PlanDraft Generic Environmental Impact StatementMay 3, 2006Cashin Associates, PC274
Suffolk County Vector Control and Wetlands Management Long-Term PlanDraft Generic Environmental Impact StatementMay 3, 2006Water quality in fresh water systems in Suffolk County is somewhat impacted. This is becausefresh surface waters on Long Island generally receive all their water from ground waterdischarge.Groundwater quality is generally a function of land use, and so increasingdevelopment has had measurable impacts to overall groundwater and surface water quality(Eckhardt and Stackelberg, 1995).SCDHS tests water at sites that are used for bathing purposes, such as beaches along LakeRonkonkoma. Coliform is the primary concern, and fresh water bodies sometimes have elevatedlevels that require beach closures. SCDHS does not do genetic testing to determine the source ofthe coliform, and so avian sources are often thought to be among the major contributors toelevated levels (R. Waters, SCDHS, personal communication, 2005).SCDHS, under contract to USGS, also conducts routine water quality sampling for certainFederal surface water quality programs. SCDHS also has its own water quality programs, whichare generally linked to the estuary programs. NYSDEC, through its Rotating Intensive BasinSampling (RIBS) program, tests certain streams and rivers in the County periodically. CAconducted extensive reviews of water quality in two of Suffolk County’s four major rivers (theCarmans and Peconic Rivers) recently. Although water quality in those rivers was not found tobe pristine, neither could the conditions be considered to be impaired (Cashin Associates, 2002;Cashin Associates, 2004).As is discussed below, water quality sampling conducted by SCDHS sometimes has includedpesticides used by SCVC as analytical parameters. SCDHS has never detected these pesticidesin any routinely collected fresh water samples (K. Hill, SCDHS, personal communication, 2004).Estuarine water quality is also tested by various organizations. Three estuary programs addressnearly all salt water bodies in the vicinity of Suffolk County.The Long Island Sound Study CCMP (1994) has identified three primary water quality problems.These are: Low dissolved oxygen concentrations (hypoxia). Hypoxia is primarily a problem inwestern Long Island Sound, although low concentrations are sometimes measured as fareast as Mattituck.Hypoxia is also a problem in certain areas of the north shoreembayments. The primary cause for hypoxia identified by LISS is nutrient enrichment,Cashin Associates, PC275
Suffolk County Vector Control and Wetlands Management Long-Term PlanDraft Generic Environmental Impact StatementMay 3, 2006which causes phytoplankton blooms, leading to organic enrichment of bottom waters,increased metabolic activity there, and, because of water column stratification, depletionof dissolved oxygen on a seasonal basis. Toxic substances. These include six metals, persistent first generation organic pesticides(such as DDT), polychlorinated biphenyls (PCBs), and pesticides and polyaromatichydrocarbons (PAHs), generally. Inputs of these contaminants to Long Island Soundappear to be linked primarily to historical uses, although non-point sources and sewagetreatment plants continue to introduce modern pesticides and PAHs into the system. It isnoted that water quality generally is good, but that sediment quality can be degraded.More problems exist closer to New York City and Connecticut tributaries than along theSuffolk County shore. Pathogens.Pathogen contamination is generally measured by indicators, primarilycoliform and fecal coliform.High levels of coliform lead to beach closures andprohibition on shellfishing. Again, although these problems do not exclusively occur inwestern Long Island Sound and near Connecticut tributaries, they tend to be exacerbatedthere. In Suffolk County, beach and shellfishing closures tend to be restricted to theharbors, not the open waters of the Sound.Water quality impairments are described as the leading cause of natural resource impacts, sothese water quality issues are of greatest importance (LISS, 1994). LISS-related sampling doesnot include testing for mosquito control pesticides.The South Shore Estuary Reserve CMP (SSER Council, 2001) has identified stormwater runoffas the primary source of water quality impairments. Coliform bacteria and nutrients are theprimary concerns. Coliform leads to shellfish bed and bathing beach closures because it is anindicator of human pathogens.Nutrients support blooms of brown tide, and together withsediments threaten fish and shellfish survival, especially in tributaries. Other inputs to thesystem that affect these parameters include human waste discharges from vessels, excrementfrom waterfowl, discharges from municipal wastewater treatment plant outfalls, and inputs fromagriculture. In addition, modifications to the overall hydrological regime of the estuary, leadingto alterations of water level and stream flow, and associated lowering of water table levels alsohave had significant effects on fishery resources in tributaries.Cashin Associates, PC276
Suffolk County Vector Control and Wetlands Management Long-Term PlanDraft Generic Environmental Impact StatementMay 3, 2006According to the PEP CCMP (SCDHS, 2002a), the water quality issue of greatest concern forthe estuary is Brown Tide. Research has not absolutely determined the cause of the initialoutbreak and subsequent reoccurrence of the Brown Tide, but the leading hypothesis involvesfluctuations in nutrients due to interannual changes in groundwater inputs, and a decline ingrazing control by suspension feeders (Gobler et al., 2005). Brown tide has destroyed thehistorical shellfishing industry of the Peconics. Other important, developing water quality issuesinclude: Pathogens, which have caused the closure of shellfish beds Nutrient enrichment causing lower DO levels in Flanders Bay Concerns regarding the potential for impacts due to low concentrations of toxicsubstancesFinfish abundance has declined, and important aquatic habitats are disappearing or becomingfragmented, and the role of water quality cha nges in these problems is not clear (SCDHS,2002a).SCDHS plays important roles in the collection and analysis of environmental data in thesesystems. Water quality sampling conducted by SCDHS sometimes has included pesticides usedby SCVC as analytical parameters. SCDHS has never detected these pesticides in any routinelycollected salt water samples (K. Hill, SCDHS, personal communication, 2004).3.1.5. Suffolk County WetlandsSalt marshes and fresh water wetlands constitute important environmental resources. NYSDEChas mapped 18,084 acres of fresh water wetlands. NYSDEC has a state-wide limit of 12.4 acres(five hectares) for mapping wetlands, except for those areas of regional interest that arenominated to it. Long Islanders have been very diligent in nominating local wetlands so that theNYSDEC mapping here includes many parcels below the five hectare limit. Most of thesewetlands are found along streams or at ponds or lakes. Wetlands that are not normally includedin the NYSDEC mapping include smaller, man- made sites (recharge basins and the like). Thesecan generally be found through the Federal NWI mapping.Fresh water wetlands, and, in particular, three fresh water systems that were part of the primarystudy areas, are discussed in some detail in the Section 5. The discussion of the four riskCashin Associates, PC277
Suffolk County Vector Control and Wetlands Management Long-Term PlanDraft Generic Environmental Impact StatementMay 3, 2006assessment areas also includes an abundance of information of fresh water wetland- linkedresources (see Section 4).Salt marshes can be found all along the coast of Suffolk County.CA quantified SuffolkCounty’s salt marshes at 16,839 acres, based on the NWI mapping. Typically, these systems areclassified as either North Sh
Suffolk County Vector Control and Wetl ands Management Long -Term Plan Draft Generic Environmental Impact Statement May 3, 2006 _ Cashin Associates, PC 265 The Peconic Estuary system lies between the North and South Forks of eastern Long Island. The South Shore Estuary system lies between the barrier islands and the south shore of the Island.