Transcription
Travel to Work Report 2012Published June 2012Prepared by Business Development, Data and Information Hub, SCCFor more information regarding the contents of this report, please e-mail:Richard.Calton@suffolk.gov.ukPage 1 of 26
Whilst every effort is made to ensure the accuracy of data in this report, neither Suffolk CountyCouncil nor its employees may be held liable for errors of fact or interpretation. In mostinstances figures have been rounded.This report may be used for research or education purposes, provided a reference to the sourceis given, and is not used in a misleading context. It may not be used for commercial purposeswithout further approval, for which a fee may be payable.Copyright Suffolk County Council 2012Page 2 of 26
Content1Headline results42Background and methodology42.13Validation checks. 5Results53.1Q1 Which organisation do you work for? . 53.2Q2 Which location do you normally work at? (SCC only) . 63.3Q3 Which section do you work in? (SCC only) . 63.4Q4 How do you normally travel to work? (All organisations). 73.5Q5 Of the modes reported in Q4, which do you use the most? . 83.6Q6 What distance do you travel to work? . 123.7Q7 Whilst at work, how often do you use your own car for work purposes?. 133.8Q8 If you don't use sustainable transport which of these ‘factors’ would help persuadeyou to do so?. 134Company comparison4.14.24.314Sustainability comparison 2008 to 2012 . 15Most used travel mode comparison . 17What would change your behaviour. 19Appendix A – 1 day travel survey travel questions22FiguresFigure 1 - 2005 to 2012 All modal travel trends .11Figure 2 - 2005 to 2012 Modal travel trends - expanded bottom half .11Figure 3 - Distance travelled to work .12Figure 4 - Change in travel distance profile.12Figure 5 - What would persuade you to travel by sustainable means? (% of participants) .13TablesTable 1 - Companies participating in the 2012 travel survey.5Table 2 - All travel modes used to travel to work along with their primary (or most used) travelmode. .7Table 3 - Most used travel mode to work - average of all organisations participating.8Table 4 - Most used travel mode to work – base line organisations only .9Table 5 - Most used travel mode compared to all travel modes used – all participatingorganisations.9Table 6 - Modal trends (base line of organisation) .10Table 7 - Distance travelled to work trends .12Table 8 - What would persuade you to travel by sustainable means? (% of participants) .14Table 9 - Headline sustainability results for 2008 to 2011 - by company .15Table 10 – Returns and Sustainability figures for SCC locations .16Table 11 - Normal travel mode responses by location for SCC .16Table 12 - Normal travel mode % by location for SCC .17Table 13 - Most used travel mode.18Table 14 - What would change your behaviour .20Table 15 - What would change your behaviour (SCC only) by location.21Page 3 of 26
1 Headline resultsThe 2012 online travel to work survey was conducted on the 16th May 2012. 17 organisationsparticipated with a total of 4512 respondents, or 1.3% of the working population of Suffolk.The key findings from the survey were:In 2012, 31.2% of respondents usually travelled to work by sustainable modes {Bus, Car passenger,Cycle, Park and Ride, Taxi, Train, Walk and Work from home}, some 2.2% less than the previous 3years. When restricted to those organisations that formed the original 2005 base set the sustainabilitystands at 32.4% a drop of 1.9% on the sustainability of 2011.Looking at the baseline of organisations, over the period 2005 to 2011 most sustainable modes oftransport, saw a steady year on year improvement throughout the period. 2012 has seen a departurefrom this simple model with:Walking to work increasing from 7.3%, to a peak of 10.5% in 2010 and a decline to 9.6% in 2012.Home working reached its peak in 2011 with a 6 fold increase on 2005 (0.3% to 1.9%), now stands at1.6%Train travel has seen a steady 3 fold increase from 1.3% in 2005 to 3.9% in 2012.Park and Ride has resumed its upward trajectory, now stands at 1.1% – following the drop in 2011associated with the closure of Ipswich, Bury Road Park and Ride.Bus usage reached it peak in 2007 at 9.2% and now stands at 4.9%‘Car driver – single occupant’ now stands at an all time high of 57% whilst those travelling as a ‘CarPassenger’ stands at an all time low of 3.1%In 2012 some 30% of respondents used their own car at least once a week for work purposes.For BT, SCC and IBC the survey separated out responses by location – allowing comparisons of travelmode to be made for employees at the same organisations but based at different locations. For SCC thedifference in sustainability figure is very variable with ACS Whitehouse having a sustainability figure ofjust 5% whilst at Endeavour House it is 48%.2 Background and methodologySuffolk County Council has produced three Local Transport Plans since 2001 to help guide the future oftransport in Suffolk.Suffolk’s Local Transport Plan t/transport-planning/local-transport-plan/] has a long-term strategy covering the period 2011through to 2031, while the implementation plan covers the short-term to 2014. The 1-day travel to worksurvey is one of a number of activities to help Suffolk County Council (SCC), understand how peopletravel within the county in order to help improve transport services. The survey data is also used toassist companies to develop their own travel plans or monitor progress against existing ones.The 1-day travel to work survey is conducted on-line and was first used by SCC in May 2003. A copy ofthe 2012 survey questions is included in Appendix A.For 2012 ‘Survey Monkey’ software was used for the Survey; opening on the 11th May and staying openfor 3 weeks to allow people not at their workplace on the day to respond.Page 4 of 26
The 2012 survey used ‘Survey logic’ to skip questions that are not relevant to a particular participant.For example question 2 and 3 were only relevant to SCC so these questions were automatically missedout for others.To assist individual organisations with their own transport plans the following changes were made to thesurvey.- The BT responses were split between Adastral and Bibb Way.- The Police response was split between Martlesham and Ipswich – with dedicated survey conducted forIpswich to gather information in preparation for their move to Landmark House – the results of thissurvey are not included in this report.In total 15 organisations participated, with a total of 4512 respondents or 1.3% of the working populationof Suffolk. As not everyone answers every question the response rate varies from question to question.2.1 Validation checksA small number of validation checks of the raw data is necessary to ensure the accuracy of the results.This includes the following:- There are a number of fields were the individual can select the ‘Other option’ rather than select aspecific option. This can be for a variety of reasons such as wishing to provide additional information orhaving missed the option in the list provided. Processing is needed to ensure that these entries arehandled appropriately in the analysis.- Removing erroneous data – for example travelling by ‘solar powered canoe’ or finding every box ticked.In these very limited cases the data is treated as test data and is removed prior to the analysis.3 ResultsA copy of the questions asked are shown in Appendix A.3.1 Q1 Which organisation do you work for?The organisations and the geographic location of where the majority of the workforces are based areshown in Table 1, with respondent numbers for 2012.Table 1 - Companies participating in the 2012 travel survey.OrganisationMain locationBabergh District CouncilBTCustomer Service DirectForest Heath District CouncilIpswich Borough CouncilMid Suffolk District CouncilPolice - MartleshamSt Edmundsbury Borough CouncilSuffolk Coastal District CouncilSuffolk Coastal ServicesSuffolk County CouncilSuffolk PCTThe Environment AgencyUniversity Campus SuffolkWaveney District CouncilOtherHadleighAdastral and Bibb Way (Ipswich)IpswichMildenhallIpswichNeedham MarketMartleshamBury St chLowestoftvariousPage 5 of 26Respondents93844 353469611110425118986271918244014189116% of 6%42.5%0.5%0.9%3.1%2.0%2.6%
For the 2012 survey there were 15 organisations taking part, compared to 17 in 2011, with the removalof Willis and Ipswich Hospital. Willis where undertaking a more comprehensive travel survey at aroundthe same time so decided not to participate in the online survey on this occasion (to prevent surveyfatigue).For the analysis of trends and comparisons with previous years the following base set of companies hasbeen used, the main difference from previous years is the absence of Willis: Babergh District Council BT Customer Service Direct Forest Heath District Council Ipswich Borough Council Mid Suffolk District Council St Edmundsbury Borough Council Suffolk Coastal District Council Suffolk County Council Suffolk PCT Waveney District Council3.2 Q2 Which location do you normally work at? (SCC 1%Other42%EndeavourHouse38%Paul's Road1%West SuffolkHouse6%St EdmundHouse2%Saxmundham2%PhoenixHouse4%There were a total of 1860 responses to this question, restricted to SCC employees only.3.3 Q3 Which section do you work in? (SCC Other3%Adult usion andDiversity7%Economy,Skills andEnvironment14%Children andYoung People30%Page 6 of 26
3.4 Q4 How do you normally travel to work? (All organisations)The question was intended to capture all modes that people use to get to work, be it multiple modes on asingle day or multiple modes over different days. It was intended to show the breadth of travel optionsthat people use – rather than the single primary mode.Table 2 - All travel modes used to travel to work along with their primary (or most used)travel mode.All travel modesBusCar driver single occupantCar driver- withpassengerCar passengerCycleMotor cyclePark and RideTrainWalkingWork fromhomeBusCar driver – singleoccupantCar driver - 0%0.1%0.2%1.5%Car passengerCyclePrimary travel modeMotor cyclePark and RideTrainWalkWork from homeThe table shows all modes that a person uses as well as their primary mode. The primary mode ornormal mode was obtained from the participant’s response to Q5. With the pale yellow squares on eachrow representing the % that use a particular primary mode of travel. These primary modes add up to100%. The primary mode % may differ slightly from those given in the next section as not every onecompleted both questions.The percentages are the % of all participants. Each row corresponds to a particular primary travel modeand the columns to all travel modes that are used to get to work.For example – Car driver – single occupant as a primary mode of travel to work is given by the yellowsquare on the ‘Car driver – single occupant row’ as 58.6%. The square to the left of this yellow square,1.5%, is the percentage of participants that have a primary travel mode of ‘car driver - single occupant’but also travel to work by bus, on occasion.Page 7 of 26
An alternative view is to see what proportion use a particular travel mode sometime – be it every day oroccasional. This is obtained by adding together the figures for a travel mode column in table 2.Travel ModeBusCar driver - single occupantCar driver- with passengerCar passengerCycleMotor cyclePark and RideTrainWork from homeWalk% of participants(primary travel 1.0%3.1%3.5%3.3%1%1.6%1.5%11%10.6%8.7%% of 1.9%6.0%8.0%18.7%This shows for example that although 8.7% of participants in 2012 used walking as their primary ornormal travel mode to get to work this grows to 18.7% that sometimes walk. Both over 2% lower thanin 2010 – presumably a reflection of the unusually wet spring in 20123.5 Q5 Of the modes reported in Q4, which do you use the most?Table 4 shows the mode share for all participants – using all returns from all organisations. Using thisapproach there was a drop of 2.2% decline in LTP sustainability figure of 31.2%.for 2012, compared tothe preceding 3 years.Primary modeTable 3 - Most used travel mode to work - average of all organisations participatingBusCar driver - single occupant (wholejourney)Car driver with a passenger/ carshare (any part of the journey)Car passengerCycleMotor cycle/ moped/ motor scooterPark and RideTrainWork from .4%0.9%1.0%3.3%1.5%8.7%0.1%33.4%33.4%33.4%31.2%An alternative sustainability figure can be obtained by restricting the organisations to those that havebeen used historically, in particular to:Babergh District CouncilBT - Bibb WayBT - MartleshamCustomer Service DirectForest Heath District CouncilPage 8 of 26
Ipswich Borough CouncilMid Suffolk District CouncilSt Edmundsbury Borough CouncilSuffolk Coastal District CouncilSuffolk County CouncilSuffolk PCTWillisIf this is undertaken without Willis (as they were unable to participate) the sustainability figure comes outat 32.1%. To compensate for this by including the previous returns for Willis the Sustainability figurecomes out at 32.4%. Which is 1% less than any of the previous 3 years. The weather is a potentialcontributing factor for the observed change as 2011 was the warmest spring on record whilst 2012 wasone of the wettest.Primary modeTable 4 - Most used travel mode to work – base line organisations only2009Bus5.9%Car driver - single occupant 55.1%(whole journey)Car driver with a passenger/ carshare (any part of the journey)9.7%Car passenger4.0%Cycle7.9%Motor cycle/ moped/ motor 1.4%scooterPark and Ride1.2%Train3.2%Work from .3%32.4%Although the sustainability figure is 32.4% for the mode of travel people normally (most) use to travel towork. As shown in section 4, people use a combination of modes if the same sustainability calculation isperformed on all the modes that people use the sustainability figure rises to 43.4%. This means that thesecondary modes of travel that people use tend to be more sustainable. It is interesting that this figure isexactly the same as last year although the most used sustainability is less.Primary modeTable 5 - Most used travel mode compared to all travel modes used – all participatingorganisations2012NormalAll modesmode onlyusedBus4.6%6.0%Car driver - single occupant (whole journey)58.6%44.2%Car driver with a passenger/ car share (any part 9.3%of the journey)9.8%Car passenger3.0%5.0%Cycle9.4%10.4%Motor cycle/ moped/ motor scooter0.9%1.6%Park and Ride1.0%1.0%Train3.3%3.9%Page 9 of 26
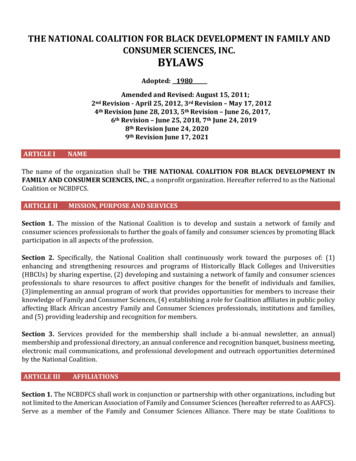
Work from 1.8%43.4%3.5.1 Modal trendsTable 6 and Figures 1 & 2 show the modal preference. ‘usual mode of transport’ or primary travel mode,since 2005 for the baseline organisations.From 2005 through to 2011 the percentage travelling by sustainable means has increased from 27.8% to34.3%, whilst 2012 has seen a year on year decline of 1.9%.For the baseline of organisations, from 2005 to 2011, most sustainable modes of transport, saw a steadyyear on year improvement throughout the period. 2012 has seen a departed from this simple modelwith:Walking to work increasing from 7.3% in 2005 to a peak of 10.5% in 2010 and has declined to 9.6% in2012.Home working in 2005 stood at 0.3%, saw a 6 fold increase by 2011 and now stands at 1.6%.Train travel has seen a steady 3 fold increase from 1.3% in 2005 to 3.9% in 2012.Park and Ride has resumed its upward trajectory, now stands at 1.1% – following the drop in 2011associated with the closure of Ipswich, Bury Road Park and Ride.Bus usage reached it peak in 2007 at 9.2% and now stands at 4.9%‘Car driver – single occupant’ now stands at an all time high of 57% whilst those travelling as a ‘CarPassenger’ at an all time low of 3.1%.Table 6 - Modal trends (base line of organisation)Travel ModeBusCar driverCar driver- car shareCar driver- single occupantCar passengerCycleMotorcycle/Moped/MotorScooterOther mode of transportPark & RideTrainWalkWorked from homeLTP2 9%34.3%0.1%1.1%3.9%9.6%1.6%32.4%Page 10 of 26
Figure 1 - 2005 to 2012 All modal travel trends80.00%Car driver70.00%Car driver- singleoccupantCar driver- car share60.00%Walk50.00%Cycle40.00%BusTrain30.00%Car passenger20.00%Worked from home10.00%Park & Ride0.00%2005 2006 2007 2008 2009 2010 2011 2012Motorcycle/Moped/MotorScooterFigure 2 - 2005 to 2012 Modal travel trends - expanded bottom half16%Car driver- car share14%Walk12%Cycle10%BusTrain8%Car passenger6%Worked from home4%Park & Ride2%Motorcycle/Moped/MotorScooter0%2005 2006 2007 2008 2009 2010 2011 2012Page 11 of 26
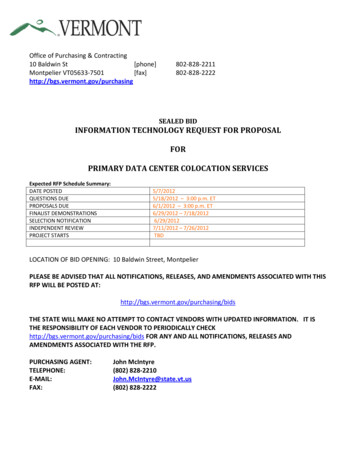
3.6 Q6 What distance do you travel to work?Question 6 was introduced to find the distances people were travelling to work, and analyse whetherpeople were travelling short distances unsustainably. Back in 2005 there was a 60/40 split ofrespondents who travel more than 15 miles / under 5 miles to their place of work. This ratio declineslightly up to 2011 but for 2012 is now back were it started.Figure 3 - Distance travelled to workOver 20 miles16.2%N/A e.g. Homeworker0.4%Less than 1mile5.7%1 to less than 3miles20.0%10 to less than20 miles24.1%3 to less than 5miles13.4%5 to less than10 miles20.2%Figure 4 - Change in travel distance .00%0.00%Less than 1 1 to less3 to lessmilethan 3 miles than 5 miles5 to lessthan 10miles10 to lessthan 20milesOver 20milesTable 7 - Distance travelled to work trendsDistanceLess than 1 mile1 to less than 3 miles3 to less than 5 miles5 to less than 10 miles10 to less than 20 milesOver 20 .4%20.2%24.1%16.2%The bimodal nature of the distribution shown in Figure 4 and the shift in that distribution with time mayreflect the geographic distribution of housing and work.Page 12 of 26
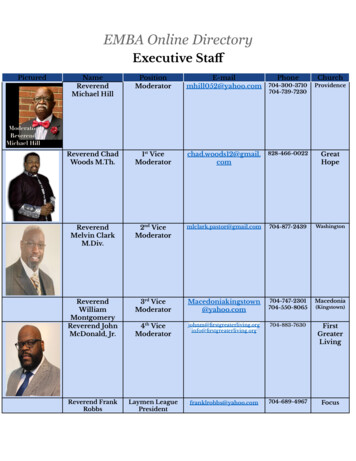
3.7 Q7 Whilst at work, how often do you use your own car for workpurposes?In 2012 some 13% use their own car for work everyday and an additional 17% at least once a week.N/A7%Every day13%Once aweek ormore but notevery day17%Never36%Once amonth ormore butless thanonce a week9%Less thanonce amonth18%select other first)3.8 Q8 If you don't use sustainable transport which of these ‘factors’would help persuade you to do so?- you may need toThis question was intended to see what factors might persuade people to use sustainable transport.Only those individuals that currently travel by non sustainable means, as their primary or normal mode,have been included in the analysis.Of 3168 responses that don’t currently travel by sustainable means, the highest returns were 28.2% for‘reliability of public transport’, 27.9% for ‘the cost of public transport’ and 22.4% for faster more direct busservices.Page 13 of 26b.Wheelchairaccessib leTraffic calmingFaci lities atwork fo r cyclists (pleas eprovidedetails in the textFigure 5 - What would persuade you to travel by sustainable means? (% of participants)Hel p to fin dcar sharingcare arra.Improv ed childworking (pl.More flexi bleN/ADedicatedworks b usAvailabi lityof po ol carsrma tion a nda.Rel iabl e infoExtended evening bus serv ic esSaf er cyclepaths and footpa thsSta ff discounts (pleases.Dev elopm ent of hom ewor.e spe ci fy)5O ther (pleasNothi ngre ct bus s.Faste r - more diMor e reliable,30.0%25.0%20.0%15.0%10.0%5.0%0.0%on time, frequent and clean public transportCheaper public transportfie ld belowThe number of committed car users were nothing would persuade them (None and N/A) stands at 26.6%in 2012 this is marginally up on the equivalent figure of 25.9% for 2011.
Table 8 - What would persuade you to travel by sustainable means? (% of participants)FactorMore reliable, on time, frequent and clean public transportCheaper public transportFaster - more direct bus servicesNothingOther (please specify)5Development of homeworkingStaff discounts (please specify which service/operator in the text field below- you may need to select other first)Safer cycle paths and footpathsExtended evening bus servicesReliable information and advice on public transport availabilityAvailability of pool carsDedicated works busN/AMore flexible working (please provide details in text box below - you mayneed to select other first)Improved child care arrangementsHelp to find car sharingFacilities at work for cyclists (please provide details in the text field below you may need to select other first)Traffic calmingWheelchair-accessible .0%6.8%6.4%5.6%5.5%4.5%4.1%3.2%2.6%0.8%0.1%Company comparisonFor 2011, reports have been produced and distributed to all organisations that took part:Babergh District CouncilBTCustomer Service DirectForest Heath District CouncilIpswich Borough CouncilMid Suffolk District CouncilPolice (Martlesham)St. Edmundsbury Borough CouncilSuffolk Coastal District CouncilSuffolk Coastal ServicesSuffolk County CouncilThe Environment AgencyNHS SuffolkUniversity Campus SuffolkWaveney District CouncilThese reports were produced using the raw data out of Survey Monkey. The results contained in thisreport ‘Travel to work report 2012’ although still derived using the survey monkey data has undergoneadditional validating (section 2.1) to remove erroneous data etc.Page 14 of 26
4.1 Sustainability comparison 2008 to 2012Of the 15 organisations that participated most firms saw a drop in the overall sustainable travel modesreported {Bus, Car passenger, Cycle, Park and Ride, Taxi, Train, Walk and Work from home} in 2012compared to 2011 – the only exceptions were Ipswich BC, Mid Suffolk DC and Suffolk coast DC.There are big differences in the sustainable transport figures across the county. The highest sustainablefigures were 52.7%, 46.9% and 44.9% for Ipswich Borough Council, BT Bibb Way, University CampusSuffolk respectively; whilst the lowest at 0%, 4.3%, 8.6% and 10.9% were Suffolk PCT, Suffolk CoastalServices, Babergh DC and Forest Heath DC respectively.The distance travelled to work and the % using a car for work had been included in the sustainabilitytrend table as potential contributing factors. The distance travelled to work varies from 7.7 miles forWaveney DC up to 16.4 miles for Suffolk Coastal services. While the percentage using a car at work, for1 or more days a week, ranges from 9% for BT Bibbway through11% for Ipswich BC to 59% for ForestHeath DC.Table 9 - Headline sustainability results for 2008 to 2011 - by companyCompanyMainlocationBabergh DCBT - Bibb WayBT - AdastralCustomer ServiceDirectForest Heath DCIpswich BCMid Suffolk DCHadleighIpswichMartleshamIpswichOtherPoliceSt Edmundsbury BCSuffolk Coastal DCSuffolk CoastalServicesSuffolk CCSuffolk PCTThe EnvironmentAgencyUniversity CampusSuffolkWaveney DCGrand TotalNo. of Averagereturn 862719182411.38.911.110.0%Sustainability %usinga caratwork20082009 201046%16.013.7 17.19%33.333.7 35.414%32.114%45.848.4 .1 Sustainability comparison across Suffolk County Council – by locationFor SCC participants, responses to Q2 ‘Which location do you normally work at’ allowed thesustainability to be viewed by location as shown in tables 11, 12 and 13. These range from 5% for ACSWhitehouse to 62% for Constantine House.Page 15 of 26
Table 10 – Returns and Sustainability figures for SCC nACS WhitehouseClapham HouseConstantine HouseEndeavour HousePaul's RoadPhoenix HouseSaxmundham County BuildingsSt Edmund HouseWest Suffolk 39%26%30%27%24%The location of the two highest sustainability figures Endeavour House (48%) and Constantine House(62%) are geographically close to the main location for Ipswich Borough Council and BT Bibb way whichalso had the highest sustainability of the participating firms at 52.7% and 46.9% respectively. Thiscluster of high sustainability is probably a result of a number of factors such as:- 400m from the rail station- Park and Ride stops within 200m- Staff discounts (50% off season tickets and Park and Ride tickets)- Free shuttle bus stops outside- It is reasonably well served by cycle routes - on cycle route 51- Covered and secure cycle facility provided- Changing and shower facilities provided for cyclists- Active green travel plan manage with initiatives such as cycle loan facilities and free cycleservice.- Availability of pool cars for business use (SCC)- Road traffic congestion getting in and out of work, plus 3 car park charge act as barriers to usinga car (SCC).Table 11 - Normal travel mode responses by location for SCC245316128951212521221854Page 16 of 220010111720SustainabilityWork from homeWalkTrainPark and RideMotor 1Car passengerCar driver with apassengerACS WhitehouseClapham HouseConstantine HouseEndeavour HousePaul's RoadPhoenix HouseSaxmundhamSt Edmund HouseWest Suffolk HouseOtherGrand TotalCar driver - %24%34.2%
Table 12 - Normal travel mode % by location for SCCCar driver with apassengerCar passengerCycleMotor cyclePark and RideTrainWalkWork from ainabilityCar driver - singleoccupantACS WhitehouseClapham HouseConstantine Ho
Suffolk Coastal District Council Woodbridge 86 1.9% Suffolk Coastal Services Ufford 27 0.6% Suffolk County Council Ipswich 1918 42.5% Suffolk PCT Ipswich 24 0.5% The Environment Agency Bramford 40 0.9% University Campus Suffolk Ipswich 141 3.1% Waveney District Council Lowestoft 89 2.0% Other various 116 2.6%