Transcription
ASTM E42 Surface Analysis Community ForumFriday, November 6, 2020,This PDF file: The announcement for the Community Forum which was held November 6,2020 The three presentations given as part of the Forumo Matthew R. Linford, An Assessment of the Frequency and Nature ofErroneous X-ray Photoelectron Spectroscopy (XPS) Analyses in theScientific Literatureo Mark H. Engelhard, The Structure of the Current Tool Kit, standards,Historic drivers and creation of guides and reports prepared by ASTME42 on Surface Analysis and ISO TC 201 on Surface Chemical Analysiso Donald R. Baer, Issues affecting credibility in XPS analysis andinterpretation, Strategies Going Forward Compiled version of Chat discussion of questions, comments and ideasfrom the Forum Copy of follow-up email to Forum Participants providing information,requesting input and talking about a path to move forward.To navigate to the section of interest, load the PDF and click on the bookmark tabon the left side of the screen. You should be able to see an icon for each of thedocuments in the PDF. Clicking on that icon will expand for each page in a file orcontract one image for each file, as indicated above.Image of bookmark
ASTM E42 Surface Analysis Community ForumFriday, November 6, 2020,12:00 EST (18:00 Europe, 17:00 UK, 09:00 Pacific US)Duration: 90 minutesASTM committee E42 on surface analysis invites you to attend our community forumdiscussion on issues affecting credibility in XPS analysis and interpretation.Data in the literature that is poorly acquired, analyzed, or presented can have far reachingeffects on the credibility of any technique. Ensuring that the community has the resourcesavailable to help the expanding user base will benefit us all!Join us for a virtual discussion of this surface analysis research community topic and helpdetermine the best solution path that addresses these pressing issues.Leading experts will lead discussion with participants, laying out the specifics of the problem,explaining how this has progressed and the resources currently available, and then lookingforward to how we can improve the resources available and their distribution, with a goal ofproviding tools to improve research results.The Problem, as it affects the research communityMatt Linford will describe a multi-institutional and multi-country analysis of XPS reported inthree scientific journals which demonstrates significant problems in the analysis of XPS dataappearing in the literature. He will describe a quantitative assessment of the problems andreport information learned about the most common issues that have been observed.The Structure of the current toolkitMark Engelhard will then provide a short summary of early issues in XPS analysis whichmotivated the creation of the standards committees ASTM E42 and ISO TC201, and willsummarize the types of standards and guides that have been created, and explain some ofthe inter-relationships among relevant surface analysis standards in E42 and TC201. Recentinvestigations questioning the adequacy of the reporting of analysis information specified inISO and ASTM standards will be discussed, as an example of the limitations of the standardsand guides in meeting the community data reporting challenges.The Strategy Going ForwardDon Baer will relay the development of recent guides that are intended to help address theissues and explain what is still in the pipeline. He will explore other tools that might be useful,including the possibility of an XPS reporting guide that could indicate prescribed reporting forlevels of confidence and the work towards normalization of these. One objective of thispresentation is to seek community input on tools and/or other approaches on how to decreasethe incorrect XPS data reports in the literature. Such discussion can guide development ofASTM 42, ISO TC201, AVS Recommended Practices and other activities.Together, we can build a framework to ensure that resource is available for theresearch community to help improve the quality of surface analysis result reporting!
An Assessment of theFrequency and Nature ofErroneous X-ray PhotoelectronSpectroscopy (XPS) Analyses inthe Scientific LiteratureMatthew R. LinfordDepartment of Chemistry andBiochemistryBrigham Young UniversityProvo, UT 84602Nov. 6, rmation/, uvu.edu
A problem with the XPS data analysis in theliterature. Was there always a problem? Decades ago, surface analysis was mostly done by a very smallcommunity of experts However, as the importance of surface analysis has increased,many more people have been using XPS Most XPS is now being done by non-experts About 150 instruments are sold each year The world doesn’t produce enough highly trained expertsto go with those instruments A senior spokesman for XPS, Don Baer, retired from PNNL Don suggested that the community of experts write guides onXPS to help newer users do better Quite a few of us have been involvedhttps://www.pnnl.gov/people/donald-baer
Example of one ofthe guideshttp://www.unm.edu/ kartyush/
A Letter to Help Alert theScientific Community tothe Issue
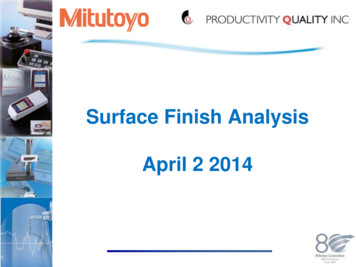
How bad are things really? Noise labeled aschemical states“Aluminum Coating Influence on NitrideLayer Performance Deposited by MO-CVDin Fluidized Bed on AusteniticStainless Steel Substrate”. IOP Conf.Series: Materials Science and Engineering374 (2018) 012020 doi:10.1088/1757899X/374/1/012020.
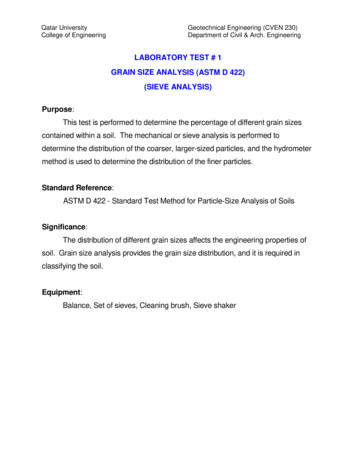
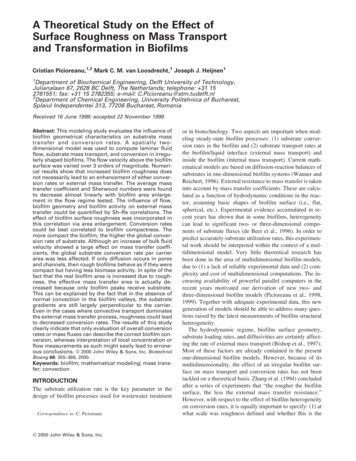
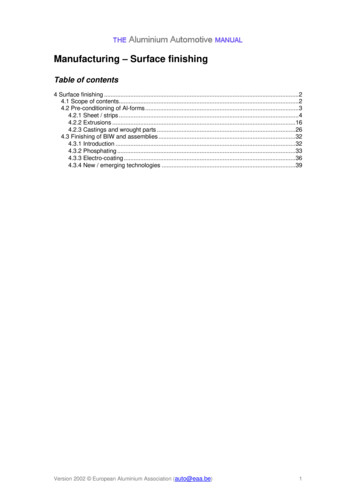
The Proliferation of Bad XPS Peak Fitting inthe Literatures vs. p, d, and f orbitalsElemental SulfurRaw dataSum of peak fitS 2p3/2164.0 eVS 2pPeak Binding EnergiesShirley background subtractionGauss Lorentz fitGauss 90%FWHM 0.94 eVArea ratio lock 0.5Peak separation lock 1.18 eVc/sS 2p1/2165.2 eV172170168166164162Binding Energy 24739/?locale de DE160158
The Proliferation of Bad XPS Peak Fitting inthe Literature12.1 impact factorThe authors should have considered S 2p spin-orbit splittingThe S 2p1/2 S 2p3/2 peak area ratio should be set to 1:2and peak separations should be 1.18 eVNature Communications 6:7436 (2015) DOI: 10.1038/ncomms8436Figure from Mark Engelhard at EMSL
The Proliferation of Bad XPS Peak Fitting inthe LiteratureWidely varying peak widths in a fit here.Disordering inGd2(Ti1-xZrx)O7 Pyrochlores“It can be fitted by two Gaussian functionalcurves, indicating the different anionmigration mechanism from that in Gd2(Ti1xZrx)O7”Phys Rev Letters,V88, N10 (2002)DOI:10.1103/PhysRevLett.88.015901
The Proliferation of Bad XPSPeak Fitting in the LiteratureIt is not uncommon to see spectra fromsimilar materials compared. In thesecases, authors sometimes do notconstrain the fit components so thatcomponents that should represent thesame chemical states in the spectraend up with very different positions andwidths.
Measuring the Problem We were all seeing really bad XPS analysis in the literature, butno one had measured the problem. How bad was it really? We decided to measure it We formed an ad hoc committee with other experts: Don Baer(PNNL), Thomas Gegenbach and Chris Easton (CSIRO, Australia),Bill Skinner (Future Industries Institute, Australia), AlbertoHerrera-Gomez (CINVESTAV, Mexico) We evaluated all the XPS spectra shown in three high-qualityjournals (A, B, and C) over a six-month time period: 407 of thepapers we looked at showed XPS spectra, 63% of these werefitted Journal A: Battery/energy journal IF 25 Journal B: Surface and materials, IF 4 Journal C: General science journal with a lot of materialscontent: IF b5a53/, ?originalSubdomain au, https://www.researchgate.net/profile/Alberto Herrera-Gomez, https://www.pnnl.gov/people/donald-baer
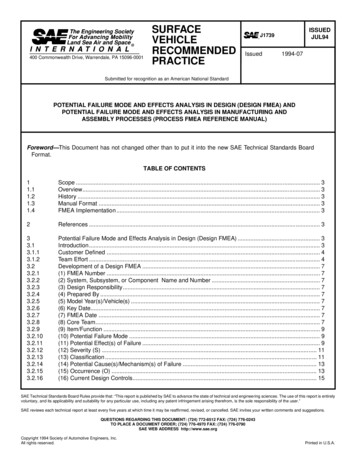
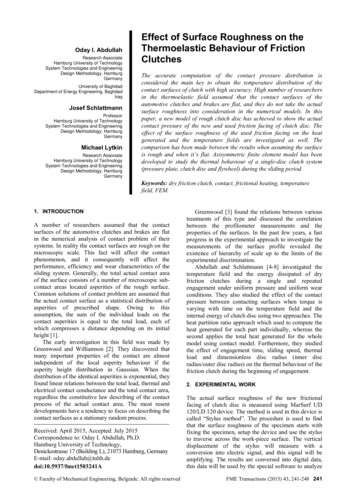
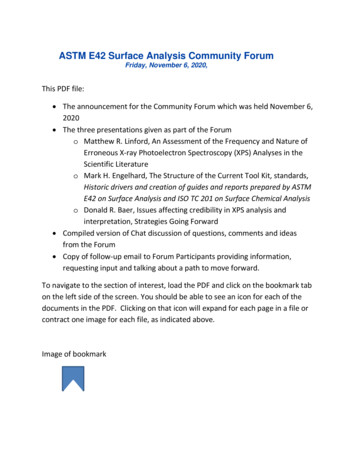
Measuring the Problem OurclassificationschemeReprinted with permission from [George H. Major, Tahereh G. Avval, Behnam Moeini, et al., “Assessment of the frequency and nature of erroneous x-ray photoelectronspectroscopy analyses in the scientific literature” J. Vac. Sci. Technol. A 38, 061204; doi: 10.1116/6.0000685]. Copyright 2020., American Vacuum Society.
The ErrorsGreen Category No significant errors, although there may be a few minor issuesYellow Category Modest truncation of the edges of a peak envelope Neglecting to include the sum of the fit components and/or theresiduals to the fit (or some other figure of merit for peakfitting), but the fit components appeared to be a goodapproximation to the peak envelope. Not including/showing the background/baseline for the fit, but,again, the fit/data analysis otherwise seemed reasonably sound Some concerns about the selection of the baseline relative tothe -4b1b5a53/, ?originalSubdomain au, https://www.researchgate.net/profile/Alberto Herrera-Gomez, https://www.pnnl.gov/people/donald-baer
The ErrorsOrange Category Significant truncation of the peak envelope in a narrow scan Not including the sum of the fit components and/or theresiduals, where the sum of the fit components did not appearto be a good approximation of the peak envelope Using an incorrect background for a fit Failure to match background to the surrounding noise Employing varying peak widths in a fit when there was no goodchemical reason for doing so Adding too many synthetic peaks to a fit, ignoring the samplephysics and chemistry Attempting to fit and interpret noisy data when it was clear thatlittle meaningful information could be extracted from the 4b1b5a53/, ?originalSubdomain au, https://www.researchgate.net/profile/Alberto Herrera-Gomez, https://www.pnnl.gov/people/donald-baer
The Errors Red Category A paper could receive a Red rating if it contained a significantnumber of Orange errors or particularly egregious Orangeerrors Extreme truncation of the peak envelope in a narrow scan Gross failure to make the background match or be appropriatelyclose to the noise surrounding the peak envelope such that theresulting peak areas/quantitation would be meaningless, e.g.,the background line may cut through the spectral envelope Employing wildly varying peak widths in a fit when there was nogood chemical or physical reason for doing so Adding far too many synthetic peaks to a fit Attempting to fit extremely noisy 4b1b5a53/, ?originalSubdomain au, https://www.researchgate.net/profile/Alberto Herrera-Gomez, https://www.pnnl.gov/people/donald-baer
The Errors Red Category, Cont. Disregarding/neglecting spin-orbit splitting when it was present, not usingproper spin-orbit splitting ratios, or labelling a pair of spin-orbit peaks asseparate chemical states Failure to include the original data, e.g., showing only the synthetic peaks fora fit Gross mislabeling of chemical states, labeling noise as chemical states,omitting chemical states, or proposing impossible chemical states. Forexample, in their C 1s peak fitting, authors sometimes (i) mislabel (switch) theC-O and C O chemical states fitting, (ii) omit the C O state, (iii) try to fit thenatural asymmetry (tailing) in the C 1s signal of sp2-type carbon, e.g., fromgraphene or carbon nanotubes, as multiple carbon-oxygen type components,even when there is not enough oxygen in the material to justify thesesynthetic peaks, as indicated by a small or nonexistent O 1s peak from thesample – here, it might be better to first fit the C 1s spectrum from theunfunctionalized sp2-containing material with an asymmetric line shape, andthen use this line shape to fit the functionalized materials,45 and (iv) try to fit(and label) the shake-up signal(s) from materials containing sp2 carbon ascarbon-oxygen type chemical states. There are obviously many more ways that XPS spectra can be as-gengenbach-4b1b5a53/, ?originalSubdomain au, https://www.researchgate.net/profile/Alberto Herrera-Gomez, https://www.pnnl.gov/people/donald-baer
Measuring the Problem Five panel members evaluated these papersindividually, and then met and came to a consensus onevery paper There was good agreement in the initial ratings by theexperts: there was no disagreement among the fivepanelists regarding ca. 60% of the initial rankings, in ca.33% of all cases rankings fell into two neighboring colorcategories, and in only 7% of ranked papers did initialrankings differ by a greater amount. The sixth independent committee member thenreviewed all the initial recommendations. He mostlyagreed with the committee’s evaluations, but alsorecommended that a few of the papers that had beenclassified as Orange should be recategorized as 4b1b5a53/, ?originalSubdomain au, https://www.researchgate.net/profile/Alberto Herrera-Gomez, https://www.pnnl.gov/people/donald-baer
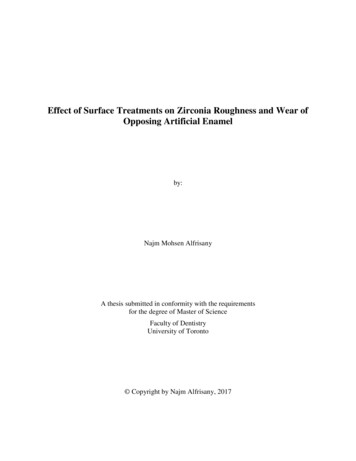
Measuring the Problem Our results: Our study was just accepted to JVSTAReprinted with permission from [George H. Major, Tahereh G. Avval, Behnam Moeini, et al., “Assessment of the frequency and nature of erroneous x-ray photoelectronspectroscopy analyses in the scientific literature” J. Vac. Sci. Technol. A 38, 061204; doi: 10.1116/6.0000685]. Copyright 2020., American Vacuum Society.
Which elements are shown in theliterature? Tim Nunney from Thermo Fisherpublished an analysis on LinkedIn of thefrequency with which the differentelements are searched at their XPSSimplified web site He provided us an even more completeset of this information Two months of results (a total of 48,996unique page views) We compared his infor
ASTM E42 Surface Analysis Community Forum Friday, November 6, 2020, This PDF file: The announcement for the Community Forum which was held November 6, 2020 The three presentations given as part of the Forum o Matthew R. Linford, An Assessment of the Frequency and Nature of Erroneous X-ray Photoelectron Spectroscopy (XPS) Analyses in the