Transcription
Lab 2: Making & Curing Concrete – ASTM C31, Slump Test –ASTM C143, Air Content Tests – ASTM C231, Rebound HammerTest – ASTM C805, Ultrasonic Pulse Velocity Test – ASTMC597, Compressive Strength of Concrete – ASTM C39Christopher Weber.838Group #1322 March 22, 2017
Weber.8382Table of ContentsObjectiveTest ResultsAnalysis . .3. . .4 .7Table of Tables and FiguresTable 1Table 2Table 3Table 4Table 5Figure 1Figure 2 .3 .3 .3 .5 .6 .7 .7Lab #2
Weber.8383Lab #2ObjectiveFollowing the mixing and curing of the concrete, the slump test, and air content test we shouldbe able to: Create an appropriate concrete mix. Discuss the effect of water cement ratio on the slump amount. Define and discuss the importance of air content in freshly mixed concrete.Following compressive strength of concrete test, the ultrasonic pulse velocity test, and therebound hammer test we should be able to: Realize and discuss the difference between destructive and non-destructive tests forassessing the compressive strength of concrete. Define and discuss the effect of curing time on the concrete compressive strength.ASTM C31 is widely used as the way to mix concrete on site. While ASTM C143 and ASTM C231are used to see if there is the correct amount of water and air, respectively, for the conditionlaid out. ASTM C805 is commonly used on structures and structure components not concretetest cylinders, but if used on concrete cylinders it can give a relative sense of the hardness ofthe concrete. While ASTM C597 is commonly used to test for defects in the concrete structures.ASTM C39 is used concrete manufacturing and mixing plants to test a batch to qualifications.Test ResultsTable 1: Concrete Mix Components for Group 13Concrete Componet Quantity Assigned Actual Quantity UsedCement (lbs)37.3537.35Course Aggregate (lbs)69.5169.51Fine Aggregate (lbs)62.2462.24Water Content (lbs)15.618.429Table 1 shows the quantity of each mix ingredient assigned and the actual quantity used in ourmix. Since our concrete mix was not fully saturated with the water initially assigned extra waterwas added. The extra water added was measured by measuring the weight of the bucket withthe extra water, then some was added slowly and until the mix was saturated, and finally thebucket was weighed and the difference was the amount of extra water added.Table 2: Slump and Air Percentage Measurements for Group 13Slump TestSlump Measure (inches)Slump TypeAir %Data2.75Normal4
Weber.8384Lab #2Table 2 shows the slump test results and the air content results. The slump type for our groupwas normal with a slump of 2.75 inches which was within the limitations set at the start of thelab. Our air content was measured to be 4 percent.Table 3: Compressive Strengths of Concrete Cylinders from Ultrasonic Pulse Velocity Test (ASTMC597)Day Cylinder Distance L Time (μsec) Pulse Velocity (in./sec.) Concrete Quality Concrete Strength 7.99649.9160240Very Good384348.14548.7167248Very Good354777.99949.5161596Very Very Good3696Table 3 shows the distances and times measured by the group using the UPV meter. Since theconcrete cylinder containers were 8 inches long our cylinders had a length that was near 8inches. The pulse velocity was calculated as shown below:𝑉 𝑉𝑐𝑦𝑙𝑖𝑛𝑑𝑒𝑟1 𝐿𝑇𝑖𝑚𝑒 10 68𝑖𝑛𝑐ℎ𝑒𝑠 15444051.8 10 6𝑠𝑒𝑐𝑜𝑛𝑑Using Table C from the lab packet the concrete quality was noted in Table 3. For example, apulse velocity of 157,480 inches per second correlates to a concrete quality of very good, whilethe pulse velocity for cylinder one which was calculated as a sample calculation was less than157,480 but greater than 137,795 inches per second therefore its quality was good.The concrete strength for each cylinder was calculated using the following equation: 5 𝑉𝑓𝑐 166.21 𝑒 1.96 10 5 154440𝑓𝑐 𝑜𝑓 𝑐𝑦𝑙𝑖𝑛𝑑𝑒𝑟1 166.21 𝑒 1.96 10 3430 𝑝𝑠𝑖
Weber.8385Lab #2Table 4: Compressive Strengths of Concrete Cylinders from Rebound Hammer Test (ASTM C805)Day71428CylinderRm (Mean Compressive3 Top Side 3 Bottome SideRebound Strength" " (psi)Recordings 517.2511.500166813.759.1671330Table 4 shows the results from the rebound hammer test on all cylinders on both the top andbottom surfaces. The Mean Rebound Value was calculated by excluding the highest and lowestreading from the data set for each cylinder. For example, cylinder one had a data set of 12, 13,12, 15, 12, and 13 therefore the readings of 15 and 12 (only excluding one of the highest andone of the lowest values only) are excluded when calculating the mean. The new data set wasnow 13, 12, 12, and 13. The average was then taken by summing up the values and thendivided by the number of values summed.𝑅𝑚 𝑟𝑒𝑏𝑜𝑢𝑛𝑑 𝑣𝑎𝑙𝑢𝑒𝑠 𝑒𝑥𝑐𝑙𝑢𝑑𝑖𝑛𝑔 𝑡ℎ𝑒 ℎ𝑖𝑔ℎ𝑒𝑠𝑡 𝑎𝑛𝑑 𝑙𝑜𝑤𝑒𝑠𝑡 𝑣𝑎𝑙𝑢𝑒𝑠4
Weber.8386𝑅𝑚 Lab #213 12 12 13 12.54The compressive strength was then calculated in Megapascals by interpolating table D in thelab packet as follows:𝜎 𝜎1 (𝑅𝑚 𝑅𝑚1 ) (𝜎2 𝜎1𝜎217.2) 𝑅𝑚 () 𝑅𝑚 ()𝑅𝑚2 𝑒𝑟1 12.5 (17.2) 8.333 𝑀𝑃𝑎25.8The compressive strength was then converted into psi as follows:𝜎𝑐𝑦𝑙𝑖𝑛𝑑𝑒𝑟1 145.038 𝑝𝑠𝑖𝑝𝑠𝑖 𝜎𝑐𝑦𝑙𝑖𝑛𝑑𝑒𝑟1 8.333 𝑀𝑃𝑎 145.038 () 1209 𝑝𝑠𝑖1 𝑀𝑃𝑎𝑀𝑃𝑎Table 5: Compressive Loads, Break Types, and Concrete Strength from Machine Crushing 828928ConcreteCompressive LoadBreak Type 277360shear6156cone and842806707shear77740shear6186Table 5 shows the measured compressive load and break type of each cylinder with the age ofeach cylinder. The most common break type seen for our group was shear. The concretestrength was calculated as shown below:𝜎 𝜎𝑐𝑦𝑙𝑖𝑛𝑑𝑒𝑟1 𝐹𝐴59060 4700 𝑝𝑠𝑖𝜋 22
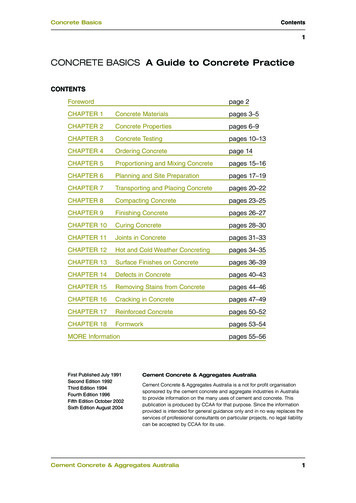
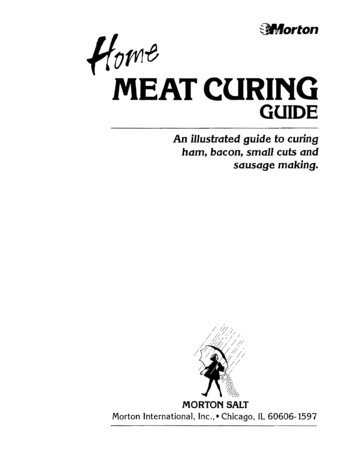
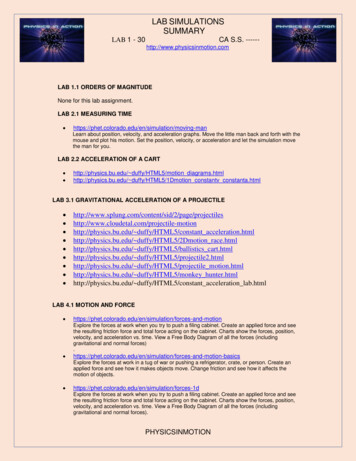
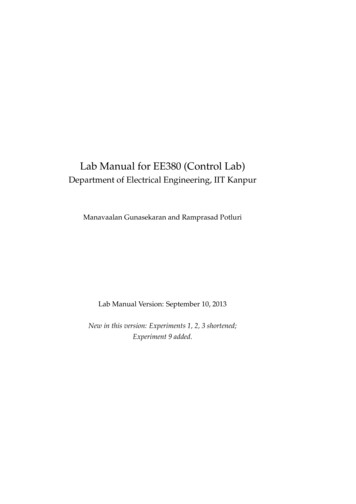
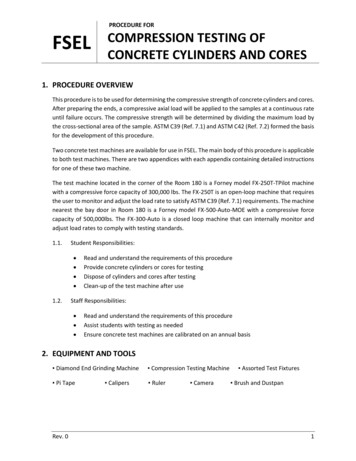
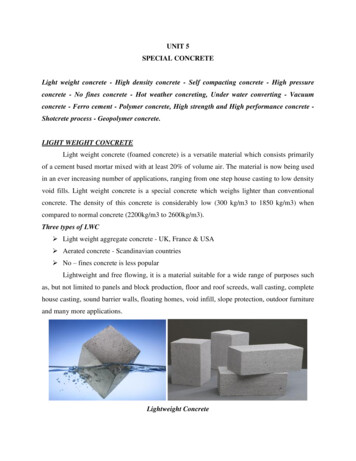
Weber.8387Lab #2AnalysisFigure 1: Figure of Group 13’s Data for the 3 Tests on Days 7, 14, and 28 (with a line of best fitfor each of the 3 tests) *Data Points May Overlap due to them being relatively close to one andanother*Figure 1 shows our groups data collected for all the cylinders for all three tests on all threedays. It can be seen on the figure that all data sets increase as curing time increased. Thisfollows what should happen, since curing is used to increase concrete strength.Figure 2: Figure of All Groups’ (1-18’s) Average Compressive Strength from MachineCompression on the 28th Day given their Calculated Water-Cement Ratio of their RespectiveMixes (with a line of best fit)
Weber.8388Lab #2Figure 2 shows relationship between the water-cement ratio and concrete compressivestrength. Based on all the groups data the relationship follows the concept that more waterdecreases the overall compressive strength of the concrete.1. What purpose do water, cement, coarse aggregate and fine aggregate play in concrete?a. Aggregates act as a filler in concrete, and thus improves the economy of the mix.The larger the aggregate, the more volume they take up. Fine aggregates take upless volume than the coarse aggregate, so it is necessary for there to be moreaggregate. Aggregates have a greater volume stability than the cement paste, soit necessary to find the proper mix of fine and coarse to make up the mix. Thecement paste acts as the glue to the mix, and holds everything together. Oncethe water is added, the cement to begin to harden in a process known ashydration. The water to cement ratio is the most critical factor in the productionof concrete. Too much water reduces the concrete strength, while too little willmake the concrete unworkable.2. What does the slump indicate, both the value and the type?a. When we perform the slump test, we are measuring the workability of theconcrete. After removing the slump cone, the difference between the top of thecone and the top of the concrete is the value that you are looking for. Lookingback to Figure 1, it is apparent that there are different slumps depending onwhat happens when the cone is removed. Usually, values between 1” and 3” areclassified as normal slump. This means that the concrete mix has the rightconsistency between you mix. If the difference is less than 1” than there is notenough water in the mix, and this would be classified as zero slump. Adversely, ifthe difference is more than 3”, there is too much water and the mix needs to beadjusted. This could classify as a collapse slump depending on the severity of thefall. A shear slump would indicate that the mix lacks cohesion, and thus would beundesirable for the durability of the concrete.3. What role does the air content play in the final concrete product?a. Air content plays a key role in the strength of the cured concrete, as well as theworkability of fresh concrete. In fresh concrete, the air bubbles act as a lubricantand increases its workability and slump. Often, air entraining admixtures areadded to increase the strength of the concrete, especially in freeze-thawenvironments. A larger air content percentage would be necessary forcontinually wet-freeze-thaw. These “air pockets” provide space for water toexpand upon freezing, rather than expanding and harming the durability of theconcrete. It is important to test the air content of the mix before it is placed inthe mold to cure in these situations.
Weber.8389Lab #24. What level of exposure would your concrete mix be suitable for, or is it not suitable forany exposure level? The maximum aggregate size is 3/8 inches. Explain you reasoning.a. Our air percentage was 4%, which would meet the requirement for mildexposure with a max aggregate size of 3/8”. Even though the target value formild exposure is 4.5%, specifications often allow -1% to 2% of the target value,and our value falls into this category.5. Do you expect a change in the air content of freshly mixed concrete and the final inplace concrete? Explain your reasoning.a. I would expect a change in air content that would be less than plus or minus 1 to2 percentage points. This would be due to the shrinkage of the concrete as itcures. These air pockets would be shrinking or getting larger as the concretecures. Therefore, cracks occur because the concrete will literally pull itself apart.6. Compare the 3 compressive strengths versus curing time curves (Figure 1). What couldbe the reasons for these differences? Which curve is the most accurate and why?a. The curve for the rebound hammer test went from around 1400 psi to a littleover 1500 psi, while the Ultrasonic Pulse Velocity Test started around 3600 psiand ended around 3800 psi on the 28th day. The machine crushing test resultedin a curve that started around 5600 psi and on the 28 th day ended around 6400psi.b. The reason for the differences in these curves is a result of the applications ofeach of these tests and what these results mean. For example, the UltrasonicPulse Velocity Test is intended to find any defects in the concrete.c. The curve which is the most accurate is the Machine crushing test since that testis intended to measure the max force until the cylinder breaks and ultimately themax compressive strength of that test subject.7. What is the common application of the rebound hammer test and ultrasonic pulsevelocity test in practice? What are the advantages and disadvantages of each?a. The Rebound Hammer Test is used to assess the uniformity of concrete andassess the quality of concrete in relation to standard requirements.i. Advantages: Simple to use; no special experience is needed to conductthe test; establishes uniformity of properties; equipment is inexpensiveand is readily available; a wide variety of concrete test hammers areavailable with an operational range ofM10 to M70; it is a nondestructivetest.ii. Disadvantages: Evaluates only the local point and layer of masonryto which it is applied; no direct relationship to strength ordeformation properties; unreliable for the detection of flaws; cleaningmaintenance of probe and spring mechanism.b. The Ultrasonic Pulse Velocity test is used in practice to detect defects ordeformations.
Weber.83810Lab #2i. Advantages: It has high penetrating power which ensure very easymeasurement even for the very deep concrete members; it is highlysensitive thus giving accurate results; easy to use for estimating the size,shape and nature of flaws in the concrete member; it is a nondestructivetest.ii. Disadvantages: Manual operation of the instrument requires carefulattention by experienced technicians; if the surface is irregular it isdifficult to estimate accurately the pulse velocity; test objects must bewater resistant.8. What are some factors that could affect the accuracy of the ultrasonic pulse velocitytest?a. Smoothness of surface, irregular surface plane, path length, lateral dimension ofthe specimen tested, presence of reinforcement steel, and moisture content ofthe concrete can affect the accuracy of the test.9. How does a UPV meter detect any flaws or defects present in the concrete?a. By doing multiple test concrete cylinders from the concrete batch a defect canbe seen from a longer time for the beam to go through the cylinder, thus aslower speed calculated for a specific cylinder when compared to the others.10. How does curing time affect the strength of concrete?a. As seen from the trend for all three curves for Figure 1 the longer the curing ti
ASTM C31 is widely used as the way to mix concrete on site. While ASTM C143 and ASTM C231 are used to see if there is the correct amount of water and air, respectively, for the condition laid out. ASTM C805 is commonly used on structures and structure components not concrete test cylinders, but if used on concrete cylinders it can give a relative sense of the hardness of the concrete. While .